K92 Mining Announces 2023 Q1 Financial Results Including Multiple Process Plant Records Significantly Exceeding the Stage 2A Expansion Design and Record Development
VANCOUVER, British Columbia, May 15, 2023 (GLOBE NEWSWIRE) -- K92 Mining Inc. (“K92” or the “Company”) (TSX: KNT; OTCQX: KNTNF) is pleased to announce financial results for the three months ended March 31, 2023.
Safety
- Zero Lost Time Injuries (“LTI”) during the quarter, and proactive and focused management of COVID-19. K92 has continuously operated throughout the COVID-19 pandemic, and has strong preventative and response plans in place.
Production
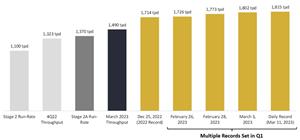
- Record monthly ore processed achieved in March, averaging 1,490 tonnes per day (“tpd”), 9% above the Stage 2A Expansion run-rate of 1,370 tpd. Multiple new daily records set during the quarter, with the highest mill tonnes processed to date being 1,815 tonnes on March 11. Importantly, the records were achieved prior to commissioning of the final Stage 2A Expansion plant upgrade, the flotation expansion, with wet commissioning currently underway in Q2. The completion of this final Stage 2A Expansion upgrade is expected to improve recoveries and potentially increase plant throughput even further.
- Quarterly ore processed of 117,903 tonnes or 1,310 tpd, our third highest on record, even after encountering 8 days of unplanned process plant downtime as previously reported and increasing 18% from Q1 2022.
- As previously reported, head grade was impacted by underground mining encountering an area with more challenging ground conditions than expected in Kora, which impacted near-term production stoping rates and access to higher grade material during the quarter. Generally, mill feed would be supplemented by mining from additional mining fronts in these situations; however, due to development rates being below budget for several quarters during the COVID-19 pandemic, many of the alternative mining areas were not yet developed, therefore supplementing from lower grade sources (stockpile and underground) was required during Q1. As previously reported, we expect Q2 to be moderately below budget, with the second half of 2023 being our strongest, and 2023 production in the bottom half of the guidance range.
- Total material mined (ore plus waste) of 277,534 tonnes mined during the quarter, an increase of 33% from Q1 2022.
- Quarterly production of 21,488 oz gold equivalent (“AuEq”), or 17,593 oz gold, 1,651,297 lbs copper and 29,859 silver (1) (2).
- Cash costs of US$758/oz gold and all-in sustaining costs (“AISC”) of US$1,506/oz gold (2).
Financials
- Cash position of US$88.6 million as of March 31, 2023 while remaining debt-free. Strong working capital position of $117.3 million as of March 31, 2023, with a quarterly increase in receivables of $5.9 million, increase in inventory of $3.4 million and accounts payable decreasing by $7.2 million. During the quarter a record $23.5 million was spent on property, plant and equipment.
- Revenue of US$40.4 million.
- Net income of US$5.0 million or $0.02 per share.
- Sales of 17,602 oz gold, 1,538,590 lbs copper and 29,164 oz silver. Gold concentrate and doré inventory of 3,292 oz as of March 31, 2023, a decrease over the prior quarter of 320 oz.
- Operating cash flow (before working capital adjustments) for the three months ended March 31, 2023, of US$16.5 million or US$0.07 per share, and earnings before interest, taxes, depreciation and amortization (“EBITDA”) (2) of US$14.8 million or US$0.06 per share.
Growth
- The Stage 2A Expansion to 500,000 tonnes per annum (“tpa”) continued to progress during the quarter, and subsequent to quarter end, the final major remaining expansion item, the new rougher flotation cells, commenced commissioning and are currently in the wet commissioning stage. The performance of the process plant to date continues to demonstrate the potential to ultimately exceed the Stage 2A Expansion run-rate. Additional mining equipment arrived on site during Q1, including a new jumbo, loader, two integrated tool carriers, Normet explosive charging machine, cement agitator truck and a new long hole drill rig. During the remainder of the first half of 2023, two underground trucks and one jumbo are scheduled for delivery. The arrivals of equipment are to both replace existing equipment and expand the fleet.
- Strong results from 89 diamond drill holes were reported from underground and surface at Kora, Kora South, Judd, Judd South and Northern Deeps, including 5 dilatant zone intersections plus multiple high-grade results. The dilatant intersections from surface drilling include:
- KUDD0035 recording 50.05 m at 5.25 g/t AuEq from the K1 Vein at Kora South,
- KUDD0033 recording 27.90 m at 10.48 g/t AuEq from the K2 Vein at Kora South,
- KUDD0038 recording 14.00 m at 5.49 g/t AuEq from the K1 Vein at Kora South,
- KUDD0032 recording 30.30 m at 6.13 g/t AuEq from the J1 Vein at Judd South, and
- KUDD0038 recording 28.70 m at 4.53 g/t AuEq from the J1 Vein at Judd South.
Other highlights include: - Judd surface hole KODD0026 recording 5.40 m at 56.76 g/t AuEq from the J1 Vein, and
- Kora underground hole KMDD0504 recording 6.12 m at 88.44 g/t AuEq from the K1 Vein (see February 21, 2023 press release).
- Significant advance of the twin incline in Q1, with incline #2 (6m x 6.5m) advanced to 2,172 metres and #3 (5m x 5.5m) advanced to 2,230 metres as of March 31, 2023. Overall mine development during the quarter of 2,278 metres, an increase of 48% from Q1 2022 and a quarterly record. The twin incline advance is ahead of schedule and as a result we expect first ore to be mined at Kora at depth in Q4, establishing a major new mining front at depth that will provide a significant boost to operational flexibility in 2024. We note that this area was not included in the 2023 budget and it is being mined earlier as a result of strong development advance rates.
The Company’s interim consolidated financial statements and associated management’s discussion and analysis for the quarter ended March 31, 2023 are available for download on the Company’s website and under the Company’s profile on SEDAR (www.sedar.com). All amounts are in U.S. dollars unless otherwise indicated.
See Figure 1: Quarterly Production and AISC Chart
See Figure 2: Quarterly Total Ore Processed, Development Metres Advanced and Total Mined Material Chart
See Figure 3: Ore Processed Daily Records Chart
John Lewins, K92 Chief Executive Officer and Director, stated, “During the first quarter we continued to expand our operational capabilities with multiple records achieved while working through some short-term and localized challenges operationally.
Firstly, the process plant has continued to perform exceptionally well, setting a new monthly ore processed record in March of 1,490 tpd which is 9% higher than the Stage 2A Expansion design of 1,370 tpd. The plant also delivered multiple new daily records well in excess of the Stage 2A Expansion design, with the latest record of 1,815 ore tonnes processed on March 11. Importantly, this strong performance was achieved prior to the commissioning of the additional flotation cells being installed for the Stage 2A Expansion, and I am pleased to report that this final upgrade is currently in the wet commissioning phase. Completion of this upgrade is expected to provide a boost to metallurgical recoveries and plant flexibility to potentially increase throughput further.
In terms of the underground mine, having recently returned from site in late-April, the operational performance has made a solid improvement in the second quarter to date. Kora and Judd are exceptional orebodies; we have mined and sequentially expanded them successfully for 5 years and rapidly increasing our operational flexibility is a major focus. The last two quarters delivered record development advance towards opening up more mining areas, our material rates have been strong, our stoping sequence is setting the operation up for a strong second half of the year and we expect our operational flexibility to increase significantly in multiple areas as the year progresses.
Lastly, we remain very excited about our exploration progress so far this year and into the rest of 2023. The majority of our eleven drill rigs operating are focused on resource growth, and the reported results to date have been very strong, demonstrating an increasing hit-rate of dilatant zone intersections and expansion of the drilled deposit extents at Kora-Kora South and Judd-Judd South (see February 21, 2023 press release). We expect to provide another extensive exploration update shortly. Porphyry drilling on A1, our top copper-gold porphyry target, has also commenced and we are currently on our second hole, with an update planned to be released in due course.”
| Mine Operating Activities | ||
| Three months ended March 31, 2023 | Three months ended March 31, 2022 | |
| Operating data | ||
| Head grade (Au g/t) | 5.2 | 8.3 |
| Gold recovery (%) | 89.1% | 90.9% |
| Gold ounces produced | 17,593 | 24,152 |
| Gold ounces equivalent produced (1) (2) | 21,488 | 28,188 |
| Tonnes of copper produced | 749 | 692 |
| Silver ounces produced | 29,859 | 28,142 |
| Financial data (in thousands of dollars) | ||
| Gold ounces sold | 17,602 | 26,471 |
| Revenues from concentrate and doré sales | US$40,366 | US$52,412 |
| Mine operating expenses | US$8,753 | US$8,738 |
| Other mine expenses | US$8,241 | US$9,400 |
| Depreciation and depletion | US$6,744 | US$4,397 |
| Statistics (in dollars) | ||
| Average selling price per ounce, net | US$1,807 | US$1,769 |
| Cash cost per ounce (2) | US$758 | US$536 |
| All-in sustaining cost per ounce (2) | US$1,506 | US$788 |
Notes:
(1) Gold equivalent in Q1 2022 is calculated based on: gold $1,879 per ounce; silver $24 per ounce; and copper $3.95 per pound. Gold equivalent in Q1 2023 is calculated based on: gold $1,890 per ounce; silver $22.55 per ounce; and copper $4.05 per pound.
(2) The Company provides some non-international financial reporting standard measures as supplementary information that management believes may be useful to investors to explain the Company’s financial results. Please refer to non-IFRS financial performance measures on pages 12 and 13 of the Company’s management’s discussion and analysis dated May 12, 2023, available on SEDAR or the Company’s website, for reconciliation of these measures.
Mineral resources that are not mineral reserves do not have demonstrated economic viability.
Conference Call and Webcast to Present Results
K92 will host a conference call and webcast to present the 2023 first quarter financial results at 8:30 am (EDT) on Monday, May 15, 2023.
- Listeners may access the conference call by dialing toll-free to 1-800-319-4610 within North America or +1-604-638-5340 from international locations.
The conference call will also be broadcast live (webcast) and may be accessed via the following link: https://services.choruscall.ca/links/k92mining2023q1.html
Qualified Person
K92 Mine Geology Manager and Mine Exploration Manager, Mr. Andrew Kohler, PGeo, a qualified person under the meaning of Canadian National Instrument 43-101 – Standards of Disclosure for Mineral Projects, has reviewed and is responsible for the technical content of this news release.
About K92
K92 Mining Inc. is engaged in the production of gold, copper and silver at the Kainantu Gold Mine in the Eastern Highlands province of Papua New Guinea, as well as exploration and development of mineral deposits in the immediate vicinity of the mine. The Company declared commercial production from Kainantu in February 2018 and is in a strong financial position. A maiden resource estimate on the Blue Lake copper-gold porphyry project was completed in August 2022. K92 is operated by a team of mining company professionals with extensive international mine-building and operational experience.
On Behalf of the Company,
John Lewins, Chief Executive Officer and Director
For further information, please contact David Medilek, P.Eng., CFA, President at +1-604-416-4445
CAUTIONARY STATEMENT REGARDING FORWARD-LOOKING INFORMATION: This news release includes certain “forward-looking statements” under applicable Canadian securities legislation. Such forward-looking statements include, without limitation: (i) the results of the Kainantu Project Definitive Feasibility Study, and the Kainantu 2022 Preliminary Economic Assessment, including the Stage 3 Expansion, a new standalone 1.2 mtpa process plant and supporting infrastructure; (ii) statements regarding the expansion of the mine and development of any of the deposits; and (iii) the Kainantu Stage 4 Expansion, operating two standalone process plants, larger surface infrastructure and mining throughputs.
All statements in this news release that address events or developments that we expect to occur in the future are forward-looking statements. Forward-looking statements are statements that are not historical facts and are generally, although not always, identified by words such as “expect”, “plan”, “anticipate”, “project”, “target”, “potential”, “schedule”, “forecast”, “budget”, “estimate”, “intend” or “believe” and similar expressions or their negative connotations, or that events or conditions “will”, “would”, “may”, “could”, “should” or “might” occur. All such forward-looking statements are based on the opinions and estimates of management as of the date such statements are made. Forward-looking statements are necessarily based on estimates and assumptions that are inherently subject to known and unknown risks, uncertainties and other factors, many of which are beyond our ability to control, that may cause our actual results, level of activity, performance or achievements to be materially different from those expressed or implied by such forward-looking information. Such factors include, without limitation, Public Health Crises, including the COVID-19 Pandemic; changes in the price of gold, silver, copper and other metals in the world markets; fluctuations in the price and availability of infrastructure and energy and other commodities; fluctuations in foreign currency exchange rates; volatility in price of our common shares; inherent risks associated with the mining industry, including problems related to weather and climate in remote areas in which certain of the Company’s operations are located; failure to achieve production, cost and other estimates; risks and uncertainties associated with exploration and development; uncertainties relating to estimates of mineral resources including uncertainty that mineral resources may never be converted into mineral reserves; the Company’s ability to carry on current and future operations, including development and exploration activities; the timing, extent, duration and economic viability of such operations, including any mineral resources or reserves identified thereby; the accuracy and reliability of estimates, projections, forecasts, studies and assessments; the Company’s ability to meet or achieve estimates, projections and forecasts; the availability and cost of inputs; the availability and costs of achieving the Stage 3 Expansion or the Stage 4 Expansion; the ability of the Company to achieve the inputs the price and market for outputs, including gold, silver and copper; inability of the Company to identify appropriate acquisition targets or complete desirable acquisitions; failures of information systems or information security threats; political, economic and other risks associated with the Company’s foreign operations; geopolitical events and other uncertainties, such as the conflict in Ukraine; compliance with various laws and regulatory requirements to which the Company is subject to, including taxation; the ability to obtain timely financing on reasonable terms when required; the current and future social, economic and political conditions, including relationship with the communities in Papua New Guinea and other jurisdictions it operates; other assumptions and factors generally associated with the mining industry; and the risks, uncertainties and other factors referred to in the Company’s Annual Information Form under the heading “Risk Factors”.
Estimates of mineral resources are also forward-looking statements because they constitute projections, based on certain estimates and assumptions, regarding the amount of minerals that may be encountered in the future and/or the anticipated economics of production. The estimation of mineral resources and mineral reserves is inherently uncertain and involves subjective judgments about many relevant factors. Mineral resources that are not mineral reserves do not have demonstrated economic viability. The accuracy of any such estimates is a function of the quantity and quality of available data, and of the assumptions made and judgments used in engineering and geological interpretation, Forward-looking statements are not a guarantee of future performance, and actual results and future events could materially differ from those anticipated in such statements. Although we have attempted to identify important factors that could cause actual results to differ materially from those contained in the forward-looking statements, there may be other factors that cause actual results to differ materially from those that are anticipated, estimated, or intended. There can be no assurance that such statements will prove to be accurate, as actual results and future events could differ materially from those anticipated in such statements. Accordingly, readers should not place undue reliance on forward-looking statements. The Company disclaims any intention or obligation to update or revise any forward-looking statements, whether as a result of new information, future events or otherwise, except as required by law.
Figure 1: Quarterly Production and AISC Chart
https://www.globenewswire.com/NewsRoom/AttachmentNg/6b529a80-a751-4678-bf6d-ab2f47eb79aa
Figure 2: Quarterly Total Ore Processed, Development Metres Advanced and Total Mined Material Chart
https://www.globenewswire.com/NewsRoom/AttachmentNg/5cae34ac-761f-4306-ae69-93c59dada4df
Figure 3: Ore Processed Daily Records Chart
https://www.globenewswire.com/NewsRoom/AttachmentNg/3b25ef4f-486e-4377-9e5c-82c2a5742f92

Figure 1
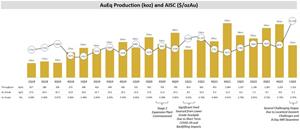
Quarterly Production and AISC Chart
Figure 2
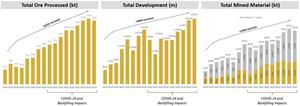
Quarterly Total Ore Processed, Development Metres Advanced and Total Mined Material Chart
Figure 3