SSR Mining Achieves Revised 2022 Production Guidance and Updates Three-Year Outlook
SSR Mining Inc. (NASDAQ/TSX: SSRM; ASX: SSR) (“SSR Mining” or the “Company”) announces full year 2022 production and cost of sales as well as the Company’s outlook for 2023 to 2025. In 2022, SSR Mining’s four operating assets produced 623,819 gold equivalent ounces, delivering solid fourth quarter performance of 182,655 gold equivalent ounces and meeting the Company’s revised guidance targets. Full year 2022 cost of sales of $985 per gold equivalent ounce and all-in sustaining costs (“AISC”) of $1,339 per gold equivalent ounce were also in line with guidance.
This press release features multimedia. View the full release here: https://www.businesswire.com/news/home/20230209005581/en/
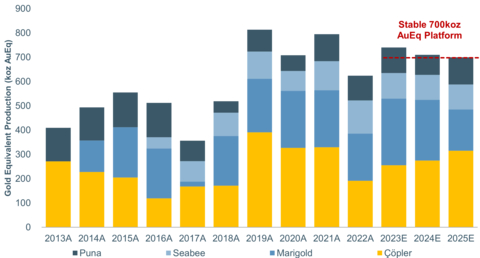
SSR Mining Production History and Outlook: Forecasts from 2023 to 2025 based on mid-point of three-year outlook. (Graphic: Business Wire)
The Company expects to deliver a strong and stable production base in 2023 with total production of 700,000 to 780,000 gold equivalent ounces at consolidated cost of sales of $1,055 to $1,115 per gold equivalent ounce and AISC of $1,365 to $1,425 per gold equivalent ounce. In the updated three-year outlook, SSR Mining expects to maintain an average production base of approximately 700,000 gold equivalent ounces per year through 2025.
Reflecting the growth opportunities within the portfolio, as evidenced by the positive exploration results announced at Çakmaktepe Extension, Marigold, and Seabee over the last six months, the Company will increase its 2023 exploration and resource development budget by approximately 50% over 2022. The increased budget is expected to target the acceleration of Mineral Resource conversion and mine life extension activities across the portfolio, helping position SSR Mining to deliver a long-term production profile above 700,000 gold equivalent ounces without significant capital investment requirements through the end of the decade.
Rod Antal, President and CEO of SSR Mining, said, “We enter 2023 with all assets operating at a steady state, supporting our expectations for a strong year of production and free cash flow generation. We expect to deliver first production from Ҫӧpler’s Çakmaktepe Extension project in 2023 and we are also initiating waste stripping activities at Marigold’s Red Dot later this year, in line with Marigold’s optimized life of mine plan.
After returning approximately $350 million to shareholders over the last two years, our base dividend continues to yield nearly 2% on an annual basis and, contingent on the gold price environment and equity valuations, we may supplement that dividend with potential share repurchases in 2023 as we have done over the past two years. While our free cash flow outlook remains robust, AISC are moderately higher year-over-year due to a combination of inflationary pressures, sustaining capital commitments to develop and ramp-up the Çakmaktepe Extension project, and capital and operating costs, including haul truck purchases, associated with the acceleration of planned waste stripping activities at Marigold’s Red Dot target.
We expect to deliver another catalyst-rich year for the business, as we continue to see additional exploration upside across the portfolio. At Ҫӧpler, we continue to advance the C2 expansion project, while Marigold should begin to define some of the longer-term upside presented by the New Millennium, Trenton Canyon and Buffalo Valley targets. Overall, the business is in a good position both operationally and financially as we begin 2023, and we look forward to delivering the anticipated strong production growth, free cash flow generation and capital returns to shareholders.”
__________________________________
(1) During the fourth quarter of 2022, the Company has revised the “Production costs” caption to “Cost of sales” within its Consolidated Statements of Operations to provide a more accurate description of the costs and align with commonly used terminology by industry participants. No changes were made to the previously reported amounts or the applicable accounting policies. Cost of sales excludes depreciation, depletion, and amortization.
(2) The Company reports non-GAAP financial measures including free cash flow, cash costs, AISC, cash costs per ounce sold and AISC per ounce sold, which are common measures in the mining industry, to manage and evaluate its operating performance at its mines. See "Cautionary Note Regarding Non-GAAP Financial Measures" for an explanation of these financial measures and a reconciliation of these financial measures to the most comparable GAAP financial measures.
Full Year 2023 Outlook
Operating Guidance (100% basis) (1) |
|
Çöpler (2) |
Marigold |
Seabee |
Puna |
Other |
Consolidated |
Gold Production |
koz |
240 — 270 |
260 — 290 |
100 — 110 |
— |
— |
600 — 670 |
Silver Production |
Moz |
— |
— |
— |
8.0 — 9.0 |
— |
8.0 — 9.0 |
Gold Equivalent Production |
koz |
240 — 270 |
260 — 290 |
100 — 110 |
100 — 110 |
— |
700 — 780 |
Cost of Sales per Ounce (3) |
$/oz |
1,070 — 1,100 |
1,000 — 1,030 |
810 — 840 |
18.00 — 19.50 |
— |
1,055 — 1,115 |
Cash Cost per Ounce (4) |
$/oz |
1,060 — 1,090 |
1,000 — 1,030 |
810 — 840 |
14.00 — 15.50 |
— |
1,015 — 1,075 |
Sustaining Capital Expenditures (5) |
$M |
45 |
81 |
33 |
15 |
— |
174 |
Sustaining Exploration Expenditures |
$M |
4 |
6 |
— |
3 |
— |
13 |
Reclamation Cost Accretion & Amortization |
$M |
2 |
2 |
4 |
2 |
— |
10 |
General & Administrative |
$M |
— |
— |
— |
— |
68 — 73 |
68 — 73 |
All-In Sustaining Cost per Ounce (4) |
$/oz |
1,245 — 1,295 |
1,315 — 1,365 |
1,160 — 1,210 |
16.25 — 17.75 |
— |
1,365 — 1,425 |
Growth Capital Expenditures |
$M |
40 |
— |
2 |
— |
— |
42 |
Growth Exploration and Resource Development Expenditures (6) |
$M |
27 |
20 |
21 |
5 |
9 |
81 |
Total Growth Capital |
$M |
67 |
20 |
23 |
5 |
9 |
123 |
| (1) | Figures may not add due to rounding. |
|
| (2) | Figures are reported on a 100% basis. Çöpler is 80% owned by SSR Mining. |
|
| (3) | Excludes depreciation, depletion, and amortization. |
|
| (4) | SSR Mining reports the non-GAAP financial measures of cash costs and AISC per payable ounce of gold and silver sold to manage and evaluate operating performance at Çöpler, Marigold, Seabee and Puna. See “Cautionary Note Regarding Non-GAAP Measures” at the end of this press release for an explanation of these financial measures and a reconciliation of these financial measures to cost of sales, previously referred to as production costs, which is the most comparable GAAP financial measures. AISC includes reclamation cost accretion and amortization and certain lease payments. |
|
| (5) | Excludes sustaining exploration and evaluation expenditures. Includes approximately $9 million in lease payments at Çöpler. Includes $19 million in underground mine development at Seabee. |
|
| (6) | Growth exploration and resource development expenditures are shown on a 100% basis, of which SSR Mining attributable amount totals $76 million. |
Three-Year Production Outlook
Operating Guidance (100% basis) (7) |
|
2022A |
2023E |
2024E |
2025E |
Çöpler (8) |
koz |
191 |
240 — 270 |
260 — 290 |
300 — 330 |
Marigold |
koz |
195 |
260 — 290 |
215 — 245 |
155 — 185 |
Seabee |
koz |
136 |
100 — 110 |
95 — 105 |
95 — 105 |
Puna |
Moz |
8.4 |
8.0 — 9.0 |
8.0 — 9.0 |
8.0 — 9.0 |
Gold Equivalent Production (9) |
koz |
624 |
700 — 780 |
670 — 750 |
660 — 740 |
Gold Equivalent Production Mid-Point |
koz |
— |
740 |
710 |
700 |
(7) |
Figures may not add due to rounding. |
|
(8) |
Figures are reported on a 100% basis. Çöpler is 80% owned by SSR Mining. |
|
(9) |
Full-year 2022 sales were approximately 617,000 gold equivalent ounces. |
2023 Outlook — Priority Operational Targets and Catalysts
Çöpler: Deliver First Production From Çakmaktepe Extension; Advance the C2 Project
- First oxide production from Çakmaktepe Extension anticipated in 2023
- Advance development of the C2 expansion project to pre-feasibility study level and publish maiden Mineral Reserves and updated Mineral Resources
- Near-mine exploration activity, complemented by regional work on the Kartaltepe licenses that includes drilling on the Mavidere porphyry targets
Marigold: Commence Stripping at Red Dot; Showcase Pathways for Mine Plan Enhancement
- Evaluate potential contributions from New Millennium for an improved and extended life of mine production profile
- Start of waste stripping activities at the Red Dot target accelerated from the prior timeline in order to optimize Marigold’s near- to medium- term production profile
- Expanded exploration program focusing on higher-grade oxides, resource expansion and reserve conversion at New Millennium, and defining a longer-term pathway to potential production at the Trenton Canyon and Buffalo Valley targets
Seabee: Convert and Expand Mineral Reserve Inventory
- Continuous improvement programs targeting full year underground production and mill throughput targets above 1,250 tonnes per day in 2023
- Expanded exploration program focusing on continued delineation of additional Mineral Reserves and Mineral Resources near existing infrastructure at Santoy as well as drilling deep extension targets to evaluate potential future mining opportunities at depth
- Advance internal analysis of longer-term opportunities such as Porky Main and Porky West targets and further drilling at regional targets for potential longer-term production pathways
Puna: Accelerate Near-Mine Exploration for Potential Mine Life Extension
- Release first exploration drilling results from near-mine activity at Puna since 2018
- Expanded exploration program with a continued focus on delineation of in-pit and near-mine targets with potential to add to existing Mineral Reserve life
- Refocused regional exploration targeting longer-term upside opportunities
Global: Continual Improvement and Longer-term Growth Initiatives
- Release Sustainability Report highlighting continued progress of ESG priorities
- Continue track record of strong capital returns, including the base dividend and potential share repurchases, while also fulfilling the pillars of our capital allocation program which includes reinvesting in the business
- Progress operational excellence and supply chain management initiatives to limit the impact of inflation
- Advancing exploration activity across regional platforms: Türkiye, Nevada, Saskatchewan, and Argentina via enhanced exploration spend of approximately $9 million
Guidance Overview
Production in 2023 is expected to be approximately 55% weighted to the second half, with the strongest consolidated production period in the third quarter. This production distribution reflects higher grades stacked at Marigold in the second quarter and early in the third quarter of 2023, as well as planned maintenance at Çöpler in the second quarter and a lower grade profile from Seabee in the first half. AISC is expected to be materially above full year guidance in the first half of 2023, reflecting the aforementioned production weighting and planned maintenance period at Ҫӧpler, as well as a sustaining capital spend profile weighted approximately 75% to the first half. Costs in the second half of 2023 are expected to be below the full year guidance range. Accordingly, free cash flow generation in 2023 is expected to 90 to 95% weighted to the second half of the year due to the capital spend profile, as well as annual tax and royalty payments incurred in the first half of 2023.
As the Company advances its exploration and resource development projects, technical work on updated life of mine plans will continue and new Technical Report Summaries (“TRS”) may be prepared as required. As these projects remain in progress, SSR Mining’s forthcoming Mineral Reserve and Mineral Resource (“MRMR”) update, which will be included in the Company’s Annual Report on Form 10-K, is not expected to incorporate any developments since the December 31st, 2021 effective date of SSR Mining’s 2021 MRMR statement. Accordingly, the 2022 MRMR will solely reflect depletion that occurred through 2022 mining activity. Material updates, if any, would be incorporated into new TRS reports should the ongoing technical work so require.
Çöpler, Türkiye
In 2022, gold production for Çöpler was 191,366 ounces, above the revised full-year guidance. Gold production was 65,603 ounces in the fourth quarter of 2022, at cost of sales of $1,065/oz and AISC of $1,269/oz. The sulfide plant operated at an average throughput rate of more than 8,000 tonnes per day in the fourth quarter of 2022, reflecting the successful ramp up of operations that began late in the preceding quarter.
In 2023, Çöpler is expected to produce 240,000 to 270,000 ounces of gold at mine site cost of sales of $1,070 to $1,100 per payable ounce and AISC of $1,245 to $1,295 per payable ounce, reflecting the costs associated with the ramp up of mining activity at the Çakmaktepe Extension starter pit, where first production is expected in 2023.
Ҫӧpler’s expected production profile is approximately 55% weighted to the second half of 2023, reflecting a second half weighted grade profile and the planned maintenance shutdown in the second quarter. Oxide production of approximately 40,000 ounces of gold is expected to be generally flat throughout the year, reflecting the leaching of Çakmaktepe ore stacked during the fourth quarter of 2022 and the start of production from Çakmaktepe Extension in 2023.
The 2023 sustaining capex budget at Ҫӧpler of $45 million in 2023 includes $9 million in capital leases for the Air Liquide oxygen plant. Growth capital expenditures are expected to total $40 million and are predominantly associated with the expansion of the heap leach pad to accommodate Çakmaktepe Extension oxide ore going forward, along with other pre-development costs at Çakmaktepe Extension. Capital expenses for the C2 expansion project are not expected to commence until 2024 or 2025, provided the successful advancement of the project through upcoming development milestones including a pre-feasibility study expected in the second half of 2023.
Marigold, USA
In 2022, gold production for Marigold was 194,668 ounces, in line with revised full-year guidance. Gold production was 62,875 ounces in the fourth quarter of 2022, a strong finish that included continued recovery of the higher grade ounces stacked earlier in 2022. Cost of sales in the fourth quarter of 2022 were $1,004/oz and AISC were $1,160/oz.
In 2023, Marigold is expected to produce 260,000 to 290,000 ounces of gold at mine site cost of sales of $1,000 to $1,030 per payable ounce and AISC of $1,315 to $1,365 per ounce. For the full year, production is expected to be 60 to 70% weighted to the second half of 2023, reflecting the aforementioned grade profile and continued slower than expected leach kinetics resulting from the increased proportion of finer ore stacked to the pads in 2022. Marigold’s cost profile is expected to largely reflect the 2023 production profile, with first half costs above the full-year guidance range and the lowest cost periods in the third and fourth quarters.
Reflecting ongoing optimization efforts around the Marigold life of mine plan, waste stripping activity at Red Dot has been accelerated from the prior plan of 2026 and 2027 to instead begin in late 2023 and end in 2025. This re-optimization work is expected to ensure a smoother production profile for the remainder of the decade, with Marigold’s annual production reaching its lowest levels in 2025. These waste stripping costs are included in the mine’s cost of sales and are not recognized as growth capital. In order to facilitate this accelerated waste stripping profile, Marigold is expanding its haul truck fleet in 2023 with $28 million of the overall sustaining capital budget allocated to haul truck purchases to be incurred in the first half of the year. Sustaining capital is expected to decline significantly into 2024 and again in 2025.
Activities to enhance and extend the Marigold life of mine plan are continuing to advance. This includes the aforementioned optimization of the near-term mine sequencing to accelerate access to Red Dot ore, as well as the continued definition of the New Millennium target and its potential contribution to the overall Marigold life of mine plan. If successful, there is potential to demonstrate both mine life extension and an improved near- to medium- term annual production profile for Marigold in future life of mine plan updates.
Seabee, Canada
For 2022, gold production for Seabee was a record 136,125 ounces. In the fourth quarter of 2022, gold production was 24,709 ounces at cost of sales of $909/oz and AISC of $1,234/oz, reflecting lower than expected head grades. Underground mining and mill throughput in the fourth quarter averaged approximately 1,300 tonnes per day, highlighting the ongoing success of continuous improvement initiatives at the mine through 2022.
In 2023, Seabee is expected to produce 100,000 to 110,000 ounces of gold at mine site cost of sales of $810 to $840 per payable ounce and AISC of $1,160 to $1,210 per payable ounce. Seabee’s production is expected to be 55% weighted to the second half of the year, as processed grades are expected to be lowest in the first and second quarters of 2023 before improving in the second half. Mine and mill productivity are expected to average between 1,250 and 1,300 tonnes per day through 2023. A six-day period of scheduled downtime is currently planned for the third quarter of 2023 to account for government upgrades to the regional power grid supplying the mine.
In 2023, no contribution is currently expected from the high grade zone mined in the first quarter of 2022. An exploration drive completed late in the third quarter of 2022 is currently testing the potential continuation of this zone for future mining, but delineation efforts are not sufficiently advanced to be incorporated into the 2023 production plan. Seabee’s exploration and resource development budget has been increased by approximately 40% in 2023 relative to 2022, with a focus on delivering further Mineral Resource conversion success to expand and extend the current life of mine plan.
Sustaining capital expenditures are planned to total $33 million in 2023, including $19 million in capitalized underground development as well mining and surface equipment purchases and upgrades. Capital expenditures are expected to be concentrated in the first half of the year, particularly the first quarter, during the ice road season.
Puna, Argentina
For 2022, silver production from Puna was 8.4 million ounces and within the asset’s original full year guidance range. Silver production was 2.4 million ounces in the fourth quarter of 2022 at cost of sales of $16.53/oz and AISC of $15.97/oz.
In 2023, Puna is expected to produce 8.0 to 9.0 million ounces of silver at mine site cost of sales of $18.00 to $19.50 per payable ounce and AISC of $16.25 to $17.75 per payable ounce. Production is expected to be 50 to 55% weighted to the second half of 2023, driven largely by grades that peak in the third quarter, while tonnes processed are targeted to remain at approximately 4,500 tonnes per day throughout the year. Cost of sales and AISC are expected to be highest in the first half of 2023, including a peak in the second quarter, reflecting the site-level capital spend profile.
Puna is expected to sustain strong silver production of 8.0 to 9.0 million ounces over the three-year period. Silver grades processed over that period are expected to largely reflect the life of mine profile outlined in the 2021 TRS.
Sustaining capital expenditures, excluding sustaining exploration, are planned to total $15 million in 2023 and are expected to primarily relate to maintenance of mine and plant equipment.
Exploration and Resource Development
In 2023, exploration and resource development expenditures, including sustaining exploration, are expected to total $94 million, of which $81 million represents discretionary growth expenditures to advance exploration opportunities across the portfolio. This growth exploration budget is an increase of approximately 50% over 2022 spend, building on the significant success of brownfield exploration programs in 2022.
At Çöpler, 2023 consolidated exploration and resource development expenditures are estimated to total $31 million, with a primary focus on further Çakmaktepe Extension Mineral Resource conversion and expansion, near-mine drilling at the Ҫӧpler Main Pit and Ҫӧpler Saddle, and regional exploration on the Kartaltepe targets including Mavidere. In the fourth quarter of 2022, SSR Mining completed the acquisition of an additional 30% interest in the Kartaltepe licenses, providing the Company with uniform 80% ownership of the entire Ҫӧpler district and streamlining operating and exploration activities across the property.
At Marigold, 2023 consolidated exploration and resource development expenditures are estimated at $26 million, focusing on oxide Mineral Resource additions and conversion at Mackay, Valmy, New Millennium, Trenton Canyon and Buffalo Valley. Growth exploration expenditures also include geophysics and testing of new oxide and sulfide targets at Trenton Canyon and Buffalo Valley.
At Seabee, 2023 consolidated exploration and resource development expenditures are estimated at $21 million with a focus on building additional Mineral Reserve inventory adjacent to existing infrastructure at Santoy. Further drilling will also be completed at the Porky and Shane targets to advance the understanding of each target’s potential to contribute to Seabee’s longer-term production profile. Earlier stage exploration activity also continues across the Fisher property, including follow-up drill testing at a number of regional targets.
At Puna, 2023 consolidated exploration and resource development expenditures are anticipated to total $8 million, a significant increase over 2022 reflecting the positive near-mine exploration results received to-date.
Other exploration and development expenditures total $9 million as SSR Mining advances greenfield opportunities across its portfolio, including earlier stage and regional opportunities in the U.S., Türkiye, Canada, Argentina and Peru.
Assumptions
All figures are in U.S. dollars, unless otherwise noted. Gold equivalent figures for operating guidance are based on a gold-to-silver ratio of 83:1 in 2023, 77:1 in 2024 and 76:1 in 2025. Gold equivalent figures for 2022 are based on a gold-silver ratio of 83:1. Cost of sales, cash costs, AISC and capital expenditure guidance is based on an oil price of $90 per barrel, an exchange rate of 1.28 Canadian dollars to one U.S. dollar and an exchange rate of 23 Turkish Lira to one U.S. dollar and are subject to the key assumptions, risks and uncertainties described under “Cautionary Note Regarding Forward-Looking Information and Statements”. All figures are presented on a 100% basis, unless otherwise noted with respect to Çöpler, which is 80% owned by SSR Mining.
About SSR Mining
SSR Mining Inc. is a leading, free cash flow focused gold company with four producing operations located in the USA, Türkiye, Canada, and Argentina, combined with a global pipeline of high-quality development and exploration assets. Over the last three years, the four operating assets combined have produced on average more than 700,000 gold-equivalent ounces annually. SSR Mining is listed under the ticker symbol SSRM on the NASDAQ and the TSX, and SSR on the ASX.
Cautionary Note Regarding Forward-Looking Information and Statements:
Except for statements of historical fact relating to us, certain statements contained in this news release constitute forward-looking information, future oriented financial information, or financial outlooks (collectively “forward-looking information”) within the meaning of applicable securities laws. Forward-looking information may be contained in this document and our other public filings. Forward-looking information relates to statements concerning our outlook and anticipated events or results and in some cases, can be identified by terminology such as “may”, “will”, “could”, “should”, “expect”, “plan”, “anticipate”, “believe”, “intend”, “estimate”, “projects”, “predict”, “potential”, “continue” or other similar expressions concerning matters that are not historical facts.
Forward-looking information and statements in this news release are based on certain key expectations and assumptions made by us. Although we believe that the expectations and assumptions on which such forward-looking information and statements are based are reasonable, undue reliance should not be placed on the forward-looking information and statements because we can give no assurance that they will prove to be correct. Forward-looking information and statements are subject to various risks and uncertainties which could cause actual results and experience to differ materially from the anticipated results or expectations expressed in this news release. The key risks and uncertainties include, but are not limited to: local and global political and economic conditions; governmental and regulatory requirements and actions by governmental authorities, including changes in government policy, government ownership requirements, changes in environmental, tax and other laws or regulations and the interpretation thereof; developments with respect to the COVID-19 pandemic, including the duration, severity and scope of the pandemic and potential impacts on mining operations; and other risk factors detailed from time to time in our reports filed with the Securities and Exchange Commission on EDGAR and the Canadian securities regulatory authorities on SEDAR.
Forward-looking information and statements in this news release include any statements concerning, among other things: preliminary cost reporting in this document; production, operating, cost, and capital expenditure guidance; our operational and development targets and catalysts; the results of any gold reconciliations; the ability to discover additional oxide gold ore; the generation of free cash flow and payment of dividends; matters relating to proposed exploration; communications with local stakeholders; maintaining community and government relations; negotiations of joint ventures; negotiation and completion of transactions; commodity prices; Mineral Resources, Mineral Reserves, conversion of Mineral Resources, realization of Mineral Reserves, and the existence or realization of Mineral Resource estimates; the development approach; the timing and amount of future production; the timing of studies, announcements, and analysis; the timing of construction and development of proposed mines and process facilities; capital and operating expenditures; economic conditions; availability of sufficient financing; exploration plans; receipt of regulatory approvals; expectations regarding COVID-19, its ongoing impact on us and any interruptions it may cause on our operations; and any and all other timing, exploration, development, operational, financial, budgetary, economic, legal, social, environmental, regulatory, and political matters that may influence or be influenced by future events or conditions.
Such forward-looking information and statements are based on a number of material factors and assumptions, including, but not limited in any manner to, those disclosed in any other of our filings on EDGAR and SEDAR, and include: the inherent speculative nature of exploration results; the ability to explore; communications with local stakeholders; maintaining community and governmental relations; status of negotiations of joint ventures; weather conditions at our operations; commodity prices; the ultimate determination of and realization of Mineral Reserves; existence or realization of Mineral Resources; the development approach; availability and receipt of required approvals, titles, licenses and permits; sufficient working capital to develop and operate the mines and implement development plans; access to adequate services and supplies; foreign currency exchange rates; interest rates; access to capital markets and associated cost of funds; availability of a qualified work force; ability to negotiate, finalize, and execute relevant agreements; lack of social opposition to our mines or facilities; lack of legal challenges with respect to our properties; the timing and amount of future production; the ability to meet production, cost, and capital expenditure targets; timing and ability to produce studies and analyses; capital and operating expenditures; economic conditions; availability of sufficient financing; the ultimate ability to mine, process, and sell mineral products on economically favorable terms; and any and all other timing, exploration, development, operational, financial, budgetary, economic, legal, social, geopolitical, regulatory and political factors that may influence future events or conditions. While we consider these factors and assumptions to be reasonable based on information currently available to us, they may prove to be incorrect.
The above list is not exhaustive of the factors that may affect any of the Company’s forward-looking information. You should not place undue reliance on forward-looking information and statements. Forward-looking information and statements are only predictions based on our current expectations and our projections about future events. Actual results may vary from such forward-looking information for a variety of reasons including, but not limited to, risks and uncertainties disclosed in our filings on our website at www.ssrmining.com, on SEDAR at www.sedar.com, on EDGAR at www.sec.gov and on the ASX at www.asx.com.au and other unforeseen events or circumstances. Other than as required by law, we do not intend, and undertake no obligation to update any forward-looking information to reflect, among other things, new information or future events. The information contained on, or that may be accessed through, our website is not incorporated by reference into, and is not a part of, this document.
Cautionary Note to U.S. Investors
This news release includes terms that comply with reporting standards in Canada under National Instrument 43-101 – Standards of Disclosure for Mineral Projects (“NI 43-101”), including the terms “Mineral Reserves” and “Mineral Resources”. NI 43-101 is a rule developed by the Canadian Securities Administrators that establishes standards for all public disclosure an issuer makes of scientific and technical information concerning mineral projects. The standards of NI 43-101 differ significantly from the requirements of the SEC. Accordingly, information concerning mineral deposits set forth herein may not be comparable with information made in accordance with U.S. standards.
Cautionary Note Regarding Non-GAAP Measures
We have included certain non-GAAP performance measures throughout this document. These performance measures are employed by us to measure our operating and economic performance internally and to assist in decision-making, as well as to provide key performance information to senior management. We believe that, in addition to conventional measures prepared in accordance with GAAP, certain investors and other stakeholders also use this information to evaluate our operating and financial performance; however, these non-GAAP performance measures do not have any standardized meaning. Accordingly, these performance measures are intended to provide additional information and should not be considered in isolation or as a substitute for measures of performance prepared in accordance with GAAP. Our definitions of our non-GAAP financial measures may not be comparable to similarly titled measures reported by other companies. These non-GAAP measures should be read in conjunction with our condensed consolidated interim financial statements.
Cash costs, AISC per ounce sold, and free cash flow are Non-GAAP Measures with no standardized definition under U.S GAAP.
The Company uses cash costs per ounce of precious metals sold, a non-GAAP financial measure, to monitor its operating performance internally, including operating cash costs, and for internal decision making. The Company believes this measure provides investors and analysts with useful information about its underlying cash costs of operations and the impact of by-product credits on its cost structure. The Company also believes it is a relevant metric used to understand its operating profitability and ability to generate cash flow. When deriving the cost of sales associated with an ounce of precious metal, the Company includes the by-product credits as it considers the cost to produce the gold or silver is reduced as a result of the by-product sales incidental to the gold and silver production process, thereby allowing management and other stakeholders to assess the net costs of gold and silver production. In calculating cash costs per ounce, the Company also excludes the impact of specific items that are significant, but not reflective of its underlying operations, including the impact of measuring inventories at fair value in connection with business combinations. When deriving the number of ounces of precious metal sold, the Company considers the physical ounces available for sale after the treatment and refining process, commonly referred to as payable metal, as this is what is sold to third parties. Cash costs per ounce metrics, net of by-product credits, are also used in the Company's internal decision making processes.
AISC includes total cost of sales incurred at the Company's mining operations, which forms the basis of its by-product cash costs. Additionally, the Company includes sustaining capital expenditures, sustaining mine-site exploration and evaluation costs, reclamation cost accretion and amortization and general and administrative expenses. This measure seeks to reflect the ongoing cost of gold and silver production from current operations; therefore, expansionary capital and non-sustaining expenditures are excluded. Certain other cash expenditures, including tax payments and financing costs are also excluded. The Company believes that this measure represents the total costs of producing gold and silver from current operations and provides the Company and other stakeholders with additional information about its operating performance and ability to generate cash flows. It allows the Company to assess its ability to support capital expenditures and to sustain future production from the generation of operating cash flows.
The following tables provide a reconciliation of cost of sales to cash costs and AISC:
|
|
Three Months Ended December 31, 2022 |
||||||||||||||||
(in thousands, unless otherwise noted) |
|
Çöpler |
|
Marigold |
|
Seabee |
|
Puna |
|
Corporate |
|
Total |
||||||
Cost of sales (GAAP) |
|
$ |
63,839 |
|
$ |
63,173 |
|
$ |
21,360 |
|
$ |
34,669 |
|
$ |
— |
|
$ |
183,041 |
By-product credits |
|
$ |
(726) |
|
$ |
(30) |
|
$ |
(14) |
|
$ |
(11,107) |
|
$ |
— |
|
$ |
(11,877) |
Treatment and refining charges |
|
$ |
— |
|
$ |
393 |
|
$ |
53 |
|
$ |
3,723 |
|
$ |
— |
|
$ |
4,169 |
Cash costs (non-GAAP) |
|
$ |
63,113 |
|
$ |
63,536 |
|
$ |
21,399 |
|
$ |
27,286 |
|
$ |
— |
|
$ |
175,334 |
Sustaining capital expenditures |
|
$ |
10,411 |
|
$ |
8,083 |
|
$ |
6,664 |
|
$ |
2,361 |
|
$ |
— |
|
$ |
27,519 |
Sustaining exploration and evaluation expense |
|
$ |
764 |
|
$ |
800 |
|
$ |
— |
|
$ |
3,388 |
|
$ |
— |
|
$ |
4,951 |
Reclamation cost accretion and amortization |
|
$ |
643 |
|
$ |
585 |
|
$ |
930 |
|
$ |
432 |
|
$ |
— |
|
$ |
2,590 |
General and administrative expense and stock-based compensation expense |
|
$ |
1,125 |
|
$ |
— |
|
$ |
— |
|
$ |
33 |
|
$ |
22,081 |
|
$ |
23,239 |
Total AISC (non-GAAP) |
|
$ |
76,055 |
|
$ |
73,004 |
|
$ |
28,993 |
|
$ |
33,499 |
|
$ |
22,081 |
|
$ |
233,632 |
|
|
|
|
|
|
|
|
|
|
|
|
|
|
|
|
|
|
|
Gold sold (oz) |
|
|
59,949 |
|
|
62,936 |
|
|
23,500 |
|
|
— |
|
|
— |
|
|
146,385 |
Silver sold (oz) |
|
|
— |
|
|
— |
|
|
— |
|
|
2,097,482 |
|
|
— |
|
|
2,097,482 |
Gold equivalent sold (oz) (11,12) |
|
|
59,949 |
|
|
62,936 |
|
|
23,500 |
|
|
25,657 |
|
|
— |
|
|
172,042 |
|
|
|
|
|
|
|
|
|
|
|
|
|
|
|
|
|
|
|
Cost of sales per gold ounce sold |
|
$ |
1,065 |
|
$ |
1,004 |
|
$ |
909 |
|
$ |
N/A |
|
$ |
N/A |
|
$ |
N/A |
Cost of sales per silver ounce sold |
|
$ |
N/A |
|
$ |
N/A |
|
$ |
N/A |
|
$ |
16.53 |
|
$ |
N/A |
|
$ |
N/A |
Cost of sales per gold equivalent ounce sold |
|
$ |
1,065 |
|
$ |
1,004 |
|
$ |
909 |
|
$ |
1,351 |
|
$ |
N/A |
|
$ |
1,064 |
Cash cost per gold ounce sold |
|
$ |
1,053 |
|
$ |
1,010 |
|
$ |
911 |
|
$ |
N/A |
|
$ |
N/A |
|
$ |
N/A |
Cash cost per silver ounce sold |
|
$ |
N/A |
|
$ |
N/A |
|
$ |
N/A |
|
$ |
13.01 |
|
$ |
N/A |
|
$ |
N/A |
Cash cost per gold equivalent ounce sold |
|
$ |
1,053 |
|
$ |
1,010 |
|
$ |
911 |
|
$ |
1,063 |
|
$ |
N/A |
|
$ |
1,019 |
AISC per gold ounce sold |
|
$ |
1,269 |
|
$ |
1,160 |
|
$ |
1,234 |
|
$ |
N/A |
|
$ |
N/A |
|
$ |
N/A |
AISC per silver ounce sold |
|
$ |
N/A |
|
$ |
N/A |
|
$ |
N/A |
|
$ |
15.97 |
|
$ |
N/A |
|
$ |
N/A |
AISC per gold equivalent ounce sold |
|
$ |
1,269 |
|
$ |
1,160 |
|
$ |
1,234 |
|
$ |
1,306 |
|
$ |
N/A |
|
$ |
1,358 |
|
|
Twelve Months Ended December 31, 2022 |
||||||||||||||||
(in thousands, unless otherwise noted) |
|
Çöpler |
|
Marigold |
|
Seabee |
|
Puna |
|
Corporate |
|
Total |
||||||
Cost of sales (GAAP) |
|
$ |
189,825 |
|
$ |
206,014 |
|
$ |
74,679 |
|
$ |
137,424 |
|
$ |
— |
|
$ |
607,942 |
By-product credits |
|
$ |
(2,928) |
|
$ |
(125) |
|
$ |
(111) |
|
$ |
(48,124) |
|
$ |
— |
|
$ |
(51,288) |
Treatment and refining charges |
|
$ |
— |
|
$ |
693 |
|
$ |
316 |
|
$ |
14,753 |
|
$ |
— |
|
$ |
15,762 |
Cash costs (non-GAAP) |
|
$ |
186,897 |
|
$ |
206,582 |
|
$ |
74,884 |
|
$ |
104,053 |
|
$ |
— |
|
$ |
572,416 |
Sustaining capital expenditures |
|
$ |
31,189 |
|
$ |
53,514 |
|
$ |
32,980 |
|
$ |
10,446 |
|
$ |
— |
|
$ |
128,129 |
Sustaining exploration and evaluation expense |
|
$ |
2,875 |
|
$ |
7,377 |
|
$ |
— |
|
$ |
5,372 |
|
$ |
— |
|
$ |
15,624 |
Care and maintenance (13) |
|
$ |
31,067 |
|
$ |
— |
|
$ |
— |
|
$ |
— |
|
$ |
— |
|
$ |
31,067 |
Reclamation cost accretion and amortization |
|
$ |
1,320 |
|
$ |
2,181 |
|
$ |
1,983 |
|
$ |
1,726 |
|
$ |
— |
|
$ |
7,210 |
General and administrative expense and stock-based compensation expense |
|
$ |
2,794 |
|
$ |
1 |
|
$ |
11 |
|
$ |
266 |
|
$ |
68,588 |
|
$ |
71,660 |
Total AISC (non-GAAP) |
|
$ |
256,142 |
|
$ |
269,655 |
|
$ |
109,858 |
|
$ |
121,863 |
|
$ |
68,588 |
|
$ |
826,106 |
|
|
|
|
|
|
|
|
|
|
|
|
|
|
|
|
|
|
|
Gold sold (oz) |
|
|
192,811 |
|
|
195,617 |
|
|
133,500 |
|
|
— |
|
|
— |
|
|
521,928 |
Silver sold (oz) |
|
|
— |
|
|
— |
|
|
— |
|
|
7,863,646 |
|
|
— |
|
|
7,863,646 |
Gold equivalent sold (oz) (11,12) |
|
|
192,811 |
|
|
195,617 |
|
|
133,500 |
|
|
95,207 |
|
|
— |
|
|
617,135 |
|
|
|
|
|
|
|
|
|
|
|
|
|
|
|
|
|
|
|
Cost of sales per gold ounce sold |
|
$ |
985 |
|
$ |
1,053 |
|
$ |
559 |
|
$ |
N/A |
|
$ |
N/A |
|
$ |
N/A |
Cost of sales per silver ounce sold |
|
$ |
N/A |
|
$ |
N/A |
|
$ |
N/A |
|
$ |
17.48 |
|
$ |
N/A |
|
$ |
N/A |
Cost of sales per gold equivalent ounce sold |
|
$ |
985 |
|
$ |
1,053 |
|
$ |
559 |
|
$ |
1,443 |
|
$ |
N/A |
|
$ |
985 |
Cash cost per gold ounce sold |
|
$ |
969 |
|
$ |
1,056 |
|
$ |
561 |
|
$ |
N/A |
|
$ |
N/A |
|
$ |
N/A |
Cash cost per silver ounce sold |
|
$ |
N/A |
|
$ |
N/A |
|
$ |
N/A |
|
$ |
13.23 |
|
$ |
N/A |
|
$ |
N/A |
Cash cost per gold equivalent ounce sold |
|
$ |
969 |
|
$ |
1,056 |
|
$ |
561 |
|
$ |
1,093 |
|
$ |
N/A |
|
$ |
928 |
AISC per gold ounce sold |
|
$ |
1,328 |
|
$ |
1,378 |
|
$ |
823 |
|
$ |
N/A |
|
$ |
N/A |
|
$ |
N/A |
AISC per silver ounce sold |
|
$ |
N/A |
|
$ |
N/A |
|
$ |
N/A |
|
$ |
15.50 |
|
$ |
N/A |
|
$ |
N/A |
AISC per gold equivalent ounce sold |
|
$ |
1,328 |
|
$ |
1,378 |
|
$ |
823 |
|
$ |
1,280 |
|
$ |
N/A |
|
$ |
1,339 |
(11) |
Gold equivalent ounces are calculated using the silver ounces produced or sold multiplied by the ratio of the silver price to the gold price, using the average LBMA prices for the period. The Company does not include copper, lead, or zinc as they are considered by-products |
|
(12) |
Gold equivalent ounces sold may not re-calculate based on amounts presented in this table due to rounding. |
|
(13) |
Care and maintenance expense in the AISC calculation only includes direct costs, as depreciation is not included in the calculation of AISC. |
The following tables provide a reconciliation of cost of sales to cash costs and AISC used in the calculation of 2023 cost guidance:
(operating guidance 100% basis) (14) |
|
Çöpler |
|
Marigold |
|
Seabee |
|
Puna |
|
Corporate |
|
Total |
|
Gold Production |
koz |
|
240 — 270 |
|
260 — 290 |
|
100 — 110 |
|
— |
|
— |
|
600 — 670 |
Silver Production |
Moz |
|
— |
|
— |
|
— |
|
8.0 — 9.0 |
|
— |
|
8.0 — 9.0 |
Gold Equivalent Production |
koz |
|
240 — 270 |
|
260 — 290 |
|
100 — 110 |
|
100 — 110 |
|
— |
|
700 — 780 |
Gold Sold |
koz |
|
240 — 270 |
|
260 — 290 |
|
100 — 110 |
|
— |
|
— |
|
600 — 670 |
Silver Sold |
Moz |
|
— |
|
— |
|
— |
|
8.0 — 9.0 |
|
— |
|
8.0 — 9.0 |
Gold Equivalent Sold |
koz |
|
240 — 270 |
|
260 — 290 |
|
100 — 110 |
|
100 — 110 |
|
— |
|
700 — 780 |
|
|
|
|
|
|
|
|
|
|
|
|
|
|
Cost of Sales (GAAP) |
$M |
|
265 — 290 |
|
270 — 290 |
|
78 — 88 |
|
150 — 160 |
|
— |
|
763 — 828 |
By-Product Credits + Treatment & Refining Costs |
$M |
|
(2) |
|
— |
|
— |
|
(32) |
|
— |
|
(34) |
Cash Cost (non-GAAP) |
$M |
|
263 — 288 |
|
270 — 290 |
|
78 — 88 |
|
118 — 128 |
|
— |
|
729 — 794 |
Sustaining Capital Expenditures (15) |
$M |
|
45 |
|
81 |
|
33 |
|
15 |
|
— |
|
174 |
Sustaining Exploration Expenditures |
$M |
|
4 |
|
6 |
|
— |
|
3 |
|
— |
|
13 |
Reclamation Cost Accretion & Amortization |
$M |
|
2 |
|
2 |
|
4 |
|
2 |
|
— |
|
10 |
General & Administrative |
$M |
|
— |
|
— |
|
— |
|
— |
|
68 — 73 |
|
68 — 73 |
All-In Sustaining Cost (non-GAAP) |
$M |
|
314 — 339 |
|
359 — 379 |
|
115 — 125 |
|
138 — 148 |
|
68 — 73 |
|
994 — 1,064 |
|
|
|
|
|
|
|
|
|
|
|
|
|
|
Cost of Sales per Ounce (GAAP) (16) |
$/oz |
|
1,070 — 1,100 |
|
1,000 — 1,030 |
|
810 — 840 |
|
18.00 — 19.50 |
|
— |
|
1,055 — 1,115 |
Cash Cost per Ounce (non-GAAP) (16) |
$/oz |
|
1,060 — 1,090 |
|
1,000 — 1,030 |
|
810 — 840 |
|
14.00 — 15.50 |
|
— |
|
1,015 — 1,075 |
All-In Sustaining Cost per Ounce (non-GAAP) (16) |
$/oz |
|
1,245 — 1,295 |
|
1,315 — 1,365 |
|
1,160 — 1,210 |
|
16.25 — 17.75 |
|
— |
|
1,365 — 1,425 |
(14) |
Figures may not add due to rounding. Figures are reported on a 100% basis. Çöpler is 80% owned by SSR Mining. |
|
(15) |
Excludes sustaining exploration and evaluation expenditures. Includes approximately $9.0 million in lease payments at Çöpler. Includes $19 million in underground mine development at Seabee. |
|
(16) |
Çöpler, Marigold and Seabee costs per ounce based on gold ounces sold; Puna costs per ounce based on silver ounces sold. Gold equivalent ounces sold are used in the calculation for total costs per ounce. |
View source version on businesswire.com: https://www.businesswire.com/news/home/20230209005581/en/