AbraSilver Announces Robust Diablillos PFS With US$494M After-Tax NPV and 26% IRR
(TheNewswire)
 | |||||||||
 |  | ||||||||
Toronto – TheNewswire - March 25, 2024: AbraSilver Resource Corp. (TSX.V:ABRA; OTCQX: ABBRF) ("AbraSilver" or the “Company”) is pleased to announce results from its Preliminary Feasibility Study (“PFS” or the “Study”) for its wholly-owned Diablillos project (the “Project”) in Salta Province, Argentina. The PFS project team was comprised of SGS Geological Services (“SGS”), with support from Knight Piesold Ltd., SGS Bateman, Bmining (Chile), and INSA (Argentina).
All dollar ($) figures are presented in US dollars unless otherwise stated. Base case metal prices used in this analysis are $1,850 per gold (“Au”) ounce (“oz”) and $23.50 per silver (“Ag”) oz.
PFS Study Highlights:
-
Attractive project economics – 494 million after-tax Net Present Value discounted at 5% per annum (“NPV5%”),at base-case metal prices, with an after-tax Internal Rate of Return (“IRR”) of 25.6% and payback of 2.4 years.At current spot prices1 an after-tax NPV5% of $661 million with an IRR of 30.3% and payback of 2.1 years
-
Substantial silver and gold production – 13.3 Moz silver-equivalent (“AgEq”) average annual production over a 13-year life-of-mine (“LOM”), comprised of 7.7 Moz Ag and 71 koz Au, or, with average annual production of 17.9 Moz AgEq over the first five years of full mine production, comprised of 14.5 Moz Ag and 44 koz Au
-
Low All-in Sustaining Cash Costs (“AISC”)– Average AISC of $12.40/oz AgEq over LOM
-
Low capital cost – Initial pre-production capital expenditure of $373 million and sustaining capital of $65 million
-
Open pit mine with high grades – Conventional open pit mining and processing plant focused exclusively on oxide mineralization with average grades of 91 g/t Ag and 0.81 g/t Au (155 AgEq) over the LOM
-
Maiden Proven Probable (“P”) Mineral Reserves Based on the PFS, Diablillos is estimated to hold PP Minerals Reserves containing 210 Moz of AgEq metal (42.3 Mt at 91 g/t Ag 0.81 g/t Au)
-
Potential for additional economic improvements – Several opportunities have been identified that may significantly enhance the economic returns as detailed later in this release:
-
A preliminary internal study estimates that a significant amount of mineralized material below cut-off grade, which is treated as waste in the PFS, could be amenable to heap leaching or other low-cost processing technologies, with further study work expected to be completed by mid-2024.
-
A Phase IV drill campaign is planned to further expand the Mineral Resource and Reserve estimates within the existing deposits and to define new adjacent mineralized zones through step-out drilling.
-
John Miniotis, President and CEO, commented, “We are delighted to share the positive outcomes of the PFS which demonstrates that Diablillos is economically robust and reaffirms our confidence in the Project’s significant upside potential. Unlike many other silver projects, the PFS highlights that Diablillos is a true primary silver project, with a substantial amount of gold and no base metals. The PFS indicates that Diablillos may produce an annual average of 17.9 Moz of silver-equivalent in the first five years, which would make it one of the top ten primary silver mines in the world2. In addition, we are very excited to have identified several opportunities to further enhance and optimize the PFS economics, which we will be evaluating as we advance towards a Feasibility Study. This PFS is a great starting position from which we plan to continue to unlock value for all stakeholders.”
Project Economics
Table 1 – Commodity Price Sensitivity Analysis
|
Economic Parameters |
Base Case Prices |
Spot Prices1 |
Base Case Prices +15% |
Base Case Price -15% |
2021 PEA Price Deck |
|
Silver Price ($/oz) |
$23.50 |
$24.76 |
$27.03 |
$19.98 |
$24.00 |
|
Gold Price ($/oz) |
$1,850 |
$2,181 |
$2,128 |
$1,573 |
$1,650 |
|
After-tax NPV (5%, US$ million) |
$493.7 |
$661.5 |
$741.9 |
$245.6 |
$447.3 |
|
After-tax NPV (8%, US$ million) |
$363.4 |
$498.5 |
$567.7 |
$159.0 |
$328.2 |
|
After-Tax IRR (%) |
25.6% |
30.3% |
33.3% |
16.7% |
24.6% |
|
Payback (years) |
2.4 |
2.1 |
2.1 |
3.2 |
2.4 |
1Note: Spot Price as at close on March 21, 2024, per Reuters.com
The PFS presents a range of metal pricing scenarios on an after-tax basis to evaluate the economics of both upside and downside price scenarios. The economics of the Diablillos project are very robust and offer significant leverage to both silver and gold prices, with an after-tax NPV5% of $742 Million (+50%) if prices rise 15% from the Base Case (Table 1).
Production Summary
The Diablillos project is envisioned as a conventional open pit operation over a mine life of approximately 13.5 years of production with mill throughput of 9,000 tonnes per day. Total material moved (excluding stockpile rehandle and commissioning) is 313.5 Mt (42.3 Mt mineralization and 271.2 Mt waste) at a strip ratio of 6.4 (excluding pre-stripping).
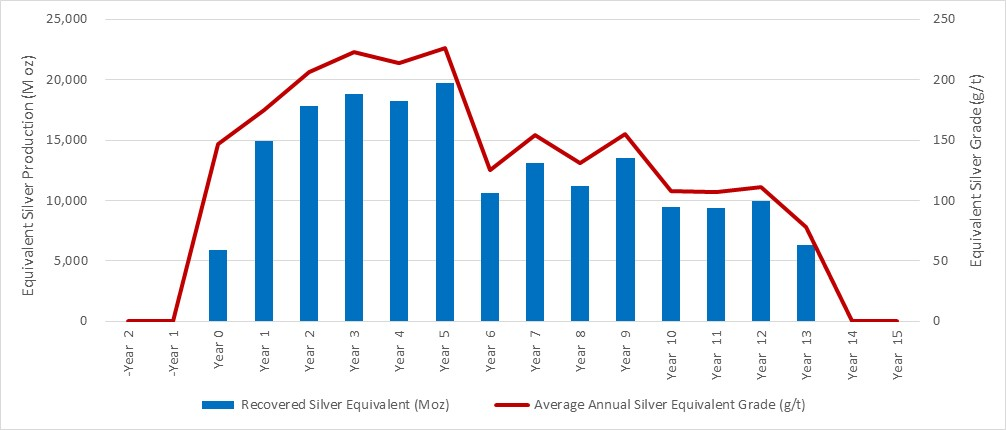
The proposed operation consists of a common open pit that will extract both the Oculto and JAC deposits, the mineralization of which are connected by a narrow node. The JAC deposit contains higher silver grade ore that occurs near-surface and, consequently, will be mined and processed in the earlier years of the mine plan. Additionally, the overburden at JAC provides suitable construction material for the project infrastructure and tailings storage facility (“TSF”). As a result, the highest-grade feed material is expected in the first five years of full mine production, with average grades 168 g/t silver and 0.51 g/t gold, resulting in average annual production of 14.5Moz silver and 44koz gold during that period (Table 2 and Figure 1).
Table 2 – Grade and Production Profile
|
Units |
Avg. Year 1 - 5 |
Avg. LOM (Year 1 – 13) |
|
|
Silver Grades |
(g/t) |
168 |
91 |
|
Gold Grades |
(g/t) |
0.51 |
0.81 |
|
Silver-Equivalent Grades |
(g/t) |
209 |
155 |
|
Silver Production |
(M oz) |
14.5 |
7.7 |
|
Gold Production |
(k oz) |
44.0 |
71.0 |
|
AgEq Production |
(M oz) |
17.9 |
13.3 |
Note: AgEq is calculated using base case prices for silver and gold (Au/Ag price ratio of 78.72)
Figure 1 – Annual Silver Equivalent Production and Grade Profile
Click Image To View Full Size
Processing and Metallurgy
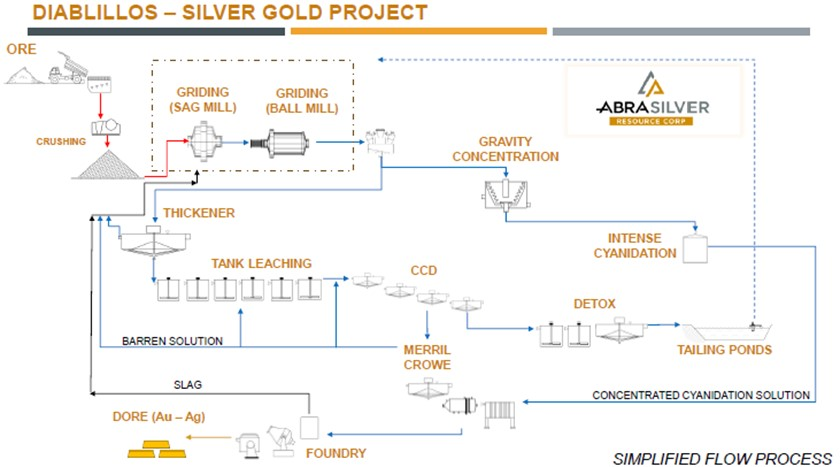
The process facility has been designed for a nameplate capacity of 9,000 tonnes of mineralization per day (“tpd”), or 3.15 million tonnes per annum (“tpa”) considering 350 days a year of operation. A conventional silver/gold processing plant flowsheet was developed that incorporates crushing, grinding, gravity concentration, an intense cyanidation circuit, cyanide leaching with oxygen addition, counter current decantation washing thickeners and Merrill-Crowe precious metal recovery from solution followed by on-site smelting to doré bars. The leached solids are detoxified, thickened, and pumped to a TSF for permanent disposal.
Metallurgical test work has been carried out in a range of different laboratories between 1996 and 2023 and all the results have been considered as part of the PFS. A geo-metallurgical model has been developed segregating the deposit into five distinct domains, with overall LOM silver and gold recoveries averaging 82.8% and 86.6%, respectively. A schematic showing the proposed flowsheet is provided in Figure 2.
Tailings from the process plant will be stored in a multi-phase, fully lined, cross valley TSF. The facility will be raised using the downstream method with the initial starter impoundment, constructed from borrow material and open pit pre-strip waste, providing storage for the first three years of production.
Figure 2 - Process Flowsheet
Click Image To View Full Size
Operating Costs
The operating cost estimates are based on an owner-operated truck and shovel mining operation, conventional processing plant, and TSF.
The PFS operating cost estimates are shown on a per tonne mined and milled basis in Table 3. The PFS estimates that All-In Sustaining Costs ("AISC") average $9.97/oz AgEq in Year 1 – Year 5, and $12.40/oz AgEq over the LOM. This AISC is believed to be at the low end of the primary silver production cost curve3.
Table 3 – Mine Operating Cost Estimates
|
Operating Costs |
Basis |
Avg. LOM ($) |
|
Ore Mining |
per tonne mined |
1.94 |
|
Waste Mining |
per tonne mined |
1.94 |
|
Waste Mining (Overburden) |
per tonne mined |
1.73 |
|
Total Mining |
per tonne milled |
13.66 |
|
Processing Plant, Utilities and Maintenance |
per tonne milled |
19.26 |
|
Camp and Service Hub |
per tonne milled |
3.70 |
|
G&A |
per tonne milled |
3.32 |
|
Total Operating Cost |
per tonne milled |
39.94 |
Project Capital Costs
The initial pre-production capital expenditures for the project are summarized in Table 4. Capital expenditures to be incurred after the start-up of operations are assigned to sustaining capital and are projected to be covered by operating cash flows. Initial capital costs are estimated at $373.5 million and total sustaining capital costs are estimated at $65.0 million. Particular attention was given to the capital cost estimate during the PFS with approximately 80% of the costs based on quoted prices and this has resulted in a lower estimated contingency cost of $20.3 million. Over 60% of equipment, supplies, construction, and service procurement packages will come from local companies, complying with local regulations.
Table 4 – Summary of Capital Cost Estimates
|
Description |
2021 PEA Study |
2024 PFS |
Change |
|
|
2024 PFS vs. 2021 PEA |
||||
|
$ millions |
$ millions |
% Change |
$ Change |
|
|
Surface Mining |
51.6 |
39.3 |
-24.0% |
-12.4 |
|
Processing |
76.9 |
96.9 |
26.1% |
20.0 |
|
Site Infrastructure |
53.7 |
152.0 |
183.2% |
98.3 |
|
Owner and Indirect Costs |
46.3 |
64.9 |
40.3% |
18.7 |
|
Contingency & Other Provisions |
26.5 |
20.3 |
-23.3% |
-6.2 |
|
Initial Capital Costs |
255.0 |
373.5 |
46.5% |
118.5 |
|
Sustaining Capital |
15.2 |
65.0 |
328.0% |
49.8 |
|
Closure |
8.2 |
11.1 |
35.5% |
2.9 |
|
Total Capital Costs |
278.4 |
449.6 |
61.5% |
171.2 |
Taxes and Royalties
Taxes and royalties in the PFS are based on current Argentinean legislated tax rates and were reviewed by an independent tax consultant. The current rates are:
-
Argentina corporate income tax: 35%
-
Municipal taxes: 0.6%
-
Provincial mining royalty: 3%
-
Gold/Silver export duties: 8% / 4.5%
In total, these taxes, royalties and export duties total $1,087 million in the PFS. The Company believes that the current government of Argentina may implement changes to corporate income taxes and export duties that would have a favourable impact on the PFS economics, although there is no guarantee that such changes will be successfully implemented and approved.
An additional 1% NSR royalty is payable to EMX Royalty Corporation.
Community Relations & Permitting
The Company continues to be very actively involved in community relations and maintains very positive relations with all nearby communities. The Project is expected to have a positive impact with the creation of new employment opportunities and investment in the region. The PFS estimates that over 65% of the total capital costs will be purchased domestically, and that the majority of local contractors will be hired regionally from Salta, Catamarca and nearby provinces.
Regarding permitting, the Company has submitted a comprehensive Environmental Baseline Study which is an important milestone towards the ongoing advancement of Diablillos as a sustainable mining project. The Company is now working on finalizing the Environmental Impact Assessment (“EIA”), which is an essential part of the final approval process required for the ultimate construction of the project, and the EIA application is expected to be submitted later this year.
Summary of Economic Results
Table 5 summarizes the key economic results and parameters of the PFS.
Table 5 – Summary of Project Economics
|
Metrics |
Units |
Results |
|
Life of mine |
years |
13 |
|
Total mineralized material mined (Includes Yr. 0) |
M tonnes |
42.3 |
|
Total contained silver (Includes Yr. 0) |
M oz |
123.5 |
|
Total contained gold (Includes Yr. 0) |
k oz |
1,107.5 |
|
Strip ratio (excludes pre-stripping) |
Waste:ore |
6.4 |
|
Throughput |
tpd |
9,000 |
|
Head grade – silver (first 5 years / LOM) |
g/t |
168 / 91 |
|
Head grade – gold (first 5 years / LOM) |
g/t |
0.51 / 0.81 |
|
Recoveries – silver (first 5 years / LOM) |
% |
84.4 / 82.8 |
|
Recoveries – gold (first 5 years / LOM) |
% |
85.2 / 86.6 |
|
Average Production – silver (first 5 years / LOM) |
M oz |
14.5 / 7.7 |
|
Average Production – gold (first 5 years / LOM) |
k oz |
44.0 / 71.0 |
|
AISC (LOM) – silver equivalent (first 5 years / LOM) |
$/oz AgEq |
9.97 / 12.40 |
|
Initial Capital Costs |
$ M |
373.5 |
|
Sustaining Capital Costs |
$ M |
65.0 |
|
Pre-Tax NPV5% |
$ M |
995.1 |
|
After-Tax NPV5% |
$ M |
493.7 |
The results of this PFS supersede those of the 2021 Preliminary Economic Assessment (the “2021 PEA”) reported in “NI 43-101 Preliminary Economic Assessment Technical Report – Diablillos Project” filed on SEDAR+ by AbraSilver on January 13, 2022. The results reflect several positive changes to the planned development of the Diablillos Project compared with the 2021 PEA. The changes incorporated include:
-
Maiden Mineral Reserve Estimate: A maiden Proven and Probable Mineral Reserve estimate has been declared at Diablillos containing 123.4 Moz Ag and 1.1 Moz Au (42.3 Mt with average grades of 91 g/t Ag and 0.81 g/t Au). The conversion rate of MI Mineral Resources to PP Mineral Reserves is 79% on a tonnage basis and 83% on a contained metal basis.
-
Inclusion of JAC Deposit: The discovery and inclusion of the JAC deposit into the mine plan has contributed to higher silver grades and an overall increase in the Mineral Resource and Reserve estimates. Importantly the high-grade JAC deposit will be mined and processed throughout years 2 – 5, resulting in elevated cash flow levels in the early years of the mine plan.
-
Higher Throughput: The processing plant throughput rate has been expanded by 29% to 9,000 tpd versus 7,000 tpd in the 2021 PEA. This has helped contribute to higher annual silver and gold production rates, with a peak annual production rate of 19.7 Moz AgEq in Year 5 of the PFS.
-
Higher Recovery Rates: The PFS process plant includes the addition of a gravity separation circuit before cyanide leaching, which contributes to higher recovery rates for both silver and gold. Overall, silver and gold recovery rates now average 82.8% and 86.6%, respectively, compared to 73.4% for silver and 86.0% for gold in the 2021 PEA.
-
Power Generation and Site Infrastructure: The PFS incorporates plans to power the Project by using on-site diesel-fueled generators and installing a 20-megawatt solar array on-site to provide a clean source of renewable energy. The 2021 PEA assumed that power would be secured from a regional natural gas pipeline. This still represents a possibility going forward but to date the Company has not secured any assurances on the availability of natural gas from this pipeline.
-
Increased Estimated Accuracy on Capital and Operating Costs: The PFS costing accuracy has improved to +25% /-10% (from +50%/-20% in the 2021 PEA). Additionally, approximately 80% of the cost estimates have been based on third-party contractor and equipment manufacturer quotations, providing an increased level of accuracy.
-
Updated Capital CostsTotal initial capital expenditures increased by $118 million. Beyond general cost inflation, the primary drivers behind this increase were:
-
Mining – Colluvial pre-strip material and higher throughput capacity commanded a larger mine fleet. The 2021 PEA assumed that mining was performed by contractors while the PFS assumes an owner-operated mining operation. Pre-stripping costs were significantly lower in the PFS due to near-surface mineralization identified by the Company since the 2021 PEA.
-
Processing Plant – The throughput rate of the processing plant was increased to 9,000 tpd from 7,000 tpd, as outlined above, and a gravity separation circuit and a covered crushed ore stockpile dome were added.
-
TSF – The design has been updated to store new increased capacities, through a five phases dam expansion, with a water recovery system and seeping control facilities.
-
Power Generation and Site Infrastructure – As outlined above, the PFS incorporates plans to power the project by using an on-site hybrid power generation scheme, composed of diesel-fueled generators and a 20-megawatt photovoltaic plant.
-
Diablillos: Future Opportunities and Value Enhancements
Several potential opportunities have been identified that may further enhance the economic return outlined in the PFS. Significant opportunities include but are not limited to the following:
-
Processing of Material Below Cut-Off Grade: It is anticipated that a significant amount of mineralization below cut-off grade, which is currently being classified as waste, could be processed via other low-cost processing alternatives (e.g. heap leaching). This could result in increased Mineral Resources and Reserves, a reduction in the overall strip ratio at Diablillos and higher metal production. The Company plans to complete a preliminary scoping study in H1/2024 to evaluate the economic potential of incorporating this mineralization into the overall mine plan.
-
Expansion of Mineral Resources and Reserves: A Phase IV exploration campaign is currently being planned to further expand the Mineral Resources and Reserves within the existing deposits and to define new, immediately adjacent mineralized zones through step-out drilling. Multiple exploration targets close to the planned Oculto-JAC open pit warrant additional drilling including: Oculto, JAC, Fantasma, Laderas, JAC North, Alpaca, with numerous other targets within the concession block.
-
Evaluating Sulphide Potential: The PFS is based exclusively on oxidized mineralization with the Oculto pit reaching a maximum depth of approximately 300 metres. Selective deeper drilling has encountered mineralization in sulphides beneath Oculto and JAC down to a depth of approximately 550 metres. An evaluation of the mineralization contained in the underlying sulphides will be carried out, in parallel with a metallurgical test work campaign, to quantify the contained metal in sulphides and the economics of its extraction.
-
Implementation of Proposed Reduction in Corporate Taxes Mining Export Duties: The new Argentine federal government has announced a proposal to reduce corporate income taxes from 35% to 25%, as well as eliminating export duties, and other measures which could introduce other financial benefits to encourage large investments in the country. These benefits must still be approved by the National Congress and, if approved, would significantly benefit the economics of the Diablillos project.
Mineral Reserve Estimate – As of March 07, 2024
Table 6 shows the Proven and Probable Mineral Reserves at Diablillos by deposit. The Mineral Reserves were estimated using a silver price of $22.50/oz and a gold price of $1,750/oz.
Table 6 – Diablillos Mineral Reserve Estimate
|
Mineral Reserve (all domains) |
Tonnage (000 t) |
Au (g/t) |
Ag (g/t) |
AgEq (g/t) |
Contained Ag (koz) |
Contained Au (koz) |
Contained AgEq (koz) |
|
Proven |
12,364 |
0.86 |
177.7 |
246 |
46,796 |
341 |
97,839 |
|
Probable |
29,930 |
0.80 |
79.7 |
143 |
76,684 |
766 |
136,267 |
|
Total Proven and Probable |
42,294 |
0.81 |
90.8 |
154 |
123,480 |
1,107 |
209,619 |
Notes for Mineral Reserve Estimate:
-
Mineral reserves have an effective date of March 07, 2024.
-
The Qualified Person for the Mineral Reserve Estimate is Mr. Miguel Fuentealba, P.Eng.
-
The mineral reserves were estimated using the Canadian Institute of Mining, Metallurgy and Petroleum (CIM), Definition Standards for Mineral Resources and Reserves, as prepared by the CIM Standing Committee on Reserve Definitions and adopted by CIM Council.
-
The mineral reserves were based on a pit design which in turn aligned with an ultimate pit shell selected from a WhittleTM pit optimization exercise. Key inputs for that process are:
-
-
Metal prices of U$S 1,750/oz Au; U$S 22.50/oz Ag
-
Variable Mining cost by bench and material type. Average costs are U$S 1.94/t for all lithologies except for “cover” Cover mining cost of U$U 1.73/t, respectively.
-
Processing costs for all zone, U$S 22.97/t.
-
Infrastructure and GA cost of U$S 3.32/t.
-
Pit average slope angles varying from 37° to 60°
-
The average recovery is estimated to be 82.6% for silver and 86.5% for gold.
-
-
The Mineral Reserve Estimate has been categorized in accordance with the CIM Definition Standards (CIM, 2014).
-
A Net Value per block (“NVB”) cut-off was used to constrain the Mineral Reserve with the reserve pitshell. The NVB was based on "Benefits = Revenue-Cost" being positive, where, Revenue = [(Au Selling Price (US$/oz) - Au Selling Cost (US$/oz)) x (Au grade (g/t)/31.1035)) x Au Recovery (%)] + [(Ag Selling Price (US$/oz) - Ag Selling Cost (US$/oz)) x (Ag grade (g/t)/31.1035)) x Ag Recovery (%)] and Cost = Mining Cost (US$/t) + Process Cost (US$/t) + Transport Cost (US$/t) + GA Cost (US$/t) + [Royalty Cost (%) x Revenue]. The NVB method resulted in an average equivalent cut-off grade of approximately 46g/t AgEq.
-
In-situ bulk density was read from the block model, assigned previously to each model domain during the process of mineral resource estimation, according to samples averages of each lithology domain, separated by alteration zones and subset by oxidation.
-
All tonnages reported are dry metric tonnes and ounces of contained gold are troy ounces.
-
Mining recovery and dilution factors have not been applied to the Mineral Resource estimates.
Technical Disclosure and Qualified Persons
A A technical report in respect of the PFS (the “Technical Report”) will be completed in accordance with National Instrument 43-101 - Standards of Disclosure for Mineral Projects (“NI 43-101”) and will be filed and available on the Company’s profile on SEDAR+ within 45 days of this news release. The Technical Report will be authored and signed off by the Qualified Persons listed in Table 7.
David O’Connor P.Geo., Chief Geologist for AbraSilver, is a Qualified Person as defined by NI 43-101 and has reviewed and approved the scientific and technical information in this news release.
Table 7 – NI 43-101 Technical Report Summary
|
Qualified Person(s) |
Company |
|
Johnny Canosa, P.Eng. |
SGS Geological Services |
|
Luis Rodrigo Peralta, FAusIMM CP (Geo) |
INSA |
|
Joseph M. Keane, P.Eng. (Met) |
Consultant to SGS North America Inc. |
|
Miguel Fuentealba, MAusIMM P. Eng. |
Bmining Chile |
|
William Van Breugel, P. Eng. |
About AbraSilver
AbraSilver is an advanced-stage exploration company focused on rapidly advancing its 100%-owned Diablillos silver-gold project in the mining-friendly Salta province of Argentina. The current Proven and Probable Mineral Reserve estimate for Diablillos consists of 42.3 Mt grading 91 g/t Ag and 0.81 g/t Au, containing approximately 124 Moz silver and 1.1 Moz gold, with significant further exploration upside potential. In addition, the Company has entered into an earn-in option and joint venture agreement with Teck on the La Coipita project, whereby Teck can fund up to US$20 million in exploration expenditures and make certain other payments to earn up to an 80% interest. AbraSilver is listed on the TSX-V under the symbol “ABRA” and in the U.S. on the OTCQX under the symbol “ABBRF.”
For further information please visit the AbraSilver Resource website at www.abrasilver.com, our LinkedIn page at AbraSilver Resource Corp., and follow us on Twitter at www.twitter.com/abrasilver
Alternatively, please contact:
John Miniotis, President and CEO
Tel: +1 416-306-8334
Non-IFRS Financial Measures
This news release contains certain non-IFRS measures, including AISC. AISC includes operating costs, royalties, sustaining capital, closure costs, and corporate G&A and is calculated based on guidance provided by the World Gold Council (“WGC”). WGC is not a regulatory industry organization and does not have the authority to develop accounting standards for disclosure requirements. The Company believes that these measures, together with measures determined in accordance with IFRS, provide investors with an improved ability to evaluate the underlying performance of the Company and the results of the PFS. Non-IFRS measures do not have any standardized meaning prescribed under IFRS, and therefore they may not be comparable to similar measures employed by other companies. The data is intended to provide additional information and should not be considered in isolation or as a substitute for measures of performance prepared in accordance with IFRS.
Forward-Looking Statements
This news release contains “forward-looking statements” and/or “forward-looking information” (collectively, “forward-looking statements”) within the meaning of applicable securities legislation. All statements, other than statements of historical fact, are forward-looking statements. Generally, forward-looking statements can be identified by the use of forward-looking terminology such as “plans”, “expect”, “is expected”, “in order to”, “is focused on” (a future event), “estimates”, “intends”, “anticipates”, “believes” or variations of such words and phrases or statements that certain actions, events or results “may”, “could”, “would”, or the negative connotation thereof. In particular, statements regarding the Company’s future operations, future exploration and development activities or other development plans constitute forward-looking statements. By their nature, statements referring to mineral reserves or mineral resources constitute forward-looking statements. Forward-looking statements in this news release include, but are not limited to statements with respect to the results (if any) of further exploration work to define and expand or upgrade mineral resources and reserves at the Project; the anticipated exploration, drilling, development, construction and other activities of the Company and the results of such activities, including the completion of a preliminary scoping study in H1/2024; the mineral reserve estimates of the Project (and the assumptions underlying such estimates); the ability of exploration work (including drilling) to accurately predict mineralization; the focus of the anticipated Phase IV exploration campaign at the Project; the completion and timing for the filing of the Technical Report; the implementation of proposed reductions in corporate taxes and mining export duties in Argentina; the ability to realize upon mineralization in a manner that is economic; the ability of the Project to be among the top ten primary silver mines in the world; and any other information herein that is not a historical fact.
The Company considers its assumptions to be reasonable based on information currently available but cautions the reader that these assumptions regarding future events, many of which are beyond the control of the Company, may ultimately prove to be incorrect since they are subject to risks and uncertainties that affect the Company, its properties and business. Such risks and uncertainties include, but are not limited to, changes in demand for and price of gold, silver and other commodities (such as fuel and electricity) and currencies; changes or disruptions in the securities markets; legislative, political or economic developments in Argentina; changes in any of the assumptions underlying the PFS; the need to obtain permits and comply with laws and regulations and other regulatory requirements; the possibility that actual results of work may differ from projections/expectations or may not realize the perceived potential of the Company's projects; risks of accidents, equipment breakdowns and labour disputes or other unanticipated difficulties or interruptions; the possibility of cost overruns or unanticipated expenses in development programs; operating or technical difficulties in connection with exploration, mining or development activities; the speculative nature of exploration and development, including the risks of diminishing quantities of grades of reserves and resources; and the risks involved in the exploration, development and mining business and the additional risks described in the Company’s most recently filed Annual Information Form, annual and interim management’s discussion and analysis and other disclosure documents which are available on SEDAR+ (www.sedarplus.ca) under the Company’s issuer profile. The Company’s anticipation of and success in managing the foregoing risks could cause actual results to differ materially from what is anticipated in such forward-looking statements. Although management of the Company has attempted to identify important factors that could cause actual results to differ materially from those contained in forward-looking statements, there may be other factors that cause results not to be as anticipated, estimated or intended. The Company disclaims any intention or obligation to update or revise any forward-looking statements whether as a result of new information, future events or otherwise, except as required by applicable securities laws.
Neither the TSX Venture Exchange nor its Regulation Services Provider (as that term is defined in the policies of the TSX Venture Exchange) accepts responsibility for the adequacy or accuracy of this news release
1 Spot prices: $24.76/oz Ag & $2,180.81/oz Au closing prices on March 21, 2024 (Source: Reuters.com)
2 Please see “Non-IFRS Financial Measures”
2 Source: https://www.statista.com/statistics/253333/leading-primary-silver-mines/
3www.silverinstitute.org/wp-content/uploads/2023/11/SilverMarket2023_interim-report.pdf
Copyright (c) 2024 TheNewswire - All rights reserved.