Monument Completes Phase 2 Drilling Program
VANCOUVER, British Columbia, Sept. 23, 2022 (GLOBE NEWSWIRE) -- Monument Mining Limited (TSX-V: MMY and FSE: D7Q1) “Monument” or the “Company” is pleased to announce that the results from the Phase 2 diamond drilling (“DD”) have been received and confirmed the extension of gold mineralization, including high grades of up to 17.8g/t gold, for more than 150m vertical depth below the current Mineral Resource at the North of Alliance (“NOA”) group of deposits (NOA 1 to NOA 7/8, NOA9), offering the potential for significant future expansion of the Mineral Resource base.
The site work and data validation to wrap up the Phase 2 drilling program has now been completed at Burnakura. Together with the Phase 1 drilling program, the Company has tested greenfield targets and extensions to known mineralized structures, and successfully achieved initial objectives with the Phase 1 Junction target discovery and the Phase 2 drilling confirmation of gold mineralization extensions at depth at the NOA group of deposits highlighting the opportunity to grow the Murchison Project organically.
Monument’s President and CEO, Cathy Zhai, said: “These latest drilling results continue to demonstrate the potential of the Murchison Project and support our strategy to expand the existing Mineral Resource base that might turn Murchison Project into the Company’s cornerstone project.
We see significant potential for near mine extensions at the NOA group of deposits and across our entire Burnakura and Gabanintha land package. The Murchison Project also presents unique opportunities for greenfield targeting and potential for additional discoveries in this mineral-rich geological setting. We will continue to explore all options and opportunities using systematic exploration techniques applied to Monument’s land package”.
HIGHLIGHTS OF BURNAKURA DRILLING RESULTS
The Phase 2 drilling Results
The Phase 2 drilling program is contained within the Company’s two-year exploration program testing extensions of known mineralization down dip of the Burnakura tenements increasing the potential longer term production profile.
Phase 2 Diamond Drilling Results
- Drilling results confirm the extension of gold mineralization, including high grades of up to 17.8g/t gold, for more than 150m vertical depth below the current Mineral Resource at the NOA group of deposits, offering the potential for significant future expansion of the Mineral Resource base.
- Drilling demonstrates an increase in width, grade, and associated alteration of the mineralized package (mine sequence*) at depth, affirming that unlocking the potential for the NOA group of deposits rests with a focused exploration program to delineate additional Mineral Resources beneath the historic open pits for underground exploitation.
- Drilling highlights the potential to exploit historic pits deeper and transition to underground mining.
- Furthermore, the drilling program provides more confidence in extending the Mineral Resources beyond the current 1.6km strike limit to the immediate south of NOA 1 pit and north of NOA 7/8 deposits and offers the opportunity to deliver additional significant discoveries along the prospective NOA Shear zone.
- Significant intercepts returned from the outstanding DD portion of Phase 2 drilling program include:
- 4m at 12.0g/t gold from 392.6m in 21BNRD057 at NOA 7/8 target.
- 1m at 1.2g/t gold from 260m, 1.6m at 1.6g/t gold from 267.8m, and 2m at 17.8g/t gold from 293m in 22BNRD006 at NOA 4-6 target.
- 2.2m at 1.6g/t gold from 441m in 21BNRD055 at NOA 7/8 target.
Phase 2 Reverse Circulate Drilling Results Recap:
Significant RC intercepts (Previously reported in News Release dated May 30, 2022):
- 4m at 32.0g/t gold from 218m (including 1m at 71.8g/t gold from 219m), 1m at 1.1g/t gold from 226m, 1m at 4.2g/t gold from 229m and 1m at 1.1g/t gold in 21BNRC050 at NOA 1 target.
- 2m at 5.3g/t gold from 140m in 21BNRC047 at NOA 1 target.
The Phase 1 Drilling Results Recap
The Phase 1 drilling results were previously reported in January 19, 2022, which initiated the Company’s two-year exploration program to test unknown greenfield targets across the Burnakura tenements with the aim of increasing the potential longer-term production profile.
- As previously announced on January 19, 2022, the Company is also increasingly encouraged by the discovery of a near-surface high-grade mineralization system at the Junction target with intercepts up to 3m at 10.2g/t gold, which could rapidly advance towards production through open-cut methods.
- The early promising results at the Junction target, particularly given the near surface high grades, strengthen the Company’s resolve that the Burnakura area remains highly prospective with several untested areas which could deliver another significant gold discovery.
Follow up Works
- A critical technical evaluation, refinement and ranking of all known targets incorporating all data across the extensive tenement package are ongoing over Burnakura and Gabanintha project areas to ensure future exploration efforts continue to deliver the Company’s long-term strategy of turning the Murchison Project into a cornerstone project.
- Undertaken the following programs at Gabanintha:
- To conduct drilling targeting mineralization along strike of existing mineralization trends from the open pits and on parallel and splay mineralized structural trends identified from wide-spaced exploration drilling.
- To conduct drilling beneath the historic Terrells and Canterbury pits to test for mineralization extensions at depth which has not been closed off.
- Further programs might be carried out at Burnakura in future also include but not limited to
- A follow up phase of drilling to provide coverage across the NOA group of deposits testing for a mineralized package deeper to approximately 300m below surface and then infill drilling to provide confidence to grow the Mineral Resources when the estimate is next completed.
- To systematically test for strike continuity along the NOA mineralized structure to delineate further potential open pit and underground Mineral Resources beyond the current 1.6km strike limit.
- Follow up on the new shallow high-grade Junction discovery by drill testing for extensions using RC drilling to potentially progress it rapidly to a Mineral Resource estimation.
1Press release on July 18, 2018, titled “Monument Announces NI43-101 Mineral Resource Update at the Burnakura Property, Western Australia.” Monument confirms that it is not aware of any new information or data that materially affect the information included in the announcement of July 18, 2018, and that all material assumptions and technical parameters underpinning the Mineral Resources estimate in the announcement of July 18, 2018, have not materially changed, and continue to apply.
2Armstrong, B. 2007, “NOA 2 Gold Project Resource Statement as at 1 January 2007”, Page 10, Tectonic Resources NL. Cited in “Independent Technical Report - NI 43-101 on the Mineral and Mining Assets within the Burnakura Project held by Tectonic Resources NL, Extract Resources NL located in the Murchison Mineral Field of Western Australia for ATW Venture Corp” effective as at 22 November 2007.
3Wells, L. 2013, “Due Diligence Report on Burnakura and Gabanintha Gold Prospects of Kentor Gold Limited Final”, Page 9.
*The highly deformed and altered package of rocks contained within the BTZ is locally known as the mine sequence. The original lithologies are dominated by altered mafic with minor fine-grained felsic rocks.
PHASE 1 & 2 DRILLING PROGRAM AT BURNAKURA
Monument commenced Phase 1 of a two-year exploration drilling program in July 2021 and completed it in August 2021(refer to news releases dated December 15, 2021, and January 19, 2022). In November 2021, it commenced Phase 2 drilling (completed in April 2022), and, in May 2022, announced the results received from the RC portion of the program (refer to news release dated May 30, 2022).
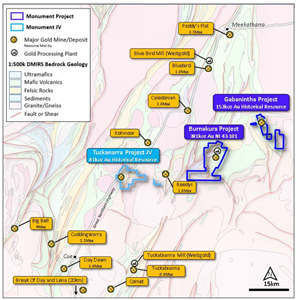
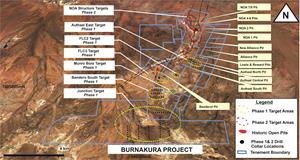
Target areas for the Phase 1 and 2 drilling falls within the Company’s Burnakura project area and are shown in Figure 1. The Burnakura area is considered highly prospective for discovering economic gold mineralization associated with the prolific Burnakura Thrust Zone (“BTZ”). This regional northeast-trending lineament dominates the area and is related to at least 15 deposits with pre-2005 historic gold production from 15 open pits and two underground operations amounting to 1.8Mt at 3.7g/t gold for a total of 216,000 ounces2. Subsequent underground mining campaigns were undertaken at NOA 2 from 2005 to 2007 (185,000 tonnes at an average grade of 7.1g/t gold for 42,289 ounces3) and in 2009 (81,150 tonnes averaging 5.81g/t gold for 13,462 ounces3).
| Figure 1: Murchison Exploration Phase 1 and Phase 2 Target Areas |
While a detailed discussion on Phase 2 drilling program is seen below, reader is recommended to refer to the News Release dated January 19, 2022 for Phase 1 drilling program discussion.
PHASE 2 DRILLING PROPRAGE DISCUSSION
The Phase 2 program focused on the New Alliance and NOA group of deposits, which have a combined Mineral Resource1 of 289Koz Indicated and 52Koz Inferred, to identify mineralized extensions aimed at increasing the scale of the previously mined open pits and underground deposits.
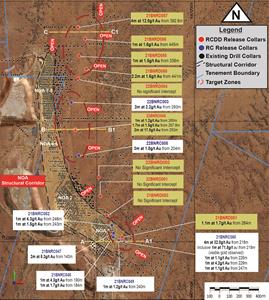
A combined 18 RC and DD holes for a total of 5,595.1m against a planned 18 holes for a combined RC and DD total of 5,546m was drilled for the Phase 2 program. The breakdown of the drilling completed is provided in Table 1. The drill locations and results reported in this press release are shown in Figures 2 and 3 and interpreted long sections and cross-sections in Figures 4, 6, 8 and 9, with all holes listed in Appendices 1 to 2.
Table 1: Completed RC and DD drilling for Phase 2
| Target | Number of holes | Drill metres | |||||
| RC | RCDD | Total | RC | DD | Total | ||
| NOA 1 | 4 | 3 | 7 | 1,559.8 | 385.5 | 1,945.3 | |
| NOA 2 | 1 | 1 | 2 | 510.0 | 49.7 | 559.7 | |
| NOA 4-6 | 1 | 1 | 2 | 525.0 | 71.0 | 596.0 | |
| NOA 7/8 | 1 | 5 | 6 | 1,740.2 | 588.9 | 2,329.1 | |
| New Alliance | 1 | - | 1 | 165.0 | - | 165.0 | |
| Total | 8 | 10 | 18 | 4,500.0 | 1,095.1 | 5,595.1 | |
All drill collars are accurately surveyed using Differential Global Positioning System (DGPS) techniques. Coordinates and azimuth are reported in MGA 94 Zone 50. Downhole survey was completed by downhole gyroscopic method at regular intervals.
Geological logging was completed for all holes and representative across the deposits. The drill hole lithology, alteration, mineralogy, and structural characteristics of core were logged directly to a digital format following procedures and using Monument Mining geologic codes. All data was imported into a central SQL geological database.
Monument Murchison Quality Control and Quality Assurance (QAQC) protocol is considered industry standard with certified reference material (CRM) regularly submitted with routine samples to ensure ongoing quality control. CRMs and Blanks are inserted at a minimum of a 5% frequency rate.
An independent commercial laboratory, ALS Geochemistry, performed all sample preparation and gold assaying of primary samples in Kalgoorlie, Western Australia. Samples were analyzed for gold by lead collection fire assay of a 50g charge with AAS finish.
| Figure 2: Phase 2 drilling completed for NOA group, showing anomalous intercepts in DD (yellow boxes) and previously reported RC results (white boxes). All intercepts are downhole widths. |
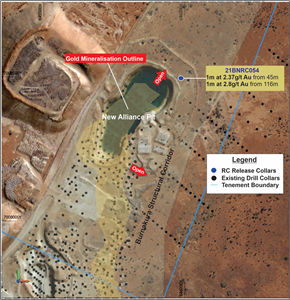
Figure 3: Phase 2 drilling completed for New Alliance target, showing anomalous RC intercepts previously reported. |
The NOA Group Phase 2 DD Drilling
NOA gold deposits comprise NOA 1 to the south and NOA 7/8 to the north and are in a flat sheetwash area and underlain by felsic to intermediate volcanic rocks and associated sediments within mafic intrusive and volcanic rocks. Five of the known deposits NOA 2, NOA 4-6 and NOA 7/8, are colinear within a northerly trending dilational structure (NOA Shear Zone) that splays off the regional BTZ and dipping to the east at approximately 30°- 60° (Figure 1). NOA 1 is offset to the east by some 200m on a different but related structure. The NOA Shear Zone intersects a dolerite sill which is interpreted as having intruded along a sequence of felsic pyroclastic flows and associated sediments and is the dominant feature at the NOA deposits that constrains and controls economic gold mineralization at depth within a strongly sheared and altered sequence of siltstone felsic volcanic and intrusive mafic rocks (Figures 1 and 2). The bulk of the mineralization occurs within massive quartz veins and quartz breccia within a large irregular silica-carbonate-sericite-pyrite (potassic) alteration halo.
The NOA 1 to NOA 4-6 deposits are in mining lease M51/116 and NOA 7/8 straddle mining leases M51/116 and M51/177. The surface RL in the area is approximately 460m, with the deepest portion at NOA 2 pit, which is about 80m below surface (Figure 4). Mining of the NOA group of deposits began in 1995 with underground ore sourced exclusively from the NOA 2 deposit. Currently, the combined unmined Mineral Resource total for the NOA area is 1.81Mt at 3.1g/t gold for 182,000 ounces of gold Indicated and 0.64Mt at 2.3g/t gold for 48,000 ounces of gold Inferred1.
The focus of the Phase 2 drilling at the NOA group of deposits was to identify extensions to existing Mineral Resources and increase the scale of the existing open pits and underground deposits at Burnakura.
Seventeen drill holes were designed to test the extensions of potentially economic mineralization down dip and down-plunge. Fourteen of the drill holes drilled intercepted the prospective horizon of quartz-sericite-pyrite alteration (mine sequence) with significant gold mineralization returned, including high grades of up to 17.8g/t gold. The mineralized package appears to continue down-plunge and down-dip of the current NOA group Mineral Resources, which remain untested by drilling along strike, down-dip, and down-plunge (Figure 4).
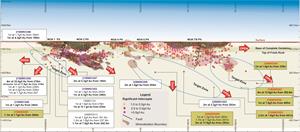
Figure 4 shows the interpretive NOA group long section looking west of recent and historic drilling with pierce point locations of the significant primary intercepts. The drill results confirm that the width, alteration, and grade of the prospective horizon are more pervasive at depth, providing significant potential for underground Mineral Resources discovery to the south of the NOA 1 open pit, further north beyond the NOA 7/8 deposit and underneath the existing NOA open pits (Figures 4, 6, 8 and 9).
These encouraging results indicate that significant potential for the NOA group of deposits hinges on a focused exploration program to delineate deeper Mineral Resources around the previously mined open pits for underground exploitation. In line with this, the Company plans to further test for mineralization extension to approximately 300m below surface to extend the underground Mineral Resource targets.
| Figure 4: NOA Group Long Section Looking West showing recent and historic drilling (Drillhole ID is grey font) with pierce point locations of the primary intercepts shown in bold. RC drilling significant intercepts are shown in white boxes and DD significant intercepts are shown in yellow boxes. All intercepts are downhole widths. |
NOA 1
NOA 1 lies east of NOA 2 and contains a north-south strike length of approximately 200m, with mineralization dipping to the east between 50° to 60° (Figure 2). Historic gold production has been from open pit, with approximately 16,200 ounces of gold recovered2. The deepest portion of the pit is approximately 75m below surface.
Before the Phase 2 drilling, drill density was limited below the pit (greater than 30m below surface) and immediately to the south, even though promising drill results indicated the potential for mineralized package to be open at depth and along strike to the south.
Seven drill holes totaling five RC (21BNRC047 to 21BNRC050 and 21BNRC052) for 1,235m and two RC pre-collars with diamond tails (RCDD) (21BNRD051 and 21BNRD053) totaling 611.3m were completed at NOA 1 area to test for possible additional Mineral Resources immediately south and down-dip of existing Mineral Resources in areas which are largely untested (Figures 2 and 4). The prospective horizon targeted is the highly sheared and altered Burnakura Thrust Zone.
Significant gold results include:
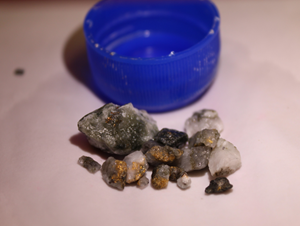
- 4m at 32.0g/t Au from 218m (including 1m at 71.8g/t Au from 219m), 1m at 1.1g/t Au from 226m, 1m at 4.2g/t Au from 229m and 1m at 1.1g/t Au in 21BNRC050 approximately 190m below surface and remains open. Visible gold was observed in RC chips associated with the 4m at 32.0g/t Au intercept (See picture in Figure 5 below).
- 2m at 5.3g/t Au from 140m in 21BNRC047.
- 1.1m at 1.7g/t Au from 246m in 21BNRD051.
- 1m at 1.2g/t Au from 240m in 21BNRC049.
- 1m at 1.7g/t Au from 184m and 1m at 4.3g/t Au from 190m in 21BNRC048.
- 1m at 1.5g/t Au from 243m and 1m at 4.3g/t Au from 246m in 12BNRC052.
| Figure 5: Visible gold sighted in RC hole 21BNRC050 at 219m downhole at NOA 1. |
The northernmost drilled DD hole 21BNRD053 did not encounter mineralization and potentially indicates the boundary of the northern extent of the NOA 1 deposit.
The location of results from drillholes reported in this release is shown in the plan view in Figure 2 and in the interpretive long sectional view in Figures 4. The E-W sectional view in Figure 6 is an interpretive cross-section 7010000mN at the NOA 1 deposit with a clipping window of 100m on either side of the section line AA1 indicated on the plan view in Figure 2. The cross-sectional view shows significant intercepts of drilling within the clipping window reported in this release shown in yellow boxes and some previously reported drilling in white boxes.
Drillholes 21BNRC047, 21BNRC048, 21BNRC049, 21BNRC050, 21BNRC052 and 21BNRD051 were drilled to target the deeper portions of the NOA 1 high-grade gold mineralization, where previous drillholes 16MRC107 and 20MRD013 had intersected 7m at 9.0g/t Au from 140m and 1m at 7.6g/t Au from 243m respectively (Figure 6). The bulk of the gold mineralization within all drillholes is associated with the strongly sheared and altered BTZ occurring within quartz veins and quartz breccia within a large irregular silica-carbonate-sericite-pyrite (potassic) alteration halo. In diamond drill core, the mineralized zones are visually distinctive due to the presence of millimeter to centimeter wide quartz-carbonate veins that are commonly folded and display yellow-brown talc-carbonate selvages. The width of the prospective horizon appears to increase at depth and remain open as depicted in the cross section in Figure 6.
The promising results intercepted beneath the NOA 1 pit indicate the potential to host significant open pit underground amendable gold mineralization immediately south, down-dip and down-plunge of the deposit, which is largely untested.
Drilling is currently being planned to focus on delineating deeper economic mineralization around the NOA 1 pit to a depth of approximately 300m below surface and to continue to test the strike extensions to the south of the deposit for potential open pit and underground exploitation.
| Figure 6: NOA 1 cross-section 7010000mN (AA1) ±100m looking North showing Phase 2 anomalous intercepts in recent RC drilling previously reported (white boxes) and anomalous intercepts in DD drilling (yellow boxes) falling within the clipping distance of the section. Historic drillholes (white boxes with grey font for drillhole IDs). All intercepts are downhole widths. |
NOA 2
Open pit mining commenced at NOA 2 in 1995 and was finalized in 1997 to a depth of approximately 80m below surface. From 2005 to 2007 and in 2009, underground mining was undertaken at NOA 2 to a total of 160m or 80m below the open cut. Approximately 26,000 ounces of gold was historically mined from open pit. Underground gold production from 2005 to 2007 at NOA 2 totaled approximately 185,000 tonnes at an average grade of 7.1g/t gold for 42,289 ounces3. Ore recovered underground in 2009 totaled 81,150 tonnes averaged 5.81g/t gold for 13,462 ounces3.
The ore structure at NOA 2 is approximately 400m in strike, dips eastward at approximately 40° and remains highly prospective for additional gold discovery.
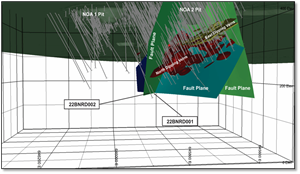
Two RCDD holes, 22BNRD001 and 22BNRD002, totaling 336.7m, were completed at NOA 2, testing the potential for extensions to economic mineralized package at depth below the deposit (Figures 2). Neither drillholes intersected the prospective horizon due to mineralization offset by a fault (Figure 7).
Figure 7: Isometric view looking south of NOA 2 showing fault planes truncating mineralization in 22BNRD001 and 22BNRD002.
Several structures cut the NOA 2 deposit, with three main systems controlling the mineralization zones (Figure 7):
- An east-west fault to the south end of the deposit separates NOA 1 and NOA 2 open pits.
- A north-south NOA Fault separates the open pit mineralization from ore mined historically underground, and;
- Northeast striking and steeply dipping series of late-stage reverse faults offsetting the mineralization.
Three main types of veins are identified to host economic gold mineralization at NOA 2 (Figure 7):
- Northerly striking and westly dipping massive quartz veins and quartz breccias. This is the primary source of gold mineralization at depth.
- The second set of gold bearing east-west striking northerly dipping narrow, high-grade veins.
- The third-generation gold-bearing veins are generally northerly striking and westly dipping.
These drillholes will help to firm up the interpreted position of the encountered fault zone to assist in future targeting of the NOA 2 deposit.
NOA 4-6
The NOA 4-6 combined ore structure strikes approximately 400m and dips to the east. The pits have been mined down to about 30m below surface. Before commencing the Phase 2 drilling, the drill density was patchy from 100m below surface, leading to sections of the ore zones interpreted as pinching out at depth, and where it remains open, the grade appears low. This situation was interpreted to be due to paucity of drilling; potential exists for the ore structure to remain continuous and open at depth.
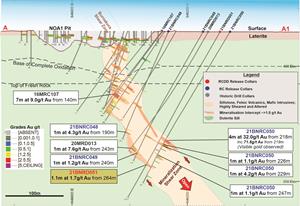
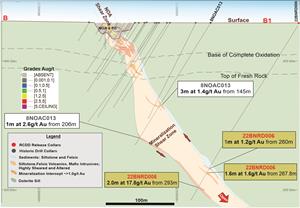
To test the NOA 4-6 Mineral Resource potential three drillholes comprising of one RCDD, 22BNRD006 totaling 316m, and two RC 22BNRC003 and 22BNRC005 for a total of 299m were completed to test the depth extent of economic gold mineralization. The location of results from drillholes reported in this release is shown in the plan view in Figure 2 and in the interpretive long sectional view in Figure 4. The E-W sectional view in Figure 8 is an interpretive cross-section 7010930mN at the NOA 4-6 deposit with a clipping window of 100m on either side of the section line BB1 indicated on the plan view in Figure 2. The cross-sectional view shows significant intercepts of DD drilling reported in this release shown in yellow boxes and some previously reported drilling in white boxes.
All the drill holes encountered mineralized package consistent with the prospective horizon confirming continuity at depth of mineralization previously encountered in 8NOAC013 of 1m at 2.6g/t Au from 206m and 3m at 1.4g/t Au from 145m (Figure 8). Results confirmed additional gold mineralization and show the NOA 4-6 mineralized package’s width and alteration remaining consistent with grade getting better at depth. High grades encountered including up to 17.8g/t gold from the deepest DD holes at approximately 250m below surface indicate a significant potential for mineralization remaining open.
Significant gold results include:
- 1m at 1.2g/t Au from 260m, 1.7m at 1.5g/t Au from 267.8m, and 2m at 17.8g/t Au from 293m 22BNRD006 (the deepest drill holes indicating mineralization remaining open below 250m from surface);
- 3m at 1.8g/t Au from 204m in 22BNRC005
- 2m at 2.2g/t Au from 293m in 22BNRC003.
The result from the drilling provides strong target for expanding on the Mineral Resources base of NOA 4-6 which remain open down-dip and down-plunge.
Overall, the NOA 4-6 results reaffirm the Company’s resolve that there exists significant potential for expanding Mineral Resources and unlocking this potential rests with a focused exploration program to delineate deeper Mineral Resources around the mined out open pits for underground exploitation.
Further drilling is currently being planned to systematically target mineralization extensions further to approximately 300m below surface along the known strike extent of the NOA 4-6 zone.
| Figure 8: NOA 4-6 cross-section 7010930mN (BB1) ±100m looking North showing Phase 2 DD drilling completed; anomalous intercepts in recent DD drilling (yellow boxes) and anomalous intercepts in historic drilling (white boxes). All intercepts are downhole widths. |
NOA 7/8
NOA 7/8 is the northernmost historic pit of the NOA group of deposits and contains a mineralized zone over a strike length of approximately 600m. The zone strikes approximately 40º and dips 50º to the east. Pit depth is down to 61m. Drill results show mineralization is open along strike to the north and south as well as open down dip. The structural setting for the gold mineralization is interpreted to be like that of the NOA 2 deposit with mineralization confined to the NOA shear zone. The host lithologies are predominantly sedimentary and felsic volcaniclastics units (Figure 9). The footwall of the mineralized zones changes from a felsic volcaniclastics below NOA 7 in the south, to an ultramafic lithology in the north below NOA 8.
Historic gold production totaled approximately 47,300 ounces of gold recovered from the open pits2. Currently, the combined unmined Mineral Resource for the NOA 7/8 total 776,000 tonnes at 4.6g/t gold for 114,000 ounces of gold Indicated and 35,000 tonnes at 3.9g/t gold for 4,000 ounces of gold Inferred1 presenting the opportunity to extend high grade mineralization which remain open at depth and along strike to the north of the deposit.
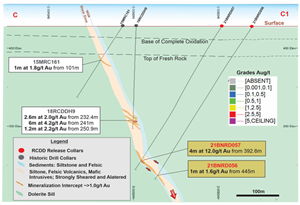
Five RCDD (21BNRD055 to 21BNRD058 and 22BNRD004) totaling 815.8m were completed to test the depth and northerly extensions for potential economic mineralized package at NOA 7/8 (Figures 2 and 4). All drillholes except 22BNRD004 encountered the NOA mineralized structure which potentially delineates the boundary of the southern extent of the NOA 7/8 deposit.
Significant intercepts assays include:
- 4m at 12.0g/t Au from 392.6m in 21BNRD057. This high-grade mineralization is encountered in the deepest drill hole further north and remains open at depth and on strike.
- 2.2m at 1.6g/t Au from 441m in 21BNRD055.
- 1m at 1.5g/t Au from 338m in 21BNRD058.
- 1m at 1.6g/t Au from 445m in 21BNRD056.
The location of results from drillholes reported in this release is shown in the plan view in Figure 2 and in the interpretive long sectional view in Figures 4. The E-W sectional view in Figure 8 is an interpretive cross-section 7011700mN at the NOA 7/8 deposit with a clipping window of 200m on either side of the section line CC1 indicated on the plan view in Figure 2. The cross-sectional view shows significant intercepts of from drill holes within the clipping window reported in this release shown in yellow boxes and some previously reported drilling in white boxes.
Figure 9: NOA 7/8 cross-section 7011700mN (CC1) ±200m clipping looking North showing Phase 2 drilling completed within the clipping window, anomalous intercepts in recent DD drilling (yellow boxes) and anomalous intercepts in historic drilling (white boxes)
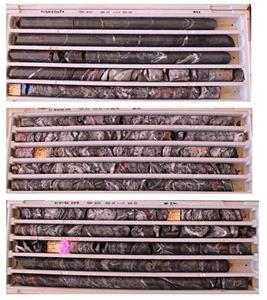
The bulk of the gold mineralization within all drillholes is associated with a highly deformed sequence of sedimentary and mafic to felsic rocks with quartz veins and quartz breccia within a large irregular silica-carbonate-sericite-pyrite (potassic) alteration halo (mine sequence). In diamond drill core, the mineralized structure or mineralized package is visually distinctive due to the presence of millimeter to centimeter wide quartz-carbonate veins that are commonly folded and highly deformed, consistent with the mine sequence constraining and controlling the economic gold mineralization defined at depth and historically mined at NOA 2 underground (Figure 10 - see picture of mineralized package intercepted in the 21BNRD057 core).
| Figure 10: Picture of 21BNRD057 core showing intercepted mineralized package of highly deformed and altered sediments, mafic with minor fine-grained felsic rocks consistent with NOA Shear Zone. |
The drill results indicate that the width, alteration, and grade of the mineralized package are becoming more pervasive at depth, and along strike providing significant potential for underground Mineral Resources discovery further north beyond the NOA 7/8 deposit and underneath the open pits. This again strongly suggests that unlocking the significant Mineral Resource potential at NOA 7/8 is reliant on focusing exploration program to delineate deeper Mineral Resources around the previously mined open pits for underground exploitation.
Drilling is being planned to target Mineral Resources down-plunge extension of the NOA 7/8 deposit to a depth of approximately 300m below surface, where the 4m at 12.0g/t Au intercept in 21BNRD057 indicates mineralization is open to the north beyond the current 600m strike extent.
New Alliance
One RC hole drilled to 165m at the New Alliance target, which has historically produced gold from an open pit (Figure 3). This hole targeted the high-grade mineralization plunge interpreted beneath the northern end of the pit. Significant assay returned include 1m at 2.4g/t Au from 45m and 1m at 2.8g/t from 116m in 21BNRC054. This zone of interpreted gold mineralization at New Alliance remains open, being mostly untested along strike and at depth.
NEXT STEPS
A critical technical evaluation, refinement and ranking of all known targets incorporating all data across the extensive tenement package are ongoing to steadily increase exploration over Burnakura and Gabanintha project areas to ensure future exploration efforts continue to deliver the Company’s long-term strategy of turning the Murchison Project into a cornerstone project.
Burnakura Projects
The encouraging results from the Phase 1 and 2 drilling provide exploration upside and warrant a follow-up phase of drilling at all targets that delivered positive results to rapidly grow the current Mineral Resources at the Murchison Project. Immediate focus at Burnakura will be:
- To conduct a follow up phase of drilling that will continue to unlock the significant exploration upside potential for Mineral Resources at NOA 1, NOA 4-6 and NOA 7/8 deposits focusing on delineating deeper mineralization beneath the mined open pits for underground exploitation to a depth of approximately 300m below surface.
- To systematically complete step-out drilling along strike to the immediate south of NOA 1 and north of NOA 7/8 which presents large exploration targets open at depth and along strike and potentially extending the Mineral Resources beyond the current 1.6km strike limit of the NOA group of deposits.
- Test for extensions to the shallow high-grade discovery at the Junction target using RC drilling to potentially progress it rapidly to a Mineral Resource estimation.
- Explore other options at the Junction target to delineate additional shallow high-grade economic gold mineralized systems that remains untested and open within a strong shear zone and no known historic drilling or surface sampling. This will include:
- Completing geochemical sampling to the east of the most easterly drilled line in areas that are not under sheetwash.
- Continuing undertaking geological mapping to the east of the Junction target to help identify additional areas suitable for geochemical sampling and refine existing targets.
- Conduct air core drilling to the east and west of the high-grade drill line.
Gabanintha Project
The Gabanintha Project area is within trucking distance (approximately 21km northeast) of the existing Burnakura processing facility (Figure 13). The project contains six historic open pits on a 2.4km strike along the prolific Gabanintha Shear Zone, which provide immediate exploration targets proximal to mined areas. The pits were mined to depths of 40 to 70m and produced approximately 150,000 ounces of gold3. Significant opportunity exists to extend the mineralization at depth and along strike in these target areas due to limited exploration conducted since closure of the open pit operations some 27 years ago, limited deep drilling and an existing historic unmined potential Mineral Resource3 of 2.21Mt at 2.2g/t gold for 153,000 ounces.
The Company strongly believes this presents a significant opportunity to accelerate the expansion of the Mineral Resource base by extending, converting, and validating these historical Mineral Resources into current Mineral Resources under NI 43-101 guidelines. The following exploration activities are planned:
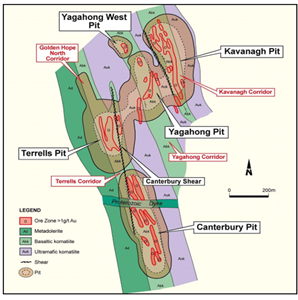
- To conduct drilling to the north of the Yagahong pit for possible Mineral Resources, which may be amenable to exploitation by open pit mining as a potential cut-back (Figure 11). The Yagahong historic significant drill assays include high grades up to 3m at 60.2g/t gold (Figure 12).
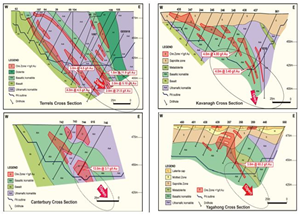
- To conduct drilling beneath the Terrells, Canterbury and Canterbury South pits to test for mineralization extensions at depth as existing drilling is patchy and has not closed off mineralization. The anomalous mineralization intercepts with increasing depth indicate the potential for additional gold Mineral Resources beneath the pits. Historic high-grade intercept beneath the Terrells pit includes 2m at 21.5g/t gold, 4m at 4.5g/t gold and 13m at 3.1g/t gold at Canterbury (Figure 12).
- To conduct drilling targeting mineralization along strike of existing mineralization trends from the open pits and on parallel and splay mineralized structural trends identified from wide-spaced exploration drilling. These represent the best potential for delineating further open pit amenable Mineral Resources at Gabanintha.
| Figure 11: Local geology and mineralization trend of the Gabanintha historic pits |
Figure 12: Interpretive cross section of the Gabanintha pits showing historic drill intercept results |
BACKGROUND OF THE MURCHISON GOLD PROJECT
The Murchison Gold Project comprises 170km2 of highly prospective Archean Greenstone. The project area covers the eastern margin of the Meekatharra-Wydgee greenstone belt within the north-eastern Murchison domain (Figure 13). Historically the Murchison Goldfield has produced over 15 million ounces of gold since the 1900’s and currently hosts significant gold producers in the region.
Figure 13: Monument Murchison Gold Project and surrounding gold production to date
- Source of Gabanintha Historical Resources figures: Mapleson, D., (2013) Murchison Gold Project: Burnakura and Gabanintha Resource Inventory. By BMGS for Monument Mining Limited. December 2013;
- Surrounding historical gold production is indicative only and collected by Monument geologists.
Qualified Person’s Statement
The technical and scientific information in this press release has been compiled by Mr Ekow Taylor, MAusIMM CP (Geo), the Chief Managing Geologist at Monument Mining Limited, a Qualified Person as defined by NI 43-101, and has been reviewed and approved by Roger Stangler, MEng, FAusIMM, MAIG, a Qualified Person as defined by NI43-101, retained by Golder Associates Pty Ltd.
About Monument
Monument Mining Limited (TSX-V: MMY, FSE:D7Q1) is an established Canadian gold producer that 100% owns and operates the Selinsing Gold Mine in Malaysia and the Murchison Gold Project in the Murchison area of Western Australia. It has 20% interest in Tuckanarra Gold Project jointly owned with Odyssey Gold Ltd in the same region. The Company employs approximately 200 people in both regions and is committed to the highest standards of environmental management, social responsibility, and health and safety for its employees and neighboring communities.
Cathy Zhai, President and CEO
Monument Mining Limited
Suite 1580 -1100 Melville Street
Vancouver, BC V6E 4A6
FOR FURTHER INFORMATION visit the company web site at www.monumentmining.com or contact:
Richard Cushing, MMY Vancouver T: +1-604-638-1661 x102 rcushing@monumentmining.com
"Neither TSX Venture Exchange nor its Regulation Services Provider (as that term is defined in the policies of the TSX Venture Exchange) accepts responsibility for the adequacy or accuracy of this release."
Forward-Looking Statement
This news release includes statements containing forward-looking information about Monument, its business and future plans ("forward-looking statements"). Forward-looking statements are statements that involve expectations, plans, objectives or future events that are not historical facts and include the Company's plans with respect to its mineral projects and the timing and results of proposed programs and events referred to in this news release. Generally, forward-looking information can be identified by the use of forward-looking terminology such as "plans", "expects" or "does not expect", "is expected", "budget", "scheduled", "estimates", "forecasts", "intends", "anticipates" or "does not anticipate", or "believes", or variations of such words and phrases or state that certain actions, events or results "may", "could", "would", "might" or "will be taken", "occur" or "be achieved". The forward-looking statements in this news release are subject to various risks, uncertainties and other factors that could cause actual results or achievements to differ materially from those expressed or implied by the forward-looking statements. These risks and certain other factors include, without limitation: risks related to general business, economic, competitive, geopolitical and social uncertainties; uncertainties regarding the results of current exploration activities; uncertainties in the progress and timing of development activities; foreign operations risks; other risks inherent in the mining industry and other risks described in the management discussion and analysis of the Company and the technical reports on the Company's projects, all of which are available under the profile of the Company on SEDAR at www.sedar.com. Material factors and assumptions used to develop forward-looking statements in this news release include: expectations regarding the estimated cash cost per ounce of gold production and the estimated cash flows which may be generated from the operations, general economic factors and other factors that may be beyond the control of Monument; assumptions and expectations regarding the results of exploration on the Company's projects; assumptions regarding the future price of gold of other minerals; the timing and amount of estimated future production; the expected timing and results of development and exploration activities; costs of future activities; capital and operating expenditures; success of exploration activities; mining or processing issues; exchange rates; and all of the factors and assumptions described in the management discussion and analysis of the Company and the technical reports on the Company's projects, all of which are available under the profile of the Company on SEDAR at www.sedar.com. Although the Company has attempted to identify important factors that could cause actual results to differ materially from those contained in forward-looking statements, there may be other factors that cause results not to be as anticipated, estimated or intended. There can be no assurance that such statements will prove to be accurate, as actual results and future events could differ materially from those anticipated in such statements. Accordingly, readers should not place undue reliance on forward-looking statements. The Company does not undertake to update any forward-looking statements, except in accordance with applicable securities laws.
APPENDIX 1
Table 2: Drill Holes Details
| Hole ID | Depth (m) | Dip | Azimuth | Grid_ID | mEast | mNorth | mRL |
| 21BNRC047 | 197 | -63.8° | 272.6° | MGA94_50 | 646170 | 7010073 | 460 |
| 21BNRC048 | 203 | -65.3° | 273.5° | MGA94_50 | 646166 | 7010035 | 460 |
| 21BNRC049 | 255 | -59.3° | 270.3° | MGA94_50 | 646228 | 7010007 | 460 |
| 21BNRC050 | 303 | -58.3° | 267.9° | MGA94_50 | 646274 | 7010001 | 4560 |
| 21BNRC052 | 277 | -58.6° | 269.9° | MGA94_50 | 646154 | 7010133 | 460 |
| 21BNRC054 | 165 | -59.6° | 304.7° | MGA94_50 | 645986 | 7008493 | 464 |
| 22BNRC003 | 299 | -62.5° | 264.3° | MGA94_50 | 645740 | 7011160 | 458 |
| 22BNRC005 | 280 | -58.3° | 267.9° | MGA94_50 | 645815 | 7010717 | 459 |
| 21BNRD051 | 329.1 | -59.0° | 269.9° | MGA94_50 | 646257 | 7010038 | 460 |
| 21BNRD053 | 282.2 | -53.9° | 252.2° | MGA94_50 | 646104 | 7010221 | 460 |
| 21BNRD055 | 459 | -58.7° | 263.5° | MGA94_50 | 645895 | 7011433 | 457 |
| 21BNRD056 | 456.5 | -58.7° | 254.8° | MGA94_50 | 645880 | 7011687 | 456 |
| 21BNRD057 | 420.5 | -59.7° | 266.6° | MGA94_50 | 645808 | 7011784 | 456 |
| 21BNRD058 | 356.8 | -60.7° | 269.3° | MGA94_50 | 645818 | 7011545 | 460 |
| 22BNRD001 | 336.7 | -59.9° | 266.6° | MGA94_50 | 646034 | 7010380 | 460 |
| 22BNRD002 | 321.5 | -65.9° | 253.9° | MGA94_50 | 646019 | 7010536 | 459 |
| 22BNRD004 | 336.6 | -63.9° | 264.8° | MGA94_50 | 645805 | 7011356 | 457 |
| 22BNRD006 | 316 | -61.5° | 265.3° | MGA94_50 | 645776 | 7010930 | 459 |
Table 3: Summary of Individual Significant Intercepts
| Hole_ID | mFrom | mTo | mWidth | Au (g/t) |
| 21BNRC047 | 140 | 141 | 1 | 4.5 |
| 21BNRC047 | 141 | 142 | 1 | 6.2 |
| 21BNRC048 | 184 | 185 | 1 | 1.7 |
| 21BNRC048 | 190 | 191 | 1 | 4.3 |
| 21BNRC049 | 240 | 241 | 1 | 1.22 |
| 21BNRC050 | 218 | 219 | 1 | 25. |
| 21BNRC050 | 219 | 220 | 1 | 71.8 |
| 21BNRC050 | 220 | 221 | 1 | 2.0 |
| 21BNRC050 | 221 | 222 | 1 | 28.7 |
| 21BNRC050 | 226 | 227 | 1 | 1.1 |
| 21BNRC050 | 229 | 230 | 1 | 4.2 |
| 21BNRC050 | 247 | 248 | 1 | 1.1 |
| 21BNRC052 | 243 | 244 | 1 | 1.5 |
| 21BNRC052 | 246 | 247 | 1 | 4.31 |
| 21BNRC054 | 45 | 46 | 1 | 2.4 |
| 21BNRC054 | 116 | 117 | 1 | 2.8 |
| 21BNRD051 | 263.95 | 265 | 1.1 | 1.7 |
| 21BNRD055 | 441.0 | 442.1 | 1.1 | 1.2 |
| 21BNRD055 | 442.1 | 443.2 | 1.1 | 2.0 |
| 22BNRD006 | 260.0 | 261.0 | 1.0 | 1.2 |
| 22BNRD006 | 267.8 | 268.7 | 0.8 | 1.2 |
| 22BNRD006 | 268.7 | 269.5 | 0.8 | 1.9 |
| 22BNRD006 | 293.0 | 294.0 | 1.0 | 17.5 |
| 22BNRD006 | 294.0 | 295.0 | 1.0 | 18.1 |
| 22BNRD056 | 445.0 | 446.0 | 1.0 | 1.6 |
| 22BNRD058 | 338.0 | 339.0 | 1.0 | 1.5 |
| 21BNRD057 | 392.6 | 393.2 | 0.6 | 3.6 |
| 21BNRD057 | 393.2 | 393.8 | 0.6 | 2.8 |
| 21BNRD057 | 393.8 | 394.4 | 0.6 | 19.4 |
| 21BNRD057 | 394.4 | 395.1 | 0.7 | 1.1 |
| 21BNRD057 | 395.1 | 395.5 | 0.4 | 39.1 |
| 21BNRD057 | 395.5 | 396.1 | 0.6 | 23.3 |
| 21BNRD057 | 396.1 | 396.7 | 0.6 | 3.3 |
Notes:
- The cut-off grade for reporting of each individual intercept is ≥ 1.0g/t Au with a maximum of 1m of consecutive internal dilution included within the intercept; only intercepts ≥ 1m are reported.
- Samples are analyzed for Au (ALS Geochemistry Au-AA26 50g FA method) which is a 50g fire assay fusion with AAS instrument finish.
APPENDIX 2 - PHASE 2 DD DRILL RESULTS
| 21BNRD051 | |||||||||||
| mFrom | mTo | Au g/t | mFrom | mTo | Au g/t | mFrom | mTo | Au g/t | mFrom | mTo | Au g/t |
| 0 | 220 | Not Assayed | 231 | 232 | 0.01 | 246 | 247 | 0.01 | 261 | 262 | 0.01 |
| 220 | 221 | 0.0 | 232 | 233 | 0.5 | 247 | 248 | 0.01 | 262 | 263 | 0.01 |
| 221 | 222 | 0.7 | 234 | 235 | 0.01 | 251 | 252 | 0.01 | 263 | 264 | 0.62 |
| 222 | 223 | 0.1 | 235 | 236 | 0.01 | 215 | 252 | 0.01 | 264 | 265 | 1.63 |
| 223 | 224 | 0.01 | 236 | 237 | 0.01 | 252 | 253 | 0.01 | 265 | 266 | 0.03 |
| 224 | 225 | 0.01 | 241 | 242 | 0.01 | 253 | 254 | 0.20 | 266 | 267 | 0.01 |
| 225 | 226 | 0.3 | 242 | 243 | 0.01 | 254 | 255 | 0.02 | 267 | 268 | 0.01 |
| 226 | 227 | 0.01 | 243 | 244 | 0.4 | 255 | 256 | 0.01 | |||
| 227 | 228 | 0.01 | 244 | 245 | 0.1 | 256 | 257 | 0.01 | |||
| 230 | 231 | 0.01 | 245 | 246 | 0.02 | 260 | 261 | 0.01 | |||
| 21BNRD055 | |||||||||||
| mFrom | mTo | Au g/t | mFrom | mTo | Au g/t | mFrom | mTo | Au g/t | mFrom | mTo | Au g/t |
| 257 | 258 | 0.01 | 282 | 283 | 0.01 | 309 | 310 | 0.01 | 335 | 336 | 0.01 |
| 258 | 259 | 0.01 | 283 | 284 | 0.01 | 310 | 311 | 0.01 | 336 | 337 | 0.01 |
| 259 | 260.2 | 0.01 | 284 | 285 | 0.01 | 311 | 312 | 0.01 | 337 | 337.5 | 0.01 |
| 260.2 | 261 | 0.01 | 285 | 286 | 0.01 | 312 | 313 | 0.01 | 337.5 | 338 | 0.01 |
| 261 | 262 | 0.01 | 286 | 287 | 0.01 | 313 | 314 | 0.01 | 338 | 339 | 0.01 |
| 262 | 263 | 0.01 | 287 | 288 | 0.01 | 314 | 315 | 0.01 | 339 | 340 | 0.02 |
| 263 | 264.2 | 0.01 | 288 | 289 | 0.01 | 315 | 316 | 0.01 | 340 | 341 | 0.01 |
| 264.2 | 265 | 0.01 | 289 | 290 | 0.01 | 316 | 317 | 0.01 | 341 | 342 | 0.01 |
| 265 | 265.8 | 0.01 | 290 | 291 | 0.01 | 317 | 318 | 0.01 | 342 | 343 | 0.01 |
| 265.8 | 266.5 | 0.01 | 291 | 292 | 0.01 | 318 | 319 | 0.01 | 343 | 344 | 0.01 |
| 266.5 | 267.2 | 0.01 | 292 | 293 | 0.01 | 319 | 320 | 0.01 | 344 | 345 | 0.01 |
| 267.2 | 268 | 0.01 | 293 | 294 | 0.01 | 320 | 321 | 0.01 | 345 | 346 | 0.01 |
| 267.2 | 268 | 0.01 | 294 | 295 | 0.01 | 321 | 322 | 0.01 | 346 | 347 | 0.01 |
| 268 | 268.9 | 0.01 | 295 | 296 | 0.01 | 322 | 323 | 0.01 | 347 | 348 | 0.01 |
| 268.9 | 270 | 0.01 | 296 | 297 | 0.01 | 323 | 324 | 0.01 | 348 | 349 | 0.01 |
| 270 | 271 | 0.01 | 297 | 298.15 | 0.01 | 324 | 325 | 0.02 | 349 | 350 | 0.01 |
| 271 | 272 | 0.01 | 298.15 | 298.75 | 0.01 | 325 | 325.75 | 0.01 | 350 | 351 | 0.01 |
| 272 | 273 | 0.01 | 298.75 | 300 | 0.01 | 325.75 | 327 | 0.01 | 351 | 352 | 0.01 |
| 273 | 274 | 0.01 | 300 | 301 | 0.02 | 327 | 328 | 0.01 | 352 | 353 | 0.01 |
| 274 | 275 | 0.01 | 301 | 302 | 0.01 | 328 | 328.9 | 0.01 | 353 | 354 | 0.01 |
| 275 | 276 | 0.01 | 302 | 303 | 0.01 | 328.9 | 329.55 | 0.01 | 354 | 355 | 0.01 |
| 276 | 277 | 0.01 | 303 | 304 | 0.01 | 329.55 | 330 | 0.01 | 355 | 355.6 | 0.01 |
| 277 | 278 | 0.01 | 304 | 305 | 0.01 | 330 | 331 | 0.01 | 355.6 | 356.05 | 0.01 |
| 278 | 279 | 0.01 | 305 | 306 | 0.01 | 331 | 332 | 0.01 | 356.05 | 357 | 0.01 |
| 279 | 280.2 | 0.01 | 306 | 307 | 0.01 | 332 | 333 | 0.01 | 356.05 | 357 | 0.01 |
| 280.2 | 281 | 0.01 | 307 | 307.75 | 0.01 | 333 | 334 | 0.01 | 357 | 358 | 0.01 |
| 281 | 282 | 0.01 | 307.75 | 309 | 0.01 | 334 | 335 | 0.01 | 358 | 359 | 0.01 |
| 21BNRD055 - CONTINUED | |||||||||||
| mFrom | mTo | Au g/t | mFrom | mTo | Au g/t | mFrom | mTo | Au g/t | mFrom | mTo | Au g/t |
| 359 | 360 | 0.01 | 385.1 | 386 | 0.01 | 409.95 | 410.5 | 0.01 | 433.2 | 434.3 | 0.01 |
| 360 | 361 | 0.01 | 386 | 386.95 | 0.01 | 410.5 | 411 | 0.01 | 434.3 | 435 | 0.16 |
| 361 | 361.45 | 0.01 | 386.95 | 388 | 0.01 | 411 | 412 | 0.01 | 435 | 436 | 0.01 |
| 361.45 | 362.1 | 0.01 | 388 | 389 | 0.01 | 412 | 413 | 0.01 | 436 | 437 | 0.01 |
| 362.1 | 363 | 0.01 | 389 | 390 | 0.01 | 413 | 414 | 0.01 | 437 | 438 | 0.02 |
| 363 | 364 | 0.01 | 390 | 391 | 0.02 | 414 | 415 | 0.01 | 438 | 439.05 | 0.03 |
| 364 | 364.95 | 0.01 | 391 | 392 | 0.01 | 415 | 416 | 0.01 | 439.05 | 440 | 0.13 |
| 364.95 | 366 | 0.01 | 392 | 393 | 0.01 | 416 | 417 | 0.01 | 440 | 441 | 0.62 |
| 366 | 367 | 0.01 | 393 | 394 | 0.01 | 417 | 417.8 | 0.01 | 441 | 442.1 | 1.2 |
| 367 | 368 | 0.01 | 394 | 395 | 0.02 | 417.8 | 419 | 0.01 | 442.1 | 443.2 | 1.97 |
| 368 | 369.1 | 0.01 | 395 | 396 | 0.01 | 419 | 419.45 | 0.01 | 443.2 | 444.3 | 0.76 |
| 369.1 | 370 | 0.01 | 396 | 396.85 | 0.02 | 419.45 | 419.85 | 0.01 | 444.3 | 445 | 0.52 |
| 370 | 371.1 | 0.01 | 396.85 | 398 | 0.01 | 419.85 | 420.3 | 0.01 | 445 | 446 | 0.05 |
| 371.1 | 372 | 0.01 | 398 | 399 | 0.02 | 420.5 | 421.1 | 0.01 | 446 | 447 | 0.14 |
| 372 | 373 | 0.01 | 399 | 399.7 | 0.01 | 421.1 | 422 | 0.01 | 447 | 448 | 0.09 |
| 373 | 374 | 0.01 | 399.7 | 400.1 | 0.01 | 422 | 423 | 0.01 | 448 | 448.75 | 0.37 |
| 374 | 375 | 0.01 | 400.1 | 401 | 0.01 | 423 | 424 | 0.01 | 448.75 | 449.75 | 0.02 |
| 375 | 376 | 0.01 | 401 | 402 | 0.01 | 424 | 425 | 0.01 | 449.75 | 450.75 | 0.36 |
| 376 | 377 | 0.01 | 402 | 402.7 | 0.01 | 425 | 426 | 0.01 | 450.75 | 451.2 | 0.39 |
| 377 | 378 | 0.01 | 402.7 | 403.5 | 0.01 | 426 | 427 | 0.01 | 451.2 | 452 | 0.28 |
| 378 | 379 | 0.02 | 403.5 | 404.5 | 0.01 | 427 | 428 | 0.01 | 452 | 453 | 0.15 |
| 379 | 380 | 0.01 | 404.5 | 405.5 | 0.01 | 428 | 429 | 0.01 | 453 | 454 | 0.01 |
| 380 | 381 | 0.01 | 405.5 | 406.35 | 0.01 | 429 | 430.15 | 0.01 | 454 | 455 | 0.25 |
| 381 | 382 | 0.01 | 406.35 | 407 | 0.01 | 430.15 | 431 | 0.01 | 455 | 456 | 0.22 |
| 382 | 383 | 0.01 | 407 | 408 | 0.01 | 431 | 431.9 | 0.01 | 456 | 457 | 0.76 |
| 383 | 384 | 0.01 | 408 | 409 | 0.01 | 431.9 | 432.5 | 0.02 | 457 | 458 | 0.28 |
| 384 | 385.1 | 0.01 | 409 | 409.95 | 0.01 | 432.5 | 433.2 | 0.02 | 458 | 459 | 0.26 |
| 22BNRD006 | |||||||||||
| mFrom | mTo | Au g/t | mFrom | mTo | Au g/t | mFrom | mTo | Au g/t | mFrom | mTo | Au g/t |
| 255 | 256 | 0.01 | 263 | 264 | 0.01 | 270.53 | 271.5 | 0.01 | 292.13 | 293 | 0.21 |
| 256 | 256.8 | 0.01 | 264 | 265 | 0.01 | 271.5 | 272 | 0.01 | 293 | 294 | 17.5 |
| 256.8 | 258 | 0.03 | 265 | 265.92 | 0.01 | 286.33 | 287.18 | 0.07 | 294 | 295 | 18.05 |
| 258 | 259 | 0.43 | 265.92 | 266.63 | 0.03 | 287.18 | 288 | 0.03 | 295 | 296 | 0.01 |
| 259 | 260 | 0.11 | 266.63 | 267.8 | 0.49 | 288 | 289 | 0.09 | 296 | 297 | 0.07 |
| 260 | 260.98 | 1.21 | 267.8 | 268.65 | 1.19 | 289 | 290 | 0.35 | 297 | 298 | 0.01 |
| 260.98 | 262 | 0.02 | 268.65 | 269.45 | 1.92 | 290 | 291 | 0.23 | 298 | 299 | 0.01 |
| 262 | 263 | 0.01 | 269.45 | 270.53 | 0.02 | 291 | 292.13 | 0.09 | 292.13 | 293 | 0.21 |
| 21BNRD056 | |||||||||||
| mFrom | mTo | Au g/t | mFrom | mTo | Au g/t | mFrom | mTo | Au g/t | mFrom | mTo | Au g/t |
| 298.4 | 299 | 0.01 | 337.8 | 338.5 | 0.01 | 377 | 377.8 | 0.01 | 417 | 418 | 0.01 |
| 299 | 300 | 0.01 | 338.5 | 339.2 | 0.01 | 377.8 | 379 | 0.02 | 418 | 419.2 | 0.01 |
| 300 | 301 | 0.01 | 339.2 | 340 | 0.01 | 379 | 380 | 0.01 | 419.2 | 420 | 0.01 |
| 301 | 302 | 0.01 | 340 | 341 | 0.01 | 380 | 381 | 0.05 | 420 | 421.2 | 0.01 |
| 302 | 302.95 | 0.01 | 341 | 342 | 0.01 | 381 | 382.15 | 0.02 | 421.2 | 421.58 | 0.01 |
| 302.95 | 304 | 0.01 | 342 | 343 | 0.01 | 382.15 | 383 | 0.01 | 421.58 | 422.6 | 0.02 |
| 304 | 305 | 0.01 | 343 | 344 | 0.01 | 383 | 384 | 0.01 | 422.6 | 423.8 | 0.01 |
| 305 | 306 | 0.01 | 344 | 345 | 0.01 | 384 | 385.05 | 0.01 | 423.8 | 425 | 0.01 |
| 306 | 307 | 0.01 | 345 | 346 | 0.01 | 385.05 | 386 | 0.01 | 425 | 426 | 0.01 |
| 307 | 308 | 0.01 | 346 | 347 | 0.01 | 386 | 387 | 0.01 | 426 | 427.05 | 0.01 |
| 308 | 308.45 | 0.01 | 347 | 348 | 0.01 | 387 | 387.95 | 0.01 | 427.05 | 427.7 | 0.01 |
| 308.45 | 308.85 | 0.01 | 348 | 349 | 0.01 | 387.95 | 389.05 | 0.01 | 427.7 | 428.4 | 0.01 |
| 308.85 | 310 | 0.01 | 349 | 350 | 0.01 | 389.05 | 389.55 | 0.02 | 428.4 | 429.4 | 0.01 |
| 310 | 311 | 0.01 | 350 | 351 | 0.01 | 389.55 | 390.15 | 0.01 | 429.4 | 430.1 | 0.01 |
| 311 | 312 | 0.01 | 351 | 352 | 0.01 | 390.15 | 391 | 0.01 | 430.1 | 431 | 0.1 |
| 312 | 313 | 0.01 | 352 | 353 | 0.01 | 391 | 391.65 | 0.01 | 431 | 431.68 | 0.07 |
| 313 | 314 | 0.01 | 353 | 354 | 0.01 | 391.65 | 392.4 | 0.01 | 431.68 | 432.4 | 0.01 |
| 314 | 315 | 0.01 | 354 | 354.7 | 0.01 | 392.4 | 393 | 0.01 | 432.4 | 433.05 | 0.15 |
| 315 | 315.5 | 0.01 | 354.7 | 355.4 | 0.01 | 393 | 394 | 0.01 | 433.05 | 434 | 0.21 |
| 315.5 | 316 | 0.01 | 355.4 | 356.5 | 0.01 | 394 | 395.2 | 0.01 | 434 | 435 | 0.04 |
| 316 | 317 | 0.01 | 356.5 | 357 | 0.01 | 395.2 | 396 | 0.03 | 435 | 435.9 | 0.04 |
| 317 | 318 | 0.01 | 357 | 358 | 0.01 | 396 | 397 | 0.01 | 435.9 | 436.5 | 0.22 |
| 318 | 319 | 0.01 | 358 | 359 | 0.03 | 397 | 397.85 | 0.01 | 436.5 | 437.4 | 0.11 |
| 319 | 320 | 0.01 | 359 | 360 | 0.01 | 397.85 | 399 | 0.01 | 437.4 | 437.9 | 0.57 |
| 320 | 321 | 0.01 | 360 | 361 | 0.01 | 399 | 400 | 0.01 | 437.9 | 438.5 | 0.56 |
| 321 | 322 | 0.01 | 361 | 362 | 0.01 | 400 | 400.7 | 0.01 | 438.5 | 439.2 | 0.03 |
| 322 | 323 | 0.01 | 362 | 362.7 | 0.01 | 400.7 | 401.8 | 0.01 | 439.2 | 439.95 | 0.03 |
| 323 | 324 | 0.01 | 362.7 | 363.4 | 0.01 | 401.8 | 402.9 | 0.01 | 439.95 | 440.95 | 0.04 |
| 324 | 325 | 0.01 | 363.4 | 364 | 0.01 | 402.9 | 404 | 0.01 | 440.95 | 442 | 0.25 |
| 325 | 326 | 0.01 | 364 | 365 | 0.01 | 404 | 405 | 0.01 | 442 | 442.9 | 0.19 |
| 326 | 327 | 0.01 | 365 | 366 | 0.01 | 405 | 406 | 0.01 | 442.9 | 443.85 | 0.05 |
| 327 | 328 | 0.01 | 366 | 367 | 0.01 | 406 | 407 | 0.01 | 443.85 | 444.3 | 0.1 |
| 328 | 329 | 0.01 | 366 | 368 | 0.01 | 407 | 408 | 0.01 | 444.3 | 445 | 0.53 |
| 329 | 330 | 0.01 | 368 | 369 | 0.01 | 408 | 409 | 0.01 | 445 | 446 | 1.58 |
| 330 | 331 | 0.01 | 369 | 370 | 0.01 | 409 | 410 | 0.01 | 446 | 447 | 0.19 |
| 331 | 332 | 0.01 | 370 | 370.85 | 0.01 | 410 | 411.1 | 0.02 | 447 | 448 | 0.1 |
| 332 | 333 | 0.01 | 370.85 | 372 | 0.01 | 411.1 | 412 | 0.01 | 448 | 448.7 | 0.03 |
| 333 | 334 | 0.01 | 372 | 373 | 0.01 | 412 | 413 | 0.01 | 448 | 448.7 | 0.03 |
| 334 | 335.1 | 0.01 | 373 | 374 | 0.01 | 413 | 414 | 0.01 | 448.7 | 449.25 | 0.02 |
| 335.1 | 336 | 0.01 | 374 | 375 | 0.01 | 414 | 415 | 0.01 | 449.25 | 450.4 | 0.01 |
| 336 | 337 | 0.01 | 375 | 376 | 0.01 | 414 | 415 | 0.01 | 450.4 | 451.6 | 0.01 |
| 337 | 337.8 | 0.01 | 376 | 377 | 0.01 | 415 | 416.2 | 0.01 | 451.6 | 456.5 | 0.01 |
| 21BNRD058 | |||||||||||
| mFrom | mTo | Au g/t | mFrom | mTo | Au g/t | mFrom | mTo | Au g/t | mFrom | mTo | Au g/t |
| 311 | 312 | 0.02 | 323 | 324 | 0.01 | 335 | 336 | 0.01 | 346.45 | 317.25 | 0.01 |
| 312 | 313 | 0.01 | 324 | 325 | 0.01 | 336 | 337 | 0.01 | 317.25 | 348 | 0.01 |
| 313 | 314 | 0.01 | 325 | 326 | 0.01 | 337 | 338 | 0.01 | 348 | 349 | 0.01 |
| 314 | 315 | 0.01 | 326 | 327 | 0.01 | 338 | 338.98 | 1.51 | 349 | 350 | 0.01 |
| 315 | 316 | 0.01 | 327 | 328 | 0.01 | 338.98 | 339.75 | 0.05 | 350 | 351 | 0.01 |
| 316 | 317 | 0.01 | 328 | 328.95 | 0.01 | 339.75 | 341 | 0.23 | 351 | 352 | 0.01 |
| 317 | 318 | 0.01 | 328.95 | 330 | 0.01 | 341 | 342 | 0.1 | 352 | 353 | 0.01 |
| 318 | 319 | 0.01 | 330 | 331.15 | 0.01 | 342 | 343 | 0.03 | 353 | 354.2 | 0.01 |
| 319 | 320 | 0.01 | 331.15 | 332.1 | 0.01 | 343 | 344 | 0.07 | 354.2 | 355 | 0.01 |
| 320 | 321 | 0.01 | 332.1 | 333.1 | 0.01 | 344 | 344.6 | 0.04 | 355 | 356 | 0.01 |
| 321 | 322 | 0.01 | 333.1 | 334 | 0.01 | 344.6 | 345.85 | 0.01 | 356 | 356.8 | 0.01 |
| 322 | 323 | 0.01 | 334 | 335 | 0.01 | 345.85 | 346.45 | 0.05 | 346.45 | 317.25 | 0.01 |
| 21BNRD057 | |||||||||||
| mFrom | mTo | Au g/t | mFrom | mTo | Au g/t | mFrom | mTo | Au g/t | mFrom | mTo | Au g/t |
| 148 | 149 | 0.01 | 214 | 215 | 0.01 | 238 | 239 | 0.03 | 262 | 263 | 0.01 |
| 149 | 150 | 0.01 | 215 | 216 | 0.01 | 239 | 240 | 0.01 | 263 | 264 | 0.01 |
| 150 | 151 | 0.01 | 216 | 217 | 0.02 | 240 | 241 | 0.02 | 264 | 265 | 0.01 |
| 151 | 152 | 0.01 | 217 | 218 | 0.01 | 241 | 242 | 0.03 | 264 | 265 | 0.01 |
| 152 | 153 | 0.01 | 218 | 219 | 0.01 | 242 | 243 | 0.02 | 265 | 266 | 0.01 |
| 153 | 154 | 0.01 | 219 | 220 | 0.05 | 243 | 244 | 0.12 | 266 | 267 | 0.01 |
| 154 | 155 | 0.01 | 220 | 221 | 0.14 | 244 | 245 | 0.02 | 267 | 268 | 0.01 |
| 155 | 156 | 0.01 | 221 | 222 | 0.03 | 245 | 246 | 0.01 | 268 | 269 | 0.01 |
| 156 | 157 | 0.01 | 222 | 223 | 0.06 | 246 | 247 | 0.01 | 269 | 270 | 0.01 |
| 157 | 158 | 0.01 | 223 | 224 | 0.11 | 247 | 248 | 0.01 | 270 | 271 | 0.01 |
| 158 | 159 | 0.01 | 224 | 225 | 0.06 | 248 | 249 | 0.01 | 271 | 272 | 0.01 |
| 159 | 160 | 0.11 | 225 | 226 | 0.07 | 249 | 250 | 0.01 | 272 | 273 | 0.01 |
| 160 | 161 | 0.08 | 226 | 227 | 0.03 | 250 | 251 | 0.01 | 273 | 274 | 0.01 |
| 161 | 162 | 0.05 | 227 | 228 | 0.06 | 251 | 252 | 0.01 | 274 | 275 | 0.01 |
| 162 | 163 | 0.02 | 228 | 229 | 0.02 | 252 | 253 | 0.01 | 275 | 276 | 0.01 |
| 163 | 164 | 0.01 | 229 | 230 | 0.03 | 253 | 254 | 0.01 | 276 | 277 | 0.01 |
| 164 | 165 | 0.02 | 230 | 231 | 0.05 | 254 | 255 | 0.01 | 277 | 278 | 0.01 |
| 165 | 166 | 0.01 | 231 | 232 | 0.04 | 255 | 256 | 0.01 | 278 | 279 | 0.01 |
| 166 | 167 | 0.01 | 232 | 233 | 0.04 | 256 | 257 | 0.01 | 279 | 280 | 0.01 |
| 167 | 168 | 0.01 | 233 | 234 | 0.03 | 257 | 258 | 0.01 | 280 | 281 | 0.01 |
| 168 | 169 | 0.01 | 234 | 235 | 0.05 | 258 | 259 | 0.01 | 281 | 282 | 0.01 |
| 169 | 170 | 0.01 | 235 | 236 | 0.03 | 259 | 260 | 0.01 | 282 | 283 | 0.01 |
| 170 | 171 | 0.01 | 236 | 237 | 0.03 | 260 | 261 | 0.01 | 283 | 284 | 0.01 |
| 171 | 172 | 0.01 | 237 | 238 | 0.03 | 261 | 262 | 0.01 | 284 | 285 | 0.01 |
| 21BNRD057 -CONTINUED | |||||||||||
| mFrom | mTo | Au g/t | mFrom | mTo | Au g/t | mFrom | mTo | Au g/t | mFrom | mTo | Au g/t |
| 285 | 286 | 0.01 | 322 | 323 | 0.01 | 358 | 359 | 0.04 | 392.6 | 393.2 | 3.63 |
| 286 | 287 | 0.01 | 323 | 324 | 0.01 | 359 | 360.01 | 0.01 | 393.2 | 393.75 | 2.76 |
| 287 | 288 | 0.01 | 324 | 325 | 0.01 | 360.01 | 361.1 | 0.01 | 393.75 | 394.4 | 19.4 |
| 288 | 289 | 0.01 | 325 | 326 | 0.01 | 361.1 | 362 | 0.01 | 394.4 | 395.05 | 1.05 |
| 289 | 290 | 0.01 | 326 | 327 | 0.02 | 362 | 363 | 0.01 | 395.05 | 395.45 | 39.1 |
| 290 | 291 | 0.01 | 327 | 328 | 0.01 | 363 | 364 | 0.01 | 395.45 | 396.05 | 23.3 |
| 291 | 292 | 0.01 | 328 | 329 | 0.01 | 364 | 365 | 0.07 | 396.05 | 396.65 | 3.3 |
| 292 | 293 | 0.01 | 329 | 330 | 0.01 | 365 | 366 | 0.02 | 396.65 | 397 | 0.77 |
| 293 | 294 | 0.01 | 330 | 331 | 0.02 | 366 | 367 | 0.01 | 397 | 398 | 0.25 |
| 294 | 295 | 0.01 | 331 | 332 | 0.01 | 367 | 368.17 | 0.01 | 398 | 399 | 0.32 |
| 295 | 296 | 0.01 | 332 | 333 | 0.01 | 368.17 | 369.1 | 0.05 | 399 | 400.3 | 0.1 |
| 296 | 297 | 0.01 | 333 | 334 | 0.01 | 369.1 | 370 | 0.01 | 400.3 | 401 | 0.19 |
| 297 | 298 | 0.01 | 334 | 335 | 0.01 | 370 | 370.8 | 0.01 | 401 | 402 | 0.05 |
| 298 | 299 | 0.01 | 335 | 336 | 0.01 | 370.8 | 371.6 | 0.03 | 402 | 402.9 | 0.04 |
| 299 | 300 | 0.01 | 336 | 337 | 0.01 | 371.6 | 371.95 | 0.04 | 402.9 | 403.9 | 0.08 |
| 300 | 301 | 0.01 | 337 | 338 | 0.01 | 371.95 | 373 | 0.01 | 403.9 | 404.7 | 0.18 |
| 301 | 302 | 0.01 | 338 | 339 | 0.01 | 373 | 374 | 0.01 | 404.7 | 405.5 | 0.05 |
| 302 | 303 | 0.01 | 339 | 339.5 | 0.01 | 374 | 375 | 0.01 | 405.5 | 406.6 | 0.02 |
| 303 | 304 | 0.01 | 339.5 | 340.2 | 0.01 | 375 | 376.05 | 0.01 | 406.6 | 407.75 | 0.01 |
| 304 | 305.3 | 0.01 | 340.2 | 341 | 0.01 | 376.05 | 377.2 | 0.01 | 407.75 | 408.85 | 0.01 |
| 305.3 | 306.5 | 0.01 | 341 | 342 | 0.01 | 377.2 | 378 | 0.01 | 408.85 | 410 | 0.01 |
| 306.5 | 307.54 | 0.01 | 342 | 343 | 0.01 | 378 | 379 | 0.01 | 410 | 410.9 | 0.02 |
| 307.54 | 308.79 | 0.01 | 343 | 343.93 | 0.01 | 379 | 380 | 0.01 | 410.9 | 411.8 | 0.01 |
| 308.79 | 310 | 0.01 | 343.93 | 345 | 0.01 | 380 | 381.1 | 0.01 | 411.8 | 412.7 | 0.01 |
| 310 | 311 | 0.01 | 345 | 346 | 0.01 | 381.1 | 381.75 | 0.01 | 412.7 | 413.3 | 0.01 |
| 311 | 311.4 | 0.01 | 346 | 347 | 0.01 | 381.75 | 382.75 | 0.51 | 413.3 | 414.1 | 0.01 |
| 311.4 | 312.23 | 0.02 | 347 | 347.53 | 0.01 | 382.75 | 383.2 | 0.2 | 414.1 | 415 | 0.01 |
| 312.23 | 313.21 | 0.01 | 347.53 | 348.41 | 0.01 | 383.2 | 384 | 0.2 | 415 | 416 | 0.01 |
| 313.21 | 314.15 | 0.01 | 348.41 | 349.54 | 0.01 | 384 | 384.8 | 0.12 | 416 | 417 | 0.01 |
| 314.15 | 315 | 0.01 | 349.54 | 350.61 | 0.01 | 384.8 | 385.35 | 0.63 | 417 | 418 | 0.01 |
| 315 | 315.54 | 0.01 | 350.61 | 351.08 | 0.01 | 385.35 | 386.15 | 0.29 | 418 | 419 | 0.01 |
| 315.54 | 316.45 | 0.01 | 351.08 | 352 | 0.01 | 386.15 | 387 | 0.05 | 419 | 419.75 | 0.01 |
| 316.45 | 317.21 | 0.01 | 352 | 353 | 0.01 | 387 | 388 | 0.14 | 419.75 | 420.5 | 0.01 |
| 317.21 | 318.3 | 0.01 | 353 | 353.8 | 0.01 | 388 | 389 | 0.06 | |||
| 318.3 | 319 | 0.01 | 353.8 | 355 | 0.01 | 389 | 390 | 0.01 | |||
| 319 | 320 | 0.01 | 355 | 356 | 0.01 | 390 | 391 | 0.02 | |||
| 320 | 321.25 | 0.01 | 356 | 357 | 0.01 | 391 | 392.15 | 0.06 | |||
| 321.25 | 322 | 0.02 | 357 | 358 | 0.08 | 392.15 | 392.6 | 0.58 | |||
Infographics accompanying this announcement are available at:
https://www.globenewswire.com/NewsRoom/AttachmentNg/e4032a55-75b8-43ec-9d3c-c1039aa463e7
https://www.globenewswire.com/NewsRoom/AttachmentNg/18d716b3-dda8-4aa1-964c-9ca95a2fea80
https://www.globenewswire.com/NewsRoom/AttachmentNg/4067470c-9352-48c2-bb28-3e0e0211a7b6
https://www.globenewswire.com/NewsRoom/AttachmentNg/7286cb3b-3ede-4b70-8b05-7c79d0873845
https://www.globenewswire.com/NewsRoom/AttachmentNg/2d8412a9-0ec4-4630-8125-1a6966a9a314
https://www.globenewswire.com/NewsRoom/AttachmentNg/49c43a4f-3be7-4b2e-a279-3e4818da7300
https://www.globenewswire.com/NewsRoom/AttachmentNg/b86c32b9-c4d8-46ea-80b3-54c070033721
https://www.globenewswire.com/NewsRoom/AttachmentNg/b295d282-d719-474d-9e96-60a21518e3a6
https://www.globenewswire.com/NewsRoom/AttachmentNg/09c14a38-6a91-4705-80d5-294621dbe23f
https://www.globenewswire.com/NewsRoom/AttachmentNg/66487043-b428-4970-9ee9-028552bc8dc5
https://www.globenewswire.com/NewsRoom/AttachmentNg/7d42c114-940b-478f-a220-3444e05e31a4
https://www.globenewswire.com/NewsRoom/AttachmentNg/96919839-34ac-44e0-ad46-19348b94f9b8
https://www.globenewswire.com/NewsRoom/AttachmentNg/037e9143-e60b-49c7-819d-c5496397c1ca

![]()
Figure 1
Murchison Exploration Phase 1 and Phase 2 Target Areas
Figure 2
Phase 2 drilling completed for NOA group, showing anomalous intercepts in DD (yellow boxes) and previously reported RC results (white boxes). All intercepts are downhole widths.
Figure 3
Phase 2 drilling completed for New Alliance target, showing anomalous RC intercepts previously reported.
Figure 4
NOA Group Long Section Looking West showing recent and historic drilling (Drillhole ID is grey font) with pierce point locations of the primary intercepts shown in bold. RC drilling significant intercepts are shown in white boxes and DD significant intercepts are shown in yellow boxes. All intercepts are downhole widths.
Figure 5
Visible gold sighted in RC hole 21BNRC050 at 219m downhole at NOA 1.
Figure 6
NOA 1 cross-section 7010000mN (AA1) ±100m looking North showing Phase 2 anomalous intercepts in recent RC drilling previously reported (white boxes) and anomalous intercepts in DD drilling (yellow boxes) falling within the clipping distance of the section. Historic drillholes (white boxes with grey font for drillhole IDs). All intercepts are downhole widths.
Figure 7
Isometric view looking south of NOA 2 showing fault planes truncating mineralization in 22BNRD001 and 22BNRD002.
Figure 8
NOA 4-6 cross-section 7010930mN (BB1) ±100m looking North showing Phase 2 DD drilling completed; anomalous intercepts in recent DD drilling (yellow boxes) and anomalous intercepts in historic drilling (white boxes). All intercepts are downhole widths.
Figure 9
NOA 7/8 cross-section 7011700mN (CC1) ±200m clipping looking North showing Phase 2 drilling completed within the clipping window, anomalous intercepts in recent DD drilling (yellow boxes) and anomalous intercepts in historic drilling (white boxes)
Figure 10
Picture of 21BNRD057 core showing intercepted mineralized package of highly deformed and altered sediments, mafic with minor fine-grained felsic rocks consistent with NOA Shear Zone.
Figure 11
Local geology and mineralization trend of the Gabanintha historic pits
Figure 12
Interpretive cross section of the Gabanintha pits showing historic drill intercept results
Figure 13