Perseus Mining Updates Mineral Resources & Ore Reserves
PERTH, Western Australia, Aug. 24, 2021 (GLOBE NEWSWIRE) -- Perseus Mining Limited (ASX/TSX: PRU) wishes to update the estimates of the Mineral Resources and Ore Reserves at each of its West African operations as outlined in Table 1 and Table 2 below. The report with JORC tables is available for download from www.perseusmining.com and www.asx.com.au.
Table 1: Perseus Mining Mineral Resources – 30 June 2021 1,2,4
| Project | Measured Resources | Indicated Resources | Measured & Indicated Resources | Inferred Resources | ||||||||
| Quantity | Grade | Gold | Quantity | Grade | Gold | Quantity | Grade | Gold | Quantity | Grade | Gold | |
| Mt | g/t gold | ‘000 oz | Mt | g/t gold | ‘000 oz | Mt | g/t gold | ‘000 oz | Mt | g/t gold | ‘000 oz | |
| Edikan | 24.8 | 1.01 | 803 | 46.1 | 1.03 | 1,522 | 70.9 | 1.04 | 2,326 | 5.6 | 1.6 | 300 |
| Sissingué 3 | 6.2 | 1.52 | 300 | 1.6 | 2.02 | 107 | 7.8 | 1.62 | 407 | 0.2 | 1.8 | 13 |
| Yaouré | 0.5 | 0.95 | 14 | 50.9 | 1.34 | 2,196 | 51.3 | 1.34 | 2,209 | 47 | 1.1 | 1,730 |
| TOTAL | 31.4 | 1.11 | 1,118 | 98.6 | 1.21 | 3,825 | 130.0 | 1.18 | 4,942 | 53.3 | 1.2 | 2,040 |
Table 2: Perseus Mining Ore Reserve – 30 June 20211,4
| Project | Proved | Probable | Proved and Probable | |||||||
| Quantity | Grade | Gold | Quantity | Grade | Gold | Quantity | Grade | Gold | ||
| Mt | g/t gold | ‘000 oz | Mt | g/t gold | ‘000 oz | Mt | g/t gold | ‘000 oz | ||
| Edikan | 14.1 | 1.06 | 480 | 22.3 | 1.17 | 837 | 36.4 | 1.13 | 1,318 | |
| Sissingué 3 | 4.9 | 1.61 | 254 | 0.9 | 2.32 | 70 | 5.9 | 1.72 | 324 | |
| Yaouré | 0.5 | 0.95 | 14 | 29.2 | 1.72 | 1,618 | 29.6 | 1.71 | 1,632 | |
| TOTAL | 19.4 | 1.20 | 749 | 52.5 | 1.50 | 2,525 | 71.9 | 1.42 | 3,274 | |
Notes for Tables 1 and 2:
- Refer to Notes to individual tables of Mineral Resources and Ore Reserves in respect of each project presented below.
- Mineral Resources are inclusive of Ore Reserves
- Sissingué Mineral Resources and Ore Reserves include the Fimbiasso and Bagoé Projects in addition to the Sissingué Gold Mine
- The Company holds 90% of Edikan Gold Mine (EGM), 86% of Sissingué Gold Mine (SGM) and 90% of Yaouré Gold Project (YGP) after allowing for Government equity
MINERAL RESOURCE ESTIMATES
The Mineral Resource estimates are reported in accordance with the 2012 Australasian Code for Reporting of Exploration Results, Mineral Resources and Ore Reserves (the JORC Code). The classification categories of Measured, Indicated and Inferred under the JORC Code are equivalent to the CIM categories of the same names (CIM, 2014).
YAOURÉ GOLD MINE, CÔTE D’IVOIRE
The CMA open pit and Heap Leach Mineral Resources have been depleted to 30 June 2021 surveyed mining surfaces. The Company confirms that there have been no other material changes to estimates of Yaouré and CMA deposits open pit or Heap Leach Mineral Resources and readers are referred to ASX release “Perseus Mining Updates Mineral Resources and Ore Reserves” dated 28 August 2019 and the notes contained therein.
In respect of the estimate of Mineral Resources that might be exploited by underground mining, readers are referred to ASX release “Perseus Mining Completes Scoping Study for Potential Underground Mine at Yaouré” dated 5 November 2018 and the notes contained therein. The Company confirms that it is not aware of any information that would result in a material change to that estimate. The underground Inferred Mineral Resource quoted in Table 4 is additional to the open pit Mineral Resources, being located below the US$1,800 pit shell that constrains the June 2019 estimate.
Estimates of Mineral Resources in satellite deposits at Yaouré are new and information provided in the following notes and in Appendix 1 applies.
Estimated Measured and Indicated Mineral Resources total 51.3 Mt grading 1.34 g/t gold, containing 2,210 kozs of gold. A further 47 Mt of material grading 1.1 g/t gold and containing a further 1,730 kozs of gold are classified as Inferred Resources. Details of these estimates are shown below in Table 3 and Table 4.
Table 3: Yaouré Measured and Indicated Mineral Resources – 30 June 2021 7, 8, 9
| Deposit | Deposit Type | Measured Resources | Indicated Resources | Measured & Indicated Resources | ||||||
| Quantity | Grade | Gold | Quantity | Grade | Gold | Quantity | Grade | Gold | ||
| Mt | g/t gold | ‘000 oz | Mt | g/t gold | ‘000 oz | Mt | g/t gold | ‘000 oz | ||
| CMA 1, 2, 3, 5 | Open Pit | - | - | - | 26.6 | 1.80 | 1,536 | 26.6 | 1.80 | 1,536 |
| Yaouré 1, 2, 3, 5 | Open Pit | - | - | - | 18.8 | 0.80 | 483 | 18.8 | 0.80 | 483 |
| Satellite deposits 4, 5 | Open Pit | - | - | - | 5.1 | 1.03 | 168 | 5.1 | 1.03 | 168 |
| Sub Total | - | - | - | 50.5 | 1.35 | 2,188 | 50.5 | 1.35 | 2,188 | |
| Heap Leach2, 6 | Stockpile | 0.4 | 0.61 | 8 | 0.4 | 0.61 | 8 | |||
| Stockpiles | Stockpile | 0.5 | 0.95 | 14 | - | - | - | 0.5 | 0.95 | 14 |
| TOTAL | 0.5 | 0.95 | 14 | 50.9 | 1.34 | 2,196 | 51.3 | 1.34 | 2,210 | |
Notes:
- Based on June 2019 Mineral Resource estimate.
- Depleted for previous mining and to 30 June 2021 mining surface.
- 0.4g/t gold cut-off applied to in situ open pit material.
- Based on Angovia 2 April 20201 and Govisou May 2021 Mineral Resource models
- In situ open pit resources constrained to US$1,800/oz pit shells
- Heap leach resources are stated at 0g/t gold cut-off; only heap components with average grade above 0.4g/t included.
- Mineral Resources current at 30 June 2021.
- Measured and Indicated Mineral Resources are inclusive of Ore Reserves.
- Rounding of numbers to appropriate precisions has resulted in apparent inconsistencies.
Table 4: Yaouré Inferred Mineral Resources – 30 June 2021 7, 8
| Deposit | Deposit Type | Inferred Resources | ||
| Quantity | Grade | Gold | ||
| Mt | g/t gold | ‘000 oz | ||
| CMA 1, 2, 3, 5 | Open Pit | 11 | 1.1 | 400 |
| Yaouré 1, 2, 3, 5 | Open Pit | 33 | 0.9 | 900 |
| Satellite deposits 4, 5 | Open Pit | 1 | 0.9 | 40 |
| CMA 6 | Underground | 1.8 | 6.1 | 350 |
| Total | 47 | 1.1 | 1,730 | |
Notes:
- Based on June 2019 Mineral Resource estimate.
- Depleted for previous mining and to 30 June 2021 mining surface.
- 0.4g/t gold cut-off applied to in situ open pit material.
- Based on Angovia 2 April 20201 and Govisou May 2021 Mineral Resource models.
- In situ open pit resources constrained to US$1,800/oz pit shells.
- May 2018 Mineral Resource estimate, CMA Footwall Lode 1 only, below US$1,800 pit shell and base of weathering, above 2g/t block grade cut-off.
- Mineral Resources current at 30 June 2021.
- Rounding of numbers to appropriate precisions has resulted in apparent inconsistencies.
GEOLOGY
Govisou and Angovia 2 deposits are hosted by Palaeoproterozoic Birimian Supergroup rocks of the Bouaflé Greenstone Belt.
Govisou gold deposit is hosted by a diorite intrusion surrounded by metabasalts. Mineralisation is thought to be associated with both NE and NW striking, subvertical structures but forms a diffuse volume that is almost circular in plan view, about 90m in diameter and plunging at about 60 degrees toward the NNW. Gold is associated with low concentrations of fine-grained disseminated pyrite and phengite alteration. Quartz veining is rare.
Angovia 2 deposit comprises gold mineralisation associated with pyrite disseminations and veinlets hosted in chlorite-carbonate-silica altered metabasalts. The deposit strikes E-W in an anastomosing shear zone and extends over about 550m strike, with mineralisation controlled by brittle-ductile shears that mainly dip south at 50-60 degrees. Subsidiary north-dipping structures also appear to occur.
DRILLING TECHNIQUES
The Govisou resource is delineated by regular drilling at 20m x 20m X-Y spacing in holes dipping at -45 degrees toward 135 degrees azimuth. Drill coverage generally extends to about 100m vertical depth and to a maximum of about 140m maximum depth.
Data available to inform the Govisou resource estimate include:
- 330m of RC drilling in 3 holes completed by Amara Mining plc in 2015;
- 6,908m of RC drilling in 76 holes completed by Perseus Mining in 2020-2021;
- 862m of diamond core drilling in 4 holes drilled by Perseus Mining in 2017 and 2020.
All RC drilling by Amara and Perseus used face-sampling hammers. Diamond core drilling used HQ diameter core and triple-tube equipment to maximise core recoveries in weathered materials. Seventeen per cent of core was HQ diameter; 83% was NQ diameter.
The Angovia 2 resource is delineated by drilling on 25m spaced traverses (X) with hole spacing generally at 20m on traverses (Y). Because of historic drill patterns, the central part of the deposit has partial infill drilling on 15m spaced traverses.
Data available to inform the Angovia 2 resource estimate include:
- 6,883m of RC drilling in 90 RC holes drilled by Cluff Mining plc in 2006-2007;
- 2,267m of RC drilling in 18 holes drilled by Amara mining plc in 2012-2014;
- 1,055m of diamond core drilling completed by Amara mining in 2012;
- 7,235m of RC drilling in 107 holes completed by Perseus Mining in 2020-2021;
- 1,652m of diamond core drilling completed by Perseus Mining in 2017-2021;
- 1,637m of RC grade control drilling in 69 vertical holes drilled by Perseus Mining in 2021.
All RC drilling by Cluff, Amara and Perseus used face-sampling hammers. Diamond core drilled by Amara was HQ diameter in weathered material and NQ diameter in fresh rock. All diamond core drilled by Perseus was HQ diameter, with triple-tube equipment used to maximise core recoveries in weathered materials.
SAMPLING
RC drill samples were collected at drill sites over generally 1m intervals and manually split using multi-stage riffle splitters to produce assay sub-samples averaging around 3kg. RC holes drilled by Perseus at Govisou during 2020-2021 had riffle splits of 1m samples composited to 2m for assay. All RC holes by Cluff, Amara and Perseus have been assayed in entirety.
Diamond core was generally sawn in half using a diamond blade saw, with one half sent for assaying and the other half stored in core trays for reference. Samples were normally taken at 1 metre intervals. All diamond drill core was assayed.
Preparation of core and RC samples followed a standard path of drying at 105 degrees C for at least 12 hours, crushing the entire sample to 85% passing -2mm and grinding a 1.5kg split to 85% passing 75 microns. 200g subsamples collected by multiple scoop passes were despatched to the assay laboratory.
At Govisou, 36% of samples informing the resource estimate underwent sample preparation at the Yaouré facility operated by Perseus. The remaining samples underwent sample preparation at commercial laboratories.
At Angovia 2, all RC and core samples informing the resource estimate underwent sample preparation variously at the Yaouré facility operated at various times by Cluff, Amara and Perseus or at commercial assay laboratories.
SAMPLE ANALYTICAL METHODS
At Govisou, all RC and diamond core samples have been assayed by 50g fire assay with AAS determination by commercial laboratories.
At Angovia 2, samples from Cluff RC holes, comprising about 33% of samples available to inform the resource estimate, were assayed by 500g cyanide leach by Abilab, Ouagadougou, part of the ALS Laboratory Group. Samples from Amara’s 2012 RC drilling campaign, comprising 11% of samples informing the resource estimate, were assayed at Yaouré using cyanide leach. Remaining samples from RC drilling by Perseus and core drilling by both Amara and Perseus were assayed by 50g fire assay with AAS finish.
ESTIMATION METHODOLOGY – OPEN PIT MINERAL RESOURCES
Resources were estimated by Multiple Indicator Kriging (MIK) of two metre down-hole composited gold grades from RC and diamond drilling.
At Angovia 2, selected pre-production grade control RC holes were included in the estimation dataset in areas of limited resource sampling in the northern, near-surface portion of the deposit.
Mineralised domains used for resource estimation delineate zones within which the tenor and spatial trends of mineralisation are similar. Sample data were also separated into sub-domains representing weathering horizons using surfaces provided by Perseus. Grade continuity was characterised by indicator variograms modelled at 14 indicator thresholds.
At Govisou, class grades were derived from class mean grades with the exception of upper bin grades which we derived from class medians.
At Angovia 2, upper bin grades were generally derived from the class median or, less commonly, the lower of two values within the bin or bin threshold.
The above approaches to treatment of high grades reduces the impact of small numbers of extreme grades on estimates of resources.
At Govisou, resources were estimated into panels in a 45-degree rotated grid with dimensions 20m x 20m x 5m (X, Y, Z).
At Angovia 2, resources were estimated into panels with dimensions 25m x 25m x 5m (X, Y, Z), approximating the overall spacing of drill holes in the deposit.
The estimates include variance adjustments to provide estimates of recoverable resources expected to be recoverable by open pit mining on the scale presently practiced at Yaouré and given high quality grade control sampling.
CRITERIA FOR RESOURCE CLASSIFICATION
Govisou estimates were classified as Indicated and Inferred. Indicated resources are confined to areas 20m x 20m drill coverage, with Inferred estimates in more broadly sampled mineralisation. Inferred panels generally extend to a maximum of around 25m from drilling.
Angovia 2 estimates were classified as Indicated and Inferred. Indicated resources are thus confined to areas drilled at around 25m and closer, with Inferred estimates in more broadly sampled mineralisation. Inferred panels generally extend to a maximum of around 25m from drilling.
CUTOFF GRADE
The cut-off grade of 0.4g/t Au for the stated open pit Mineral Resource estimates reflects the average break-even cut-off grade that derives from cost and revenue parameters in the Yaouré Life-of-Mine plan and a gold price of US$1,800/oz.
REASONABLE PROSPECTS FOR EVENTUAL ECONOMIC EXTRACTION
Mineral resources are reported within optimal pit shells generated using cost and revenue parameters in the Yaouré Life-of-Mine plan and a gold price of US$1,800/oz.
STOCKPILES
Mineral Resources contained in stockpiles are based on volume estimates based on ground survey data, loose bulk densities derived over time by reconciliation of volumes mined (at in situ densities) to stockpile movements and volumes and estimates of stockpile grades based on predicted grades of mined material transferred onto stockpiles and material depleted by processing.
Closing Yaouré stockpiles at 30 June 2021 were estimated as shown in Table 5.
Table 5: Yaouré Closing Stockpiles – 30 June 2021 1
| Material | Quantity tonnes | Grade g/t gold | Gold ounces |
| Low grade oxide | 335,422 | 0.66 | 7,097 |
| Low grade transition | 20,643 | 0.74 | 491 |
| Medium grade oxide | 20,027 | 1.42 | 917 |
| High grade fresh | 59,990 | 2.32 | 4,475 |
| Crushed ore stockpile | 14,826 | 1.74 | 829 |
| Total | 450,907 | 0.95 | 13,808 |
Notes:
- Stockpile tonnage and grade estimates are considered sufficiently accurate to support their classification as Measured Mineral Resources.
SISSINGUÉ GOLD MINE, CÔTE D’IVOIRE
Sissingué Mineral Resources comprise three components:
- Remaining in situ mineralisation at the Sissingué mine;
- In situ mineralisation at the Fimbiasso East and West deposits;
- In situ mineralisation at the Antoinette, Juliette, and Veronique deposits at Bagoé Project; and
- Material on stockpiles at Sissingué mine at 30 June 2021.
The in situ Mineral Resources at each of the deposits listed is potentially exploitable by open pit mining methods.
Mineral Resources estimates at the Sissingué Gold Mine have updated using additional drilling undertaken in 2020-2021 and a new constraining pit shell generated using updated Sissingué mining and processing costs. The new model has been depleted to the 30 June 2021 surveyed mining surface. The information provided in Appendix 3 pertains.
Estimates of Mineral Resources for the Fimbiasso deposits were updated in March 2020 and the information provided in ASX release “Perseus Mining Updates Mineral Resources and Ore Reserves” dated 26 August 2020 and the notes contained therein pertain. Those estimates have been updated by new constraining pit shells generated using updated estimates of mining costs and Sissingué processing costs. The Company confirms that there have been no other material changes to estimates of Fimbiasso Mineral Resources.
Estimates of Mineral Resources at Bagoé are new and information provided in the following notes and in Appendix 2 applies.
The combined global Measured and Indicated Mineral Resource for the SGM is estimated as 7.8 Mt grading 1.62 g/t gold, containing 407 kozs of gold. A further 0.2 Mt of material grading 1.8g/t gold, containing a further 13 kozs of gold are classified as Inferred Mineral Resources. Details of these estimates are shown below in Tables 6 and 7.
Table 6: Sissingué Measured and Indicated Mineral Resources – 30 June 2021 8, 9, 10
| Deposit | Deposit Type | Measured Resources | Indicated Resources | Measured & Indicated Resources | ||||||
| Quantity | Grade | Gold | Quantity | Grade | Gold | Quantity | Grade | Gold | ||
| Mt | g/t gold | ‘000 oz | Mt | g/t gold | ‘000 oz | Mt | g/t gold | ‘000 oz | ||
| Sissingué 1, 2, 3 | Open Pit | 2.6 | 1.23 | 102 | 0.2 | 1.36 | 11 | 2.8 | 1.24 | 113 |
| Fimbiasso 4, 5 | Open Pit | 1.7 | 1.69 | 95 | 0.4 | 1.78 | 23 | 2.1 | 1.71 | 118 |
| Bagoé 6, 7 | Open Pit | 0.7 | 2.24 | 53 | 1.0 | 2.28 | 73 | 1.7 | 2.26 | 126 |
| Stockpiles | Open Pit | 1.1 | 1.44 | 51 | 1.1 | 1.44 | 51 | |||
| TOTAL | 6.2 | 1.52 | 300 | 1.6 | 2.02 | 107 | 7.8 | 1.62 | 407 | |
Notes:
- Based on July 2021 Mineral Resource model constrained to US$1,800/oz pit shell.
- Depleted to 30 June 2021 mining surface.
- 0.6g/t gold cut-off applied to in situ material.
- Based on March 2020 Mineral Resource models constrained to US$1,800/oz pit shells.
- 0.8g/t gold cut-off applied.
- Based on May 20201 Mineral Resource models constrained to US$1,800/oz pit shells.
- 0.8g/t gold cut-off applied to oxide, 1g/t applied to transition, 1.2g/t applied to fresh (Veronique deposit only).
- Mineral Resources current at 30 June 2021.
- Measured and Indicated Mineral Resources are inclusive of Ore Reserves.
- Rounding of numbers to appropriate precisions may have resulted in apparent inconsistencies.
Table 7: Sissingué Inferred Mineral Resources – 30 June 2021 8, 9
| Deposit | Deposit Type | Inferred Resources | ||
| Quantity | Grade | Gold | ||
| Mt | g/t gold | ‘000 oz | ||
| Sissingué 1, 2, 3 | Open Pit | 0.03 | 0.8 | 1 |
| Fimbiasso 4, 5 | Open Pit | 0.1 | 1.8 | 6 |
| Bagoé 6, 7 | Open Pit | 0.1 | 2.2 | 6 |
| TOTAL | 0.2 | 1.8 | 13 | |
Notes:
- Based on July 2021 Mineral Resource model constrained to US$1,800/oz pit shell.
- Depleted to 30 June 2021 mining surface.
- 0.6g/t gold cut-off applied to in situ material.
- Based on March 2020 Mineral Resource models constrained to US$1,800/oz pit shells.
- 0.8g/t gold cut-off applied.
- Based on May 20201 Mineral Resource models constrained to US$1,800/oz pit shells.
- 0.8g/t gold cut-off applied to oxide, 1g/t applied to transition, 1.2g/t applied to fresh (Veronique deposit only).
- Mineral Resources current at 30 June 2021.
- Rounding of numbers to appropriate precisions may have resulted in apparent inconsistencies.
GEOLOGY
The Bagoé Gold Project is located in the West African Craton and covers Palaeoproterozoic (Birimian) rocks of the southern extension of the Syama Greenstone Belt and the western margin of the Senoufo Greenstone Belt. Gold deposits at Bagoé are of the orogenic, greenstone-hosted type. Exploration has located several gold occurrences, including the Antoinette and Juliette, probably located within the Syama Belt, and Veronique, located within the Senoufo Belt. Mineral Resources have been delineated at Antoinette, Juliette, and Veronique deposits.
Antoinette gold deposit is hosted by a fine-grained, siliceous and, in places, carbonaceous metasediment unit within a sequence of felsic volcaniclastic rocks and porphyritic dioritic dykes. Mineralisation is subvertical, extends over about 800m strike, with three principal mineralised zones that very from 5m to 45m in width. Weathering extends to 50-60m depth.
Juliette gold deposit is located 3.5km SW of Antoinette and is hosted by the extension of the Antoinette sequence/structure. Mineralisation is subvertical, extends over about 470m strike and generally comprises a single lens 5-15m wide. Weathering extends to 30-40m depth.
Veronique gold deposit is located 16km SSE of Antoinette. Mineralisation extends over 800m strike and generally comprises a single NW-striking quartz vein 1-2m thick that dips at 45 degrees to the SW. The vein is hosted by an extensive granodiorite stock. Alteration selvages extending 2-3m either side of the vein result, in places, in 6-8m true thickness of mineralisation. Weathering extends to 50-60m depth.
At Antoinette and Juliette, gold is associated with veinlets and disseminations of pyrite and arsenopyrite. Cyanide leach testwork indicates that gold is partially refractory in materials below the base of oxidation.
At Veronique, gold occurs as native gold and in association with small quantities of pyrite. Cyanide leach testwork indicates high gold recoveries from fresh rock material.
DRILLING TECHNIQUES
Antoinette, Juliette and Veronique deposits have been delineated by air core (AC), reverse circulation (RC) and diamond core drilling.
Antoinette deposit has been drilled on 25m spaced traverses with holes generally spaced at 20m. Most holes were drilled at -60 degrees toward 315 degrees azimuth, perpendicular to the strike of mineralisation.
Juliette deposit has been drilled on 25m spaced traverses with holes mostly spaced at 20m. Holes were drilled at -55 degrees toward 315 degrees azimuth, perpendicular to the strike of mineralisation.
Veronique has been drilled at nominal 20m x 20m X-Y spacing with holes drilled at -60 degrees toward 045 degrees azimuth, orthogonal to mineralisation.
The data type, spacing and distribution are considered sufficient to establish estimates of Mineral Resources.
SAMPLING
For all AC and RC holes informing the resource estimates, samples were collected at 1m intervals and split at drill sites using a multi-stage riffle splitter to produce sub-samples weighting 2-3kg. Exploration AC holes assayed in 4m composites were not used to inform the resource estimates.
Diamond core was sawn in half using a diamond blade saw, with the right half sent for assaying and the left half stored in core trays for reference. Core was sampled in 1m intervals or to geological contacts
AC, RC and core samples were securely transported to Perseus’s sample preparation facility at Yaouré Gold Mine where they were dried, crushed to 2mm and a 1kg riffle split portion pulverised to 90% passing 75 microns. Pulps were mixed on a rolling mat (“carpet roll”), and then 200 g of sub-sample was selected by multiple dips of a spatula and packaged in a kraft paper packet.
Sample condition (dry, damp, wet) and a qualitative description of sample quality (high, moderate, low) were logged for AC and RC holes. Eighty-eight samples logged as wet were culled from the data used to inform the resource estimate at Antoinette.
For RC samples and samples from AC holes drilled for resource definition, the weight of each entire recovered 1m sample was recorded. At Antoinette and Juliette, AC and RC sample recoveries averaged 90%. At Veronique, AC and RC sample recoveries averaged 80%. There is no apparent relationship between sample recovery and gold grades in AC and RC drill holes.
Recovered lengths of diamond core were measured for each drill run. Average core recoveries at Antoinette ranged from 85% in upper saprolite to 100% in fresh rock. At Veronique, core recoveries averaged 80% in upper saprolite to 99% in fresh rock. No diamond core holes have been drilled at Juliette. There is no apparent relationship between core recovery and gold grades in diamond drill holes.
Sampling precision was monitored by inclusion of 1:20 duplicate field splits for AC and RC samples. Additionally, duplicate pulps were created for 1:20 samples of all types.
The drill hole samples are considered appropriate and representative.
SAMPLE ANALYTICAL METHODS
Samples were assayed by Bureau Veritas in Abidjan using 50g fire assay with AAS finish for gold only. The technique is considered a measure of total gold.
QUALITY ASSURANCE AND QUALITY CONTROL
Assay accuracy and reliability were monitored by insertion of blanks at 1:20 samples and reference standards (CRMs) at 1:20 samples.
The performances of blanks and standards were monitored as assay results were received.
Intervals of significant gold grades were compared to logging of quartz veining, alteration and mineralisation and chip tray photographs.
Assays were plotted on cross-sections to check that significant intercepts conform to the expected locations of mineralisation and make geometric sense.
Five diamond core holes have been drilled at Veronique and six at Antoinette to twin RC holes previously drilled by Exore Resources. Intercept widths and grades compare to those in RC holes to within acceptable tolerances.
The QAQC data show acceptable precision and no significant bias. Overall assaying quality is considered adequate to support estimates of Mineral Resources.
ESTIMATION METHODOLOGY – OPEN PIT MINERAL RESOURCES
Recoverable resources were estimated using Multiple Indicator Kriging (MIK) with block support adjustment.
Sample intervals were composited to 2 m down-hole lengths and 3D wireframes developed that delineate mineralisation volumes at approximately 0.2g/t Au threshold. Interpretation of model domains was supported by geological interpretations and weathering interface surfaces provided by Perseus.
At each deposit, MIK estimates were performed into panels based on the approximate average spacings of drill holes available to inform the estimates and considering the proposed open pit mining method:
- Antoinette: 15mE x 25mN x 5mRL;
- Juliette: 20mE x 25mN x 5mRL; and
- Veronique: 20mE x 10mN x 5mRL.
A local grid with grid north toward 045 degrees was applied at all deposits.
A three-pass search strategy was employed for estimation. At Antoinette and Juliette (in local grid orientation):
- Pass 1: 10mE x 25mN x 20mRL, minimum 16 data in at least 4 octants, maximum 48 data;
- Pass 2: 13mE x 32.5mN x 26 mRL, minimum 16 data in at least 4 octants, maximum 48 data; and
- Pass 3: 13mE x 32.5mN x 26 mRL, minimum 8 data in at least 2 octants, maximum 48 data.
No rotation of search ellipsoid.
At Veronique:
- Pass 1: 20mE x 20mN x 5mRL, minimum 16 data in at least 4 octants, maximum 48 data;
- Pass 2: 26mE x 26mN x 6.5mRL, minimum 16 data in at least 4 octants, maximum 48 data;
- Pass 3: 26mE x 26mN x 6.5mRL, minimum 8 data in at least 2 octants, maximum 48 data; and
Search ellipsoid rotated -50 degrees about the Y-axis to conform to the dip of mineralisation.
All indicator class grades used for estimation were derived from the class means with the exception of the upper bin grades for which the class medians were applied for most domains. The approach limits the impact of small numbers of very high-grade samples, similar to top cutting high grades.
Average densities were applied to each of five weathering sub-domains based on density measurements of drill core samples and density data from Sissingué mine where a similar weathering profile exists.
Block support adjustments were applied assuming a mining selectivity of 3m x 8m x 2.5m (across strike, along strike, vertical) and grade control sample spacing of 5m x 8m x 1m (along strike, across strike, downhole). The recoverable resource estimates can be reasonably be expected to provide reliable estimates of potential open pit mining outcomes at the assumed selectivity without application of additional mining dilution or recovery factors.
CRITERIA FOR RESOURCE CLASSIFICATION
The resource estimates have been classified as Measured, Indicated and Inferred Resources in accordance with the 2012 Australasian Code for Reporting of Mineral Resources and Ore Reserves (JORC Code) and the CIM Definition Standards (CIM, 2011) based on the drill hole spacing at each of the deposits and on satisfaction of the estimation search criteria described above. The approach reflects the reasonable view that Category 1 and 2 blocks are surrounded by data in close proximity and can properly be considered Measured and Indicated, respectively. Category 3 blocks may occur on the peripheries of drilling but are still related to drilling data within reasonable distances and are included in the Mineral Resource as Inferred.
The Veronique estimate does not include any Measured resource because although the mineralised structure is demonstrably continuous, gold grades within the lode are highly variable.
CUTOFF GRADE
Cut-off grades of 0.8 and 1g/t have been applied to oxide and transition materials respectively, based on estimates mining, ore transport and processing costs, the expected metallurgical performances of the various material types and a gold price of US$1,800/oz. A cut-off grade of 1.2g/t has been applied to fresh rock material at Veronique only.
Resource estimates for Antoinette and Juliette exclude sulphide material
REASONABLE PROSPECTS FOR EVENTUAL ECONOMIC EXTRACTION
Mineral resources are reported within optimal pit shells generated using estimates of mining, ore transport and processing costs, the expected metallurgical performances of the various material types and a gold price of US$1,800/oz.
STOCKPILES
Mineral Resources contained in stockpiles are based on volume estimates based on ground survey data, loose bulk densities derived over time by reconciliation of volumes mined (at in situ densities) to stockpile movements and volumes and estimates of stockpile grades based on predicted grades of mined material transferred onto stockpiles and material depleted by processing.
Closing Sissingué stockpiles at 30 June 2021 were estimated as shown in Table 8.
Table 8: Sissingué Closing Stockpiles – 30 June 2021
| Material | Quantity tonnes | Grade g/t gold | Gold ounces |
| Low grade oxide | 157,203 | 0.68 | 3,455 |
| Low grade fresh | 373,302 | 1.31 | 15,689 |
| High grade fresh | 554,838 | 1.72 | 30,629 |
| Crushed ore stockpile | 15,811 | 2.36 | 1,200 |
| TOTAL | 1,101,154 | 1.44 | 50,973 |
Notes:
- Stockpile tonnage and grade estimates are considered sufficiently accurate to support their classification as Measured Mineral Resources.
EDIKAN GOLD MINE
Edikan’s Mineral Resources comprise four components:
- Remaining in situ mineralisation in the AF Gap, Esuajah North and Fetish deposits, each of which is exploitable by open pit mining methods;
- In situ mineralisation in the Esuajah South deposit, potentially exploitable by underground mining methods;
- Heap leach material remaining from the treatment of oxide mineralisation by previous mine operators; and
- Material on mine stockpiles at 30 June 2021.
The updated Measured and Indicated Mineral Resource for the Edikan Gold Mine in Ghana (“Edikan”) is now estimated as 70.9 Mt grading 1.02 g/t gold, containing 2,326 kozs of gold, as at 30 June 2021. A further 5.6 Mt of material grading 1.6 g/t gold and containing a further 300 kozs of gold are classified as an Inferred Mineral Resource. Details of the estimates are shown below in Table 9 and Table 10.
Edikan open pit Mineral Resources were last updated in June 2020 and readers are referred to ASX release “Perseus Mining Updates Mineral Resources & Ore Reserves” dated 26 August 2020. Mineral Resources at AF Gap and at Fetish have been depleted to 30 June 2021 mining survey surfaces. The Mineral Resource previously quoted for Bokitsi South deposit has been written off entirely; the pit is being backfilled with mine waste. The Company confirms that in all other respects it is not aware of any other information that would result in a material change to the estimates of remaining resources.
The Mineral Resource estimate for the Esuajah South deposit has been updated after additional drilling completed in late 2020. The notes below and the information provided in Appendix 4 pertain to that estimate.
The Heap Leach Mineral Resource has been depleted to the 30 June 2021 mine survey surface. The Company confirms that it is not aware of any information that would, in any other respect, result in a material change to the estimate of the Mineral Resource previously released and readers are referred to ASX release “Perseus Mining Updates Edikan Gold Mine’s Mineral Resource and Ore Reserve dated 21 February 2017 and the notes contained therein.
Table 9: Edikan Measured and Indicated Mineral Resources – 30 June 2021 8, 9, 10
| Deposit | Deposit Type | Measured Resources | Indicated Resources | Measured & Indicated Resources | ||||||
| Quantity | Grade | Gold | Quantity | Grade | Gold | Quantity | Grade | Gold | ||
| Mt | g/t gold | ‘000 oz | Mt | g/t gold | ‘000 oz | Mt | g/t gold | ‘000 oz | ||
| AF Gap 1, 2, 3 | Open Pit | 9.7 | 0.99 | 310 | 21.6 | 0.90 | 628 | 31.3 | 0.93 | 938 |
| Esuajah North 1, 2, 3,4 | Open Pit | 2.8 | 0.79 | 72 | 4.0 | 0.74 | 95 | 6.9 | 0.76 | 168 |
| Fetish 2, 3,5 | Open Pit | 6.2 | 0.97 | 194 | 11.7 | 0.93 | 348 | 17.9 | 0.94 | 542 |
| Sub Total | 18.8 | 0.95 | 577 | 37.3 | 0.89 | 1,071 | 56.1 | 0.91 | 1,648 | |
| Esuajah South 6 | U’ground | 3.1 | 1.70 | 168 | 5.9 | 2.09 | 393 | 8.9 | 1.95 | 561 |
| Heap Leach 2, 7 | Stockpile | - | - | - | 2.9 | 0.6 | 58 | 2.9 | 0.6 | 58 |
| Stockpiles | Stockpile | 2.9 | 0.63 | 59 | - | - | - | 2.9 | 0.63 | 59 |
| TOTAL | 24.8 | 1.01 | 803 | 46.1 | 1.03 | 1,522 | 70.9 | 1.02 | 2,326 | |
Notes:
- Based on March 2020 Mineral Resource model constrained to US$1,800/oz pit shell.
- Depleted to 30 June 2021 mining surfaces.
- 0.4g/t gold cut-off applied.
- Based on June 2019 Mineral Resource model constrained to US$1,800/oz pit shell.
- Based on January 2017 Mineral Resource model constrained to US$1,800 pit shell, includes Bokitsi North lode.
- Based on November 2020 Mineral Resource model, 1g/t gold cut-off applied.
- At zero cut-off grade.
- All Mineral Resources are current as at 30 June 2021.
- Measured and Indicated Mineral Resources are inclusive of Ore Reserves.
- Rounding of numbers to appropriate precisions may have resulted in apparent inconsistencies.
Table 10: Edikan Inferred Mineral Resources – 30 June 2021 7, 8
| Deposit | Deposit Type | Inferred Resources | ||
| Quantity | Grade | Gold | ||
| Mt | g/t gold | ‘000 oz | ||
| AF Gap 1, 2, 3 | Open Pit | 0.2 | 0.9 | 7 |
| Esuajah North 2, 3, 4 | Open Pit | 0.03 | 1.0 | 1 |
| Fetish 2, 3, 5 | Open Pit | 0.6 | 0.9 | 18 |
| Esuajah South 6,7 | Underground | 4.8 | 1.8 | 270 |
| Total | 5.6 | 1.6 | 300 | |
Notes:
- Based on March 2020 Mineral Resource model constrained to US$1,800/oz pit shell.
- Depleted to 30 June 2021 mining surfaces.
- 0.4g/t gold cut-off applied.
- Based on June 2019 Mineral Resource model constrained to US$1,800/oz pit shell.
- Based on January 2017 Mineral Resource model constrained to US$1,800 pit shell, includes Bokitsi North lode.
- Based on November 2020 Mineral Resource model, 1g/t gold cut-off applied.
- All Mineral Resources are current as at 30 June 2021.
- Rounding of numbers to appropriate precisions may have resulted in apparent inconsistencies.
GEOLOGY
The Edikan gold deposits occur near the western flank of the Ashanti Greenstone Belt in south-western Ghana. Mineralisation is hosted by Palaeoproterozoic aged rocks of the Birimian Supergroup. Structurally controlled gold mineralisation occurs in two principal modes: disseminated pyrite-arsenopyrite mineralisation associated with quartz veining and sericite alteration hosted by granitoids and shear-zone hosted mineralisation associated with pyrite-arsenopyrite mineralisation in and adjacent to quartz veins in deformed, fine-grained metasedimentary rocks. The strike lengths of the individual deposits range from approximately 300 metres (Esuajah South) to more than 2 kilometres (Abnabna-AF Gap-Fobinso). Granite-hosted mineralisation is developed over widths of up to 150 metres; shear hosted mineralisation in metasedimentary rocks is typically 10-30 metres wide. Resource definition drilling has defined mineralisation to depths ranging from approximately 130 metres to more than 550 metres (AF Gap, Esuajah South).
DRILLING TECHNIQUES
Esuajah South deposit is delineated by diamond core drilling on a nominal 20m E x 20mN (local grid) spacing in plan view. Holes are generally angled at -50° toward grid west to provide optimal intersections of the mineralisation. Two diamond core holes totalling 268m were drilled by Ashanti Goldfields Corporation (AGC) prior to 2006. A total of 131 holes totalling 39,892m (including 3,248m in 27 RC pre-collars) were drilled by Perseus between 2006 and 2011. A further 61 diamond core holes totalling 5,886m were drilled in August to October 2020 to infill the top 125m of the deposit to approximately 20m x 10m spacing in plan view.
Samples from RC holes drilled by AGC prior to 2006 have been excluded from sample data that inform the resource estimate.
Mineralisation is represented by 5,339 2m composites from diamond core samples and 109 2m composites from RC samples.
SAMPLING
Core was cut in half using a core saw. All samples were collected from the same side of the core.
Half core and RC sub-samples were despatched to commercial assay laboratories for sample preparation and assaying.
Sample preparation comprised drying, crushing the entire received sample to 2mm, then pulverising to 90% passing -75um.
SAMPLE ANALYTICAL METHODS
Of the 7,837 2m sample composites representing mineralisation, 7,596 derive from 50g fire assays with aqua regia digest finish, 167 derive from 1kg cyanide leach bottle roll assays and the assay method for 74 sample composites from the two core holes drilled by AGC is unknown.
Perseus’s quality assurance and quality control “QAQC” procedures included submission of field duplicates (RC only) inserted at 1 in 25, certified blanks inserted at 1 in 20, certified standards at 1 in 20, internal laboratory standards, duplicates and repeats.
ESTIMATION METHODOLOGY – ESUAJAH SOUTH MINERAL RESOURCE
The boundaries of the mineralised granite body were digitised on 20m spaced drill cross-sections and a 3D wireframe of the granite developed using Micromine software. Based on drill hole data and experience at other granitoid-hosted gold deposits at Edikan, the entire granite body is considered to comprise the mineralised domain.
Drill hole sample intervals were composited to uniform 2m down-hole lengths and all composites lying within the granite wireframe were selected to inform estimates of gold grade, i.e. a hard boundary approach was applied.
Experimental variogram models were calculated and fitted with models using MP3® software.
A parent block dimension of 10mN x 10mE x 10mRL was selected on the basis of being approximately 50% of average drill hole spacing in the better drilled portion of the deposit.
Gold grades were interpolated into parent blocks by Ordinary Kriging using MP3® software.
A three-pass search strategy was applied. First pass search radii were 30mN x 30mE x 10mRL, being approximately 1.5 x hole spacing, and requiring a minimum of 16 data in 4 octants. Search pass 2 applied an ellipsoid expanded by 50% in each direction, i.e. 45m x 45m x 15m and the same data constraints. Search pass 3 applied an ellipsoid expanded by 100% in each direction, 60m x 60m x 20m, and halved the data constraint requirements to a minimum of 8 data in 2 octants.
Parent blocks were sub-blocked to minimum 2.5mN x 2.5mE x 2.5mRL against the granite wireframe and weathering surfaces to accurately represent the volume of mineralisation and material types.
Estimates were conducted using no top assay cut and 20 and 30g/t top cuts. After comparison to independent check models, the estimates using a 20g/t top cut were adopted. The 20g/t top cut represents approximately the 99.5th percentile of gold grades and affects 26 data.
Bulk densities of 1.8, 2.2 and 2.7 t/cu m were applied to weathered, partially weathered and fresh mineralisation respectively. The bulk densities of the mineralisation have been determined with a high degree of confidence from extensive sampling and mining of other deposits at Edikan. The stated Mineral Resource consists entirely of fresh rock (sulphide) mineralisation.
CRITERIA FOR RESOURCE CLASSIFICATION
Mineral Resources were classified in accordance with the Australasian Code for the Reporting of Identified Mineral Resources and Ore Reserves (JORC, 2012). Estimated Mineral Resources were classified as Measured, Indicated and Inferred Mineral Resources based on data quality, drill hole spacing, and continuity of mineralisation. The portion of the granite where the drill spacing is 20m by 20m or less and the majority of parent blocks received estimates in search pass 1 were classified as Measured. This was confined to approximately surface to 990mRL. The portion of the deposit between 990RL and 820RL, where the drill spacing is generally greater than 20m by 20m but less than 40m by 40m and blocks received estimates using search pass 2, was classified as Indicated Mineral Resource. Material below 820RL estimated using search pass 3 was classified as Inferred Mineral Resource. Inferred resources extend to 600RL, approximately 500m below surface.
The Mineral Resource estimate appropriately reflects the view of the Competent Person.
CUTOFF GRADE
The cut-off grade of 1g/t for the stated Esuajah South Mineral Resource estimate reflects the estimated shut-off grade for underground mass mining based on anticipated mining costs, processing costs and gold recoveries derived from the Feasibility Study and a gold price of US$1,800/oz.
STOCKPILES
Mineral Resources contained in stockpiles are based on volume estimates based on ground survey data, loose bulk densities derived over time by reconciliation of volumes mined (at in situ densities) to stockpile movements and volumes and estimates of stockpile grades based on predicted grades of mined material transferred onto stockpiles and material depleted by processing.
Closing stockpiles at 30 June 2021 were estimated as shown in Table 11.
Table 11: Edikan Closing Stockpiles – 30 June 2021
| Material | Quantity tonnes | Grade g/t gold | Gold ounces |
| Low grade oxide | 529,298 | 0.49 | 8,395 |
| Low grade fresh | 2,045,244 | 0.61 | 39,974 |
| High grade transition | 225,634 | 0.98 | 7,132 |
| High grade fresh | 54,031 | 0.86 | 1,486 |
| Crushed ore stockpile | 79,931 | 0.82 | 2,114 |
| Total | 2,934,138 | 0.63 | 59,101 |
Notes:
- Stockpile tonnage and grade estimates are considered sufficiently accurate to support their classification as Measured Mineral Resources.
ORE RESERVE ESTIMATE
YAOURÉ GOLD MINE, CÔTE D’IVOIRE
The Open Pit Ore Reserve estimate for the Yaouré Gold Mine includes depletion of the CMA and Yaouré deposits and addition of several Near-Mine Satellite deposits. The basis of the Ore Reserve Estimates for the CMA and Yaouré deposits remains unchanged from those reported at 30 June 2019. Readers are referred to ASX release “Perseus Updates Mineral Resource and Ore Reserve Estimates” dated 28 August 2019 and the notes contained therein. Details on the additional Ore Reserves from the Near-Mine Satellite deposits are covered in the following section and Appendix 1 provides the JORC Table 1 criteria for the Near-Mine Satellite Open Pit Ore Reserves.
The Proved and Probable Ore Reserves for Yaouré are estimated as 29.6Mt, grading 1.71g/t gold and containing 1,632kozs of gold. Details of the estimate are shown in Table 12.
Table 12: Yaouré Proved and Probable Ore Reserves as at 30 June 20215,7
| Deposit | Deposit Type | Proved | Probable | Proved + Probable | ||||||
| Quantity | Grade | Gold | Quantity | Grade | Gold | Quantity | Grade | Gold | ||
| Mt | g/t gold | ‘000 oz | Mt | g/t gold | ‘000 oz | Mt | g/t gold | ‘000 oz | ||
| CMA1,2,4 | Open Pit | - | - | - | 19.9 | 2.04 | 1,305 | 19.9 | 2.04 | 1,305 |
| Yaouré1,2,4 | Open Pit | - | - | - | 4.9 | 1.03 | 162 | 4.9 | 1.03 | 162 |
| Near-Mine Satellites2,3,4,8 | Open Pit | - | - | - | 4.4 | 1.06 | 151 | 4.4 | 1.06 | 151 |
| Sub-Total | Open Pit | - | - | - | 29.2 | 1.72 | 1,618 | 29.2 | 1.72 | 1,618 |
| Stockpiles6 | Stockpile | 0.5 | 0.95 | 14 | - | - | - | 0.5 | 0.95 | 14 |
| Total | 0.5 | 0.95 | 14 | 29.2 | 1.72 | 1,618 | 29.6 | 1.71 | 1,632 | |
Notes:
- Based on depletion to 30 June 2021 mining surfaces.
- Based on Mineral Resource estimates which were current at 30 June 2021.
- Based on June 2021 Ore Reserve estimation.
- Variable gold grade cut-off for each material type, ranging from 0.40 g/t to 0.70 g/t.
- Inferred Mineral Resource is considered as waste, t : t.
- Based on EOM June 2021 stockpile balance report.
- Rounding of numbers to appropriate precisions may have resulted in apparent inconsistencies.
- Combined several small near-mine pits, namely Y2N, Y3, Angovia 2 and Govisou.
In the ASX release “Perseus Updates Mineral Resource and Ore Reserve Estimates” dated 28 August 2019 the Proved and Probable Ore Reserves were found within the economic limits of the CMA and Yaouré open pits and an old heap leach. Since then ore processing has commenced at Yaouré and the pit and heap leach Ore Reserves have been partially depleted. Additional Ore Reserves have been added at Angovia 2, Govisou and the Y2N/Y3 deposits following completion of feasibility studies and details are provided in Appendix 1. Figure 1 shows the changes in the Ore Reserve as at 30th June 2021.
Figure 1: Change in Yaouré Ore Reserves – June 2020 to June 2021 is available at https://www.globenewswire.com/NewsRoom/AttachmentNg/646ba038-db19-4311-90e3-2c7d6b57d25e
ECONOMIC ASSUMPTIONS
- Gold metal price of US$1,300/oz used.
- Un-escalated average costs used in optimising pit designs are as shown in Table 13 below.
- A discount rate of 10% (real) has been assumed to calculate net present values of forecast cash flows.
Table 13: Assumed average operating costs
| Mining | Processing | G&A | Selling | Royalties |
| US$2.83 /t mined | US$10.60 /t milled | US$5.99 /t milled | US$3.42 /oz sold | 4% |
OPEN PIT MINING PARAMETERS
- The chosen method for the Open Pit Ore Reserves is conventional open pit mining utilising hydraulic excavators and trucks. A mining bench height of 10 metres is used, with loading on 2.5 metres flitches to minimise ore loss and dilution.
- The economic pit shell was defined using Whittle pit optimisation software (“Whittle”) with inputs such as geotechnical parameters, ore loss and dilution, metallurgical recoveries, operating costs, and gold price.
- The pit optimisation was run with revenue generated only by Measured and Indicated Mineral Resources. No value was allocated to Inferred Mineral Resources.
- Whittle 4X input parameters were generally based on Perseus’s operating site experience and supporting technical studies.
- The pit slope design assumptions are based on a geotechnical study by Pitt&Sherry Consultant. Inter-ramp pit slopes are 40 to 60 degrees varied by material weathering level and wall sector. Inter-ramp slopes are excluding ramp but including berms spaced at between 10 and 20 metres vertically and berm widths of 5 to 7 metres.
- Pit ramps have been designed for a 100-tonne payload truck fleet and are set at 24 metres (dual lane) to 16 metres (single lane).
- Vertical mining advance has been capped based on Perseus’s operating experience.
- Minimum mining width of 40 metres was generally applied to the pit cutback designs.
- There are no physical constraints to mining within the lease area. No property, infrastructure or environmental issues are known to exist which may limit the extent of mining within the mining lease.
- Ore cut-off grades, based on metallurgical recoveries, ore costs and gold price, are as shown in Table 14.
Table 14: Open Pit Cut-Off Grades
| Deposit | Cut-Off Grade by Ore Type (g/t gold) | |||
| Oxide | Transition | Fresh Basalt | Fresh Granodiorite | |
| CMA | 0.40 | 0.45 | 0.55 | - |
| Yaouré | 0.40 | 0.45 | 0.65 | 0.70 |
| Near-Mine Satellite | ||||
| Y2N – Y3 | 0.40 | - | - | - |
| Angovia 2 | 0.40 | 0.45 | 0.65 | - |
| Govisou | 0.40 | 0.40 | 0.50 | - |
PROCESSING PARAMETERS
- The process metallurgical recovery for gold is fixed by material type in each deposit. Gold recovery rates range from 92.9% – 93.4% for oxide ore, 92.0% – 94.5% for transition ore and 89.5% – 93.8% for fresh ore. Recovery is a function the differing metallurgical properties of different material type of ores in each deposit and is determined from metallurgical testwork for each deposit and material type. Recoveries are as shown in Table 15.
- No deleterious material has been identified.
- Average annual processing throughput rate of ore is dependent on deposit, rock type and weathering state. The weighted average throughput rate for all materials is nominally 3.5 Mtpa.
- The processing circuit involves single stage crushing, semi-autogenous grinding, gravity recovery and CIL.
Table 15: Metallurgical Recoveries by Material Type
| Deposit | Recovery by Ore Type (%) | |||
| Oxide | Transition | Fresh Basalt | Fresh Granodiorite | |
| CMA | 93.4 | 94.5 | 89.5 | - |
| Yaouré | 93.4 | 94.5 | 92.6 | 93.8 |
| Near-Mine Satellite | ||||
| Y2N – Y3 | 93.4 | - | - | - |
| Angovia 2 | 92.9 | 92.0 | 91.1 | - |
| Govisou | 93.4 | 94.5 | 89.5 | - |
STOCKPILE AND HEAP LEACH PARAMETERS
The stockpiles that existed on 30 June 2021 will be all fed to the processing plant over the mine life based on the blending strategy and associated rehandle costs for all material are allowed for.
CRITERIA FOR ORE RESERVE CLASSIFICATION
Ore Reserves have been classified based on the underlying Mineral Resource classifications and the level of detail in the mine planning. The Mineral Resources were classified as Measured, Indicated and Inferred. The Ore Reserves, based only on the Measured and Indicated Resources, have been classified as Proved and Probable Ore Reserves, respectively. The Ore Reserves for Y2N and Y3 deposits are based on grade control models that replace portions of the Yaouré Mineral Resource volume but lie outside of the Yaouré pit design.
The Ore Reserve is classified as Proved and Probable in accordance with the JORC Code, corresponding to the Mineral Resource classifications of Measured and Indicated and considering other factors where relevant. The deposits’ geological models are well constrained. The Ore Reserve classification is considered appropriate given the nature of the deposits, the moderate grade variability, drilling density, structural complexity and mining history. Therefore, it was deemed appropriate to use Measured Mineral Resources as a basis for Proved Reserves and Indicated Mineral Resources as a basis for Probable Reserves.
No Inferred Mineral Resources were included in the Ore Reserve estimate.
SISSINGUÉ GOLD MINE, CÔTE D’IVOIRE
The updated Ore Reserve estimate for Sissingué Gold Mine is a depletion of the previous Sissingué deposit Ore Reserve with update of estimate based on $1,600/oz gold price assumption and the latest Mineral Resource estimate for the Sissingué deposit, plus the addition of Ore Reserves at the Bagoé deposit following completion of a feasibility study. All changes at Sissingué and Bagoé are included in the ASX release “Perseus Mining Updates Mineral Resource and Reserve Estimates” dated 24th August 2021 and the notes contained therein. Appendix 2 provides the JORC Table 1 criteria for the Bagoé deposit and Appendix 3 covers the update to the Sissingué Ore Reserves.
The Fimbiasso Ore Reserve is based on the Mineral Resource from March 2020 and readers are referred to ASX release “Perseus Mining Updates Mineral Resources & Ore Reserves” dated 26 August 2020 and the notes contained therein.
The combined Sissingué Gold Mine, Fimbiasso Project and Bagoé Project Ore Reserve is summarised below in Table 16 and is estimated at 5.9 Mt of ore, grading 1.72 g/t gold and containing 324k ounces of gold. Table 16 reports the Ore Reserves by category, project and type, above variable cut-off grades. The classification categories of Proved and Probable under the JORC Code are equivalent to the CIM categories of the same name (CIM, 2010).
Table 16: Sissingué Gold Mine Proved and Probable Ore Reserves as at 30 June 20215,7
| Deposit | Deposit Type | Proved | Probable | Proved + Probable | ||||||
| Quantity | Grade | Gold | Quantity | Grade | Gold | Quantity | Grade | Gold | ||
| Mt | g/t gold | ‘000 oz | Mt | g/t gold | ‘000 oz | Mt | g/t gold | ‘000 oz | ||
| Sissingué1,2,3,4 | Open Pit | 2.2 | 1.31 | 93 | 0.1 | 1.39 | 7 | 2.4 | 1.32 | 100 |
| Fimbiasso2,4 | Open Pit | 1.1 | 1.95 | 70 | 0.2 | 2.15 | 13 | 1.3 | 1.98 | 82 |
| Bagoé2,3,4 | Open Pit | 0.5 | 2.58 | 40 | 0.6 | 2.61 | 51 | 1.1 | 2.59 | 91 |
| Sub-total | Open Pit | 3.8 | 1.66 | 203 | 0.9 | 2.32 | 70 | 4.7 | 1.79 | 273 |
| Stockpiles6 | Stockpile | 1.1 | 1.40 | 51 | - | - | - | 1.1 | 1.40 | 51 |
| Total | 4.9 | 1.61 | 254 | 0.9 | 2.32 | 70 | 5.9 | 1.72 | 324 | |
Notes:
- Based on depletion to 30 June 2021 mining surfaces.
- Based on Mineral Resource Estimates which were current at 30 June 2021.
- Based on July 2021 Ore Reserve estimation.
- Variable gold grade cut-off for each material type, ranging from 0.40 g/t to 1.05 g/t at Sissingué deposits, from 0.80 g/t to 1.50 g/t at Fimbiasso deposits and from 1.00 g/t to 3.00 g/t at Bagoé deposits.
- Inferred Mineral Resource is considered as waste, t : t.
- Based on EOM June 2021 stockpile balance report.
- Rounding of numbers to appropriate precisions may have resulted in apparent inconsistencies.
The changes in the Ore Reserve from that last quoted in June 2020 are associated with ore depletion from mining since 30 June 2020 along with revised Sissingué Ore Reserves driven by an updated resource model and change in gold price assumption from US$1,300/oz to US$1,600/oz. Also, Ore Reserves from the Bagoé deposit are included for the first time after completion of a feasibility study. The waterfall graph (Figure 2) below summarises the changes in the Sissingué Gold Mine reserves.
Figure 2: Change in Sissingué Ore Reserves – June 2020 to June 2021 is available at
https://www.globenewswire.com/NewsRoom/AttachmentNg/25967d88-09c2-41c8-a95c-e8bb6d1d79e5
ECONOMIC ASSUMPTIONS
- Gold metal price US$1,600/oz for Sissingué and US$1,300/oz for both Fimbiasso and Bagoé. The increase in gold price used at Sissingué reflects the short mine life remaining for the deposit.
- Un-escalated average costs used in optimising pit designs are as shown in Table 17 below.
- A discount rate of 10% (real) has been assumed to calculate net present values of forecast cash flows.
Table 17: Assumed average operating costs
| Mining (Open Pit) | Processing | G&A | Selling | Royalties |
| US$4.85t/mined | US$15.30/milled | US$9.80t/milled | US$2.24/oz sold | 4.8% |
OPEN PIT MINING PARAMETERS
- The chosen method for the Open Pit Ore Reserves is conventional open pit mining utilising hydraulic excavators and trucks, mining bench heights of 5 metres with 2.5 metre flitches to minimise ore loss and waste rock dilution.
- The economic pit shell was defined using Whittle pit optimisation software (“Whittle”) with inputs such as geotechnical parameters, ore loss and dilution, metallurgical recovery and mining costs.
- The pit optimisation was run with revenue generated only by Measured and Indicated Mineral Resources. No value was allocated to Inferred Mineral Resources.
- Whittle 4X input parameters were generally based on Perseus’s operating site experience and supporting technical studies.
- The pit slope design assumptions are based on a geotechnical study by George, Orr and Associates (Australia) Pty Ltd for Sissingué and Fimbiasso. For Bagoé deposits, the geotechnical study was completed by Pitt&Sherry Consultant. Overall pit slopes are 30 to 50 degrees inclusive of berms spaced at between 5, 10 and 20 metres vertically and berm widths of 4 to 7 metres.
- Pit ramps have been designed for a 40 tonne ADT truck fleet and are set at 17 metres (dual lane) to 11 metres (single lane).
- Vertical mining advance has been capped based on Perseus’s operating experience.
- Minimum mining width of 40 metres was generally applied to the pit cutback designs.
- There are no physical constraints to mining within the lease areas. No property, infrastructure or environmental issues are known to exist which may limit the extent of mining within the mining areas.
- Ore from Fimbiasso pits will be trucked to Sissingué with a maximum limit of 40 kt/month and from Bagoé pits will be trucked at a maximum limit of 50 kt/month.
- Ore cut-off grades, based on the gold price, cost and mining parameters, are as shown in Table 18.
Table 18: Open Pit Cut-Off Grades
| Deposit | Cut-Off Grade by Ore Type (g/t gold) | |||
| Oxide | Transition | Fresh Granite | Fresh Sediment/Mafic | |
| Sissingué | 0.40 | 0.60 | 0.85 | 1.05 |
| Fimbiasso | 0.80 | 1.00 | 1.10 | 1.50 |
| Bagoé | ||||
| Antoinette | 1.00 – 1.20 | 1.20 – 2.70 | 1.60 – 3.00 | - |
| Juliette | 1.10 | 1.40 | - | - |
| Veronique | 1.10 – 1.20 | 1.40 | - | - |
PROCESSING PARAMETERS
- The process metallurgical recovery for gold is fixed by material type in each deposit. Gold recovery rates range from 94% for oxide ore to 91% for fresh ore. Recovery variation is a function of differing metallurgical properties of different material type of ores from each deposit. The metallurgical recoveries are as shown in Table 19.
- No deleterious material has been identified.
- Fimbiasso ore processed is limited by a trucking limit of maximum 40kt/month and for Bagoé the trucking limit is 50kt/month.
- Average annual processing throughput rate of ore is nominally 1.2Mtpa of combined ore from all deposits, with throughput rates variable by material type. The processing circuit involves single stage crushing, semi-autogenous grinding, gravity recovery and CIL.
Table 19: Metallurgical Recoveries by Material Type and Pit
| Deposit | Recovery by Ore Type (%) | |||
| Oxide | Transition | Fresh Granite | Fresh Sediment/Mafic | |
| Sissingué | 97.0 | 95.0 | 92.0 | 83.3 * |
| Fimbiasso | 94.0 | 93.0 | 91.0 | 91.0 |
| Bagoé # | ||||
| Antoinette | 93.0 | 82.8 | 87.5 | - |
| Juliette | 85.4 | 85.4 | - | - |
| Veronique | 92.8 | 89.7 | - | - |
Notes:
* Average value based on formula (7.63*In(Au_grade) +78.5)%
# Average value based on multiple recovery domains
STOCKPILE PARAMETERS
Ore mined from both Fimbiasso and Bagoé will be temporarily stockpiled on site then trucked to Sissingué for processing. Ore from Fimbiasso and Bagoé will be blended with remaining ore from the Sissingué deposit in order to keep the processing plant full, thereby minimising unit processing and G&A costs.
CRITERIA FOR ORE RESERVE CLASSIFICATION
Ore Reserves have been classified based on the underlying Mineral Resource classifications and the level of detail in the mine planning. The Mineral Resources were classified as Measured, Indicated and Inferred. The Ore Reserves, based only on the Measured and Indicated Resources, have been classified as Proved and Probable Ore Reserves, respectively.
The Ore Reserve is classified as Proved and Probable in accordance with the JORC Code, corresponding to the Mineral Resource classifications of Measured and Indicated and considering other factors where relevant. The deposits’ geological models are well constrained. The Ore Reserve classification is considered appropriate given the nature of the deposits, the moderate grade variability, drilling density, structural complexity and mining history. Therefore, it was deemed appropriate to use Measured Mineral Resources as a basis for Proved Reserves and Indicated Mineral Resources as a basis for Probable Reserves.
No Inferred Mineral Resources were included in the Ore Reserve estimate.
EDIKAN GOLD MINE
The Ore Reserve is summarised below in Table 20 and is based on the Edikan Mineral Resources as at 30 June 2021. The Open Pit Ore Reserve is a depletion of the previous Ore Reserve and readers are referred to ASX release “Perseus Updates Mineral Resource and Ore Reserve Estimates” dated 26 August 2020 and the notes contained therein. The Esuajah South Ore Reserve has been updated based on underground mining methods. All Ore Reserves are reported in accordance with the JORC Code and are reported by category, deposit and type, above variable cut-off grades. The classification categories of Proved and Probable under the JORC Code are equivalent to the CIM categories of the same name (CIM, 2010). Appendix 4 provides the JORC Table 1 criteria for the Edikan Underground Ore Reserves.
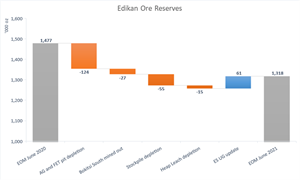
The updated Proved and Probable Ore Reserves for Edikan are now estimated as 36.4 Mt grading 1.13 g/t gold, containing 1,318 k ounces of gold including 14.1 Mt of ore grading 1.06 g/t gold and containing 480 k ounces of gold in the Proved category and a further 22.3 Mt of ore grading 1.17 g/t gold containing 837 k ounces of gold classified as Probable Ore Reserves. Mining of the Bokitsi South deposit was completed in November 2020 with the Ore Reserve being fully depleted.
Table 20: Edikan Gold Mine Proved and Probable Ore Reserves as at 30 June 20214,6
| Deposit | Deposit Type | Proved | Probable | Proved + Probable | ||||||
| Quantity | Grade | Gold | Quantity | Grade | Gold | Quantity | Grade | Gold | ||
| Mt | g/t gold | ‘000 oz | Mt | g/t gold | ‘000 oz | Mt | g/t gold | ‘000 oz | ||
| AF Gap1,2,3 | Open Pit | 6.1 | 1.14 | 222 | 11.5 | 1.03 | 381 | 17.6 | 1.06 | 603 |
| Fetish1,2,3 | Open Pit | 3.1 | 1.14 | 113 | 5.1 | 1.11 | 183 | 8.2 | 1.12 | 296 |
| Sub-total | 9.2 | 1.14 | 336 | 16.6 | 1.05 | 563 | 25.8 | 1.08 | 899 | |
| Esuajah South2,4 | U/ground | 1.9 | 1.37 | 85 | 2.8 | 2.40 | 217 | 4.8 | 1.98 | 302 |
| Heap Leach1,5 | Stockpile | - | - | - | 2.9 | 0.62 | 58 | 2.9 | 0.62 | 58 |
| ROM Stockpiles5 | Stockpile | 2.9 | 0.63 | 59 | - | - | - | 2.9 | 0.63 | 59 |
| Total | 14.1 | 1.06 | 480 | 22.3 | 1.17 | 837 | 36.4 | 1.13 | 1,318 | |
Notes:
- Based on depletion to 30 June 2021 mining surfaces.
- Based on Mineral Resource Estimates which were current at 30 June 2021.
- Variable gold grade cut-off for each material type, ranging from 0.35 g/t to 0.70 g/t.
- Inferred Mineral Resource is considered as waste, t : t.
- Based on EOM June 2021 stockpile balance report.
- Rounding of numbers to appropriate precisions may have resulted in apparent inconsistencies.
Proved and Probable Ore Reserves are found within the economic limits of two discrete open pits, an underground project and stockpiles that have been designed based on Measured and Indicated Mineral Resources that incorporated all available Resource in-fill drilling results, a gold price of US$1,300/oz and mining, processing and general and administration parameters derived from recent operating experience.
The Ore Reserves at Edikan were last reported in the ASX release “Perseus Mining Updates Edikan Gold Mine’s Mineral Resource and Ore Reserve” dated 26 August 2020 and the notes contained therein and comparisons made below are made to this last estimate. As shown below in Figure 3 below, the following changes have occurred:
- Bokitsi South Pit has been mined out completely;
- Mining depletion has taken place in the AF Gap and Fetish Pits and through depletion of the old Heap Leach dumps;
- Stockpiles have been depleted in order to keep the processing plant at full capacity; and
- Changes in Esuajah South Underground reserves due to updated feasibility study and revised resource model.
Figure 3: Change in Edikan Ore Reserves – June 2020 to June 2021 is available at
https://www.globenewswire.com/NewsRoom/AttachmentNg/e523949d-1d6f-4c87-8e1b-dfcf92af8fcd
ECONOMIC ASSUMPTIONS
- Gold metal price US$1,300/oz.
- Un-escalated average costs used in optimising pit designs are as shown in Table 21 below.
- A discount rate of 10% (real) has been used to calculate net present value of forecast cash flow.
Table 21: Assumed average operating costs
| Mining (Open Pit) | Mining (Underground) | Processing | G&A | Selling | Royalties | |
| US$3.86 /t mined | US$42t/mined | US$8.94 /t milled | US$2.60 /t milled | US$2.24 /oz sold | 8.25 | % |
OPEN PIT MINING PARAMETERS
- The chosen method for the Open Pit Ore Reserves is conventional open pit mining utilising hydraulic excavators and trucks, mining bench heights of 5 metres with 2.5 metre flitches to minimise ore loss and waste rock dilution.
- The economic pit shell was defined using Whittle pit optimisation software (“Whittle”) with inputs such as geotechnical parameters, ore loss and dilution, metallurgical recovery and mining costs.
- The pit optimisation was run with revenue generated only by Measured and Indicated Mineral Resources. No value was allocated to Inferred Mineral Resources.
- Whittle 4X input parameters were generally based on Perseus’s operating site experience and supporting technical studies.
- The pit slope design assumptions are based on a geotechnical study by George, Orr and Associates (Australia) Pty Ltd. Overall pit slopes are 30 to 50 degrees inclusive of berms spaced at between 5 and 20 metres vertically and berm widths of 5 to 12 metres.
- Pit ramps have been designed for a 100-tonne payload truck fleet and are set at 24 metres (dual lane) to 16 metres (single lane).
- Vertical mining advance has been capped based on Perseus’s operating experience.
- Minimum mining width of 40 metres was generally applied to the pit cutback designs.
- There are no physical constraints to mining within the lease area. No property, infrastructure or environmental issues are known to exist which may limit the extent of mining within the mining lease.
- Ore cut-off grades are based on the gold price, cost and mining parameters are as shown in Table 22.
Table 22: Open Pit Cut-Off Grades
| Deposit | Cut-Off Grade by Ore Type (g/t gold) | ||
| Oxide | Transition | Fresh | |
| AF Gap | 0.35 | 0.70 | 0.50 |
| Fetish | 0.40 | 0.65 | 0.55 |
| Heap Leach | 0.40 | - | - |
PROCESSING PARAMETERS
- The process metallurgical recovery for gold is fixed by material type in each deposit. Gold recovery rates range from 61% for oxide ore and 88-90% for primary ore. Recovery variation is a function of differing metallurgical properties of ores from different deposits as shown in Table 23.
- No deleterious material has been identified.
- Average annual processing throughput rate of ore is nominally 7.0Mtpa, with throughput rates variable by material type and deposit. The processing circuit involves single stage crushing, semi-autogenous grinding, gravity recovery, flotation, regrind and CIL.
Table 23: Metallurgical Recoveries by Material Type and Pit
| Deposit | Recovery by Ore Type (%) | ||
| Oxide | Transition | Fresh | |
| AF Gap | 61.0 | 73.0 | 88.0 |
| Fetish | 61.0 | 73.0 | 90.0 |
| Esuajah South | - | - | 90.0 |
| Heap Leach | 67.0 | - | - |
UNDERGROUND MINING PARAMETERS
- The chosen method for the Underground Reserves is Sub-level mining under rock fill (“SURF”). SURF is a bulk, semi-selective, underground mining method similar to sublevel caving (“SLC”) in layout, but with waste being introduced from surface instead of the hangingwall caving.
- The ore is broken through drilling and blasting of regularly spaced, fan shaped up-hole rings along each ore drive similar to a standard sub level caving method. As ore is extracted from the underground mine, waste fill will be introduced from surface to fill the resulting void. The orebody is accessed through regularly spaced draw points on multiple levels. Draw points are offset between levels to provide a regular, honeycomb layout to ensure maximum recovery of blasted ore.
- Parallel rings are designed along the length of each ore drive. The rings are typically blasted and loaded one at a time, in “choke blast” conditions (i.e. blasting is against the previously mined ring instead of into a free void).
- In total, 69% of the designed ring tonnes are extracted the remaining 31% is left behind and is mixed with the external dilution and/or the introduced fill. About 91% of the total volume mined from the stope zone is replaced with waste introduced into the pit as part of the SURF method, none of this material is planned to be drawn. Only swell is drawn in sub-economic rings and this improves the remaining grade that is drawn and also the dilution grade for future rings. In total, the mined grade is 99% of the average in-situ grade, which includes lower grade zones that are broken but only partially extracted.
- Geotechnical assessment has been undertaken to assess
- Requirements for development ground support;
- Sublevel intervals;
- Ore drive spacing;
- Stand-off distances for infrastructure; and
- Mine portal access.
- The orientation of geological structures measured from borehole cores, intact rock strengths and the likely in-situ rock stress field have been evaluated. No significant geotechnical factors or influences exist which would exclude the currently proposed ESS underground development and stoping.
- The underground mining at ESS will encounter “low” to “moderate” in-situ rock stress conditions. Given that planned SLC operations will be carried out at relatively shallow depths (≤260 m below natural surface), rock stress magnitudes are not expected to be a limiting factor to proposed underground mining.
- The Esuajah South underground development and stoping within fresh rocks will be carried out in generally “fair” to “good” quality rock mass conditions.
- Power, air, water and other consumables were estimated based on the calculated mine schedule.
- The operating and capital costs assume a contractor operated mine with most capital equipment being supplied by the mining contractor.
- The underground project greatly benefits from sharing the process plant and general and administration (“G&A”) overheads with the larger Edikan Gold Mine open pit operations. This reduces plant processing operating cost and G&A. It does however make the ESS underground project reliant on being completed in conjunction with the current larger Edikan Gold Mine open pit schedules.
STOCKPILE AND HEAP LEACH PARAMETERS
It is assumed all the Heap Leach material is mined and fed to the processing plant during the mine life based on the material blending schedule and all the material is rehandle on the ROM stockpile. The ROM stockpiles that existed at 30 June 2021 are all fed to the processing plant over the mine life and associated rehandle costs for all material are allowed for.
CRITERIA FOR ORE RESERVE CLASSIFICATION
Ore Reserves have been classified based on the underlying Mineral Resource classifications and the level of detail in the mine planning. The Mineral Resources were classified as Measured, Indicated and Inferred. The Ore Reserves, based only on the Measured and Indicated Resources, have been classified as Proved and Probable Ore Reserves, respectively.
The Ore Reserve is classified as Proved and Probable in accordance with the JORC Code, corresponding to the Mineral Resource classifications of Measured and Indicated and taking into account other factors where relevant. The deposits’ geological models are well constrained. The Ore Reserve classification is considered appropriate given the nature of the deposits, the moderate grade variability, drilling density, structural complexity and mining history. Therefore, it was deemed appropriate to use Measured Mineral Resources as a basis for Proved Reserves and Indicated Mineral Resources as a basis for Probable Reserves.
No Inferred Mineral Resources were included in the Ore Reserve estimate.
This announcement was authorised for release by the Board Technical Committee.
Competent Person Statements:
Edikan
The information in this report that relates to the Esuajah South Underground Mineral Resource is based on information compiled by Mr Gary Brabham, FAusIMM, MAIG, who is an employee of Perseus. The estimate of the Esuajah South Underground Ore Reserve was undertaken by Mr Andrew Gasmier, MAusIMM of Mining Plus Pty Ltd. Mr Gasmier has no economic, financial or pecuniary interest in the company. The information in this report that relates to Esuajah North Mineral Resources estimate was first reported by the Company in a market announcement released on 29 August 2018. The information in this report that relates to AF Gap Mineral Resources and Ore Reserve estimate was first reported by the Company in a market announcement released on 26 August 2020. The information in this report that relates to the Mineral Resource and Ore Reserve estimates for the Fetish deposit and the Heap Leach was first reported by the Company in a market announcement released on 20 February 2020. This report includes an update for mining depletion at Edikan as at 30 June 2021.
Sissingué, Fimbiasso and Bagoé
The information in this report that relates to Mineral Resources and Ore Reserves for the Fimbiasso deposits was first reported by the Company in a market announcement released on 26 August 2020. The information in this report that relates to Mineral Resources for the Sissingué and Bagoé deposits is based on information compiled by Mr Nicolas Johnson MAIG, of MPR Geological Consultants Pty Ltd. Mr Johnson has no economic, financial or pecuniary interest in the company. The estimate of the Bagoé Ore Reserves was undertaken by Mr Paul Thompson, FAusIMM, who is an employee of Perseus. The estimate of the Sissingué Ore Reserves was undertaken by Mr Craig Fawcett, FAusIMM CP, who is an employee of Perseus.
Yaouré
The information in this report that relates to Open Pit and Heap Leach Mineral Resources and Ore Reserves at Yaouré was first reported by the Company in a market announcement released on 28 August 2019. This report includes an update for mining depletion at Yaouré as at 30 June 2021. The information in this report that relates to Underground Mineral Resources at Yaouré was first reported by the Company in a market announcement released on 5 November 2018 and adjusted to exclude material lying within the US$1,800/oz pit shell that constrains the Open Pit Mineral Resources in a market announcement released on 28 August 2019. The information in this report that relates to Mineral Resources for the Govisou and Angovia 2 deposits is based on information compiled by Mr Jonathon Abbott, MAIG, of MPR Geological Consultants Pty Ltd. Mr Abbott has no economic, financial or pecuniary interest in the company. The estimate of the Yaouré near mine satellite deposit Ore Reserves was undertaken by Mr Paul Thompson, FAusIMM who is an employee of Perseus.
All information stated above as reported earlier was reported in compliance with the JORC Code 2012 and NI43-101 The Company confirms that it is not aware of any information that would, in any other respect than reported above, result in a material change to the estimates of Mineral Resources and Ore Reserves previously released.
Every Competent Person referred to above has sufficient experience, which is relevant to the style of mineralisation and type of deposit under consideration and to the activity which he has undertaken to qualify as a Competent Person as defined in the JORC Code 2012 and a Qualified Person as defined in NI43-101 and consents to the inclusion in this report of the matters based on this information in the form and context in which it appears and has approved the inclusion of technical and scientific information in this report.
Caution Regarding Forward Looking Information:
This report contains forward-looking information which is based on the assumptions, estimates, analysis and opinions of management made in light of its experience and its perception of trends, current conditions and expected developments, as well as other factors that management of the Company believes to be relevant and reasonable in the circumstances at the date that such statements are made, but which may prove to be incorrect. Assumptions have been made by the Company regarding, among other things: the price of gold, continuing commercial production at the Yaouré Gold Mine, the Edikan Gold Mine and the Sissingué Gold Mine without any major disruption due to the COVID-19 pandemic or otherwise, , the receipt of required governmental approvals, the accuracy of capital and operating cost estimates, the ability of the Company to operate in a safe, efficient and effective manner and the ability of the Company to obtain financing as and when required and on reasonable terms. Readers are cautioned that the foregoing list is not exhaustive of all factors and assumptions which may have been used by the Company. Although management believes that the assumptions made by the Company and the expectations represented by such information are reasonable, there can be no assurance that the forward-looking information will prove to be accurate. Forward-looking information involves known and unknown risks, uncertainties, and other factors which may cause the actual results, performance or achievements of the Company to be materially different from any anticipated future results, performance or achievements expressed or implied by such forward-looking information. Such factors include, among others, the actual market price of gold, the actual results of current exploration, the actual results of future exploration, changes in project parameters as plans continue to be evaluated, as well as those factors disclosed in the Company's publicly filed documents. The Company believes that the assumptions and expectations reflected in the forward-looking information are reasonable. Assumptions have been made regarding, among other things, the Company’s ability to carry on its exploration and development activities, the timely receipt of required approvals, the price of gold, the ability of the Company to operate in a safe, efficient and effective manner and the ability of the Company to obtain financing as and when required and on reasonable terms. Readers should not place undue reliance on forward-looking information. Perseus does not undertake to update any forward-looking information, except in accordance with applicable securities laws.
| ASX/TSX: PRU REGISTERED OFFICE: Level 2 437 Roberts Road Subiaco WA 6008 Telephone: +61 8 6144 1700 Email: IR@perseusmining.com www.perseusmining.com | CONTACTS: Jeff Quartermaine Managing Director & CEO jeff.quartermaine@perseusmining.com Nathan Ryan Media Relations +61 4 20 582 887 nathan.ryan@nwrcommunications.com.au |

![]()
Figure 1:

Change in Yaouré Ore Reserves – June 2020 to June 2021
Figure 2:
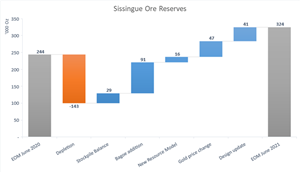
Change in Sissingué Ore Reserves – June 2020 to June 2021
Figure 3: