Finally, Gold's Chart Is Starting to Look Interesting
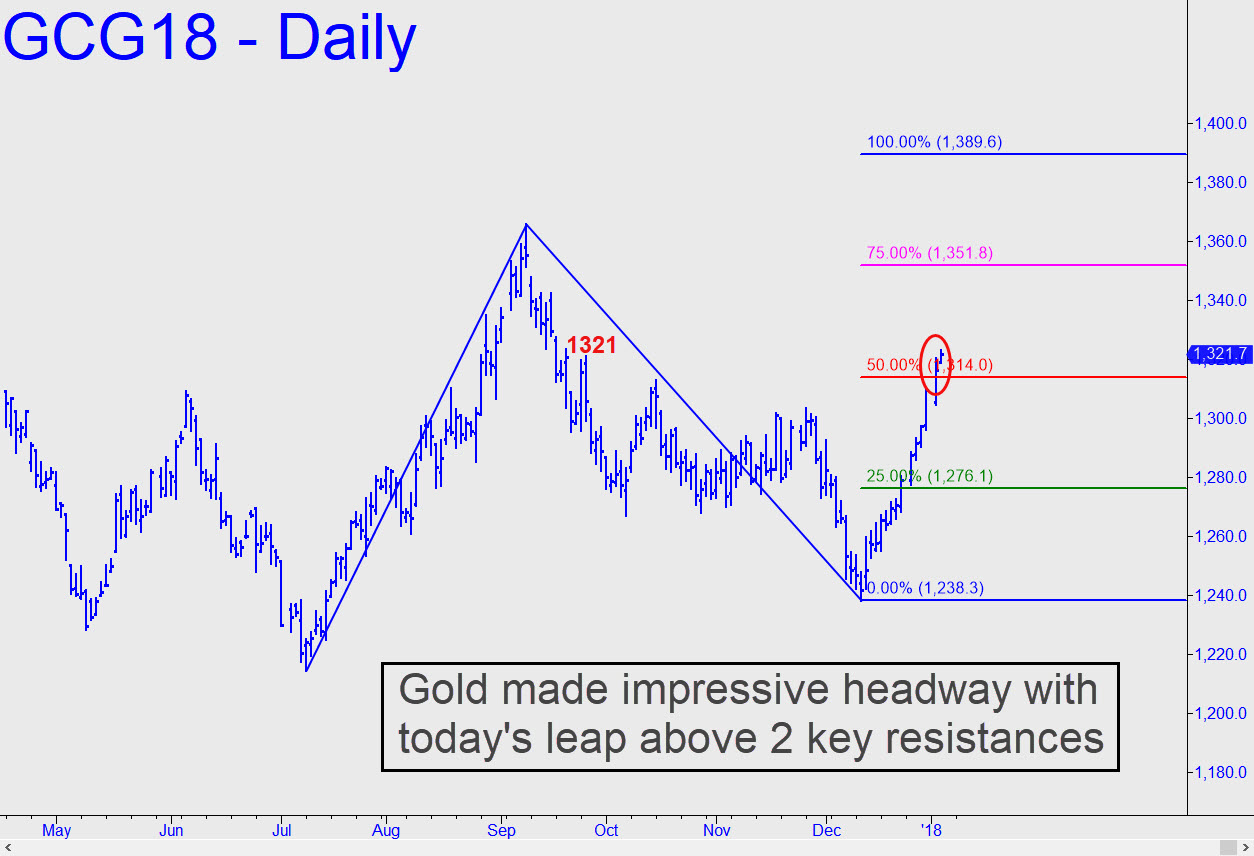
With this evening's robust extension of the rally begun from 1238.30 three weeks ago, buyers have finally made February Gold's chart look interesting encouraging, even. The move earlier in the day through the 1314.00 midpoint resistance, coupled with the so-far slight progress tonight above September's 1321.00 'external' peak, has put the 1389.60 target of the pattern in play. It would become a strong odds-on bet to be reached if the futures are able to close above the red line for two consecutive days or to trade above 1330.00 intraday. Regardless, any pullback in the days/weeks ahead should be viewed as corrective and therefore a buying opportunity. Stay close to the chat room, or check 'Email Notifications' on your account dashboard if you want to stay apprised of any such opportunities in real time. If you don't subscribe but want to join in the fun, click here for a two-week free trial to Rick's Picks, including access to a 24/7 chat room that draws great traders from around the world.