Gold Price Forecast: Bollinger Bands signal breakout could happen soon
Despite the bullish setup on the gold monthly chart, a bullish breakout remains elusive. However, the Bollinger band study (20MA, Std. Dev. of 2) indicates the breakout will likely happen soon.
Monthly chart
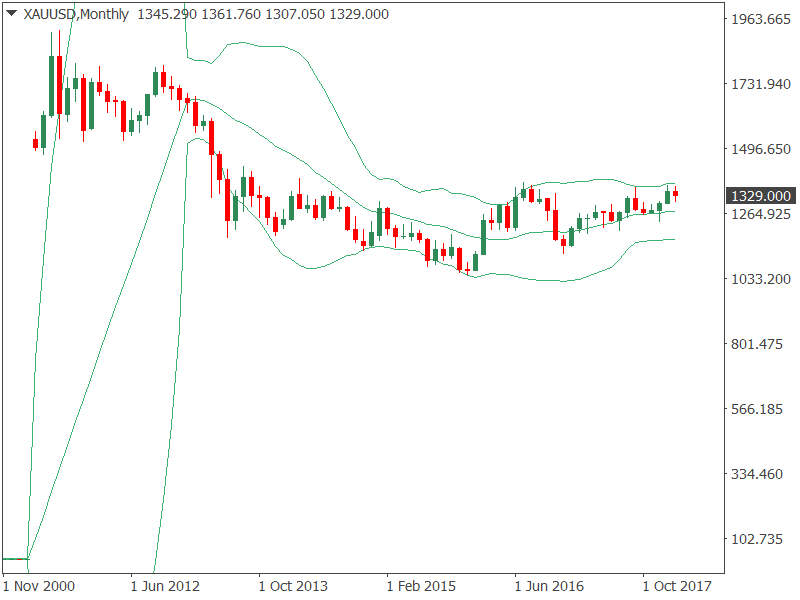
Gold rose to four figures (above $1,000) in March 2008 and since then the gap between the upper Bollinger band and the lower Bollinger band has ranged from $760 (March 2014) to $194 (November 2017). As of writing, the gap is $203, meaning the Bollinger bands are 57 percent narrower than the long-term average of $477.
Also, the gap has been below $210 since September 2017, meaning the yellow metal has witnessed consolidation for almost five months. An extended period of consolidation is usually followed by a big move on either side. It is likely it would be a bullish breakout as indicated by the long duration charts.
Read - Gold risk reversals retain long-term bullish bias: XAU/USD 12-months 25 delta risk reversals show XAU calls (buy gold) remain firmly bid.Further, the macro factors also support gold. The US 10-year treasury yield confirmed an inverse head and shoulders breakout earlier this month, signaling an end of the multi-decade bull market in bonds. This, coupled with fears of faster Fed tightening could send the 10-year well above 3 percent this year.
The rising treasury yield is usually USD bullish (and gold bearish). While this may be true, the rising yield environment could spook the equity markets (as seen earlier this month). It is widely believed that equities could suffer another round of sell-off once the yield finds acceptance above 3 percent. The resulting haven demand could boost gold prices.
Hence, the metal will likely see a convincing move above the upper Bollinger band in the next few months and could rally towards $1,450 before the year-end.
Read - Goldman Sachs raises gold price forecastsWeek Ahead - Focus on the key trendline
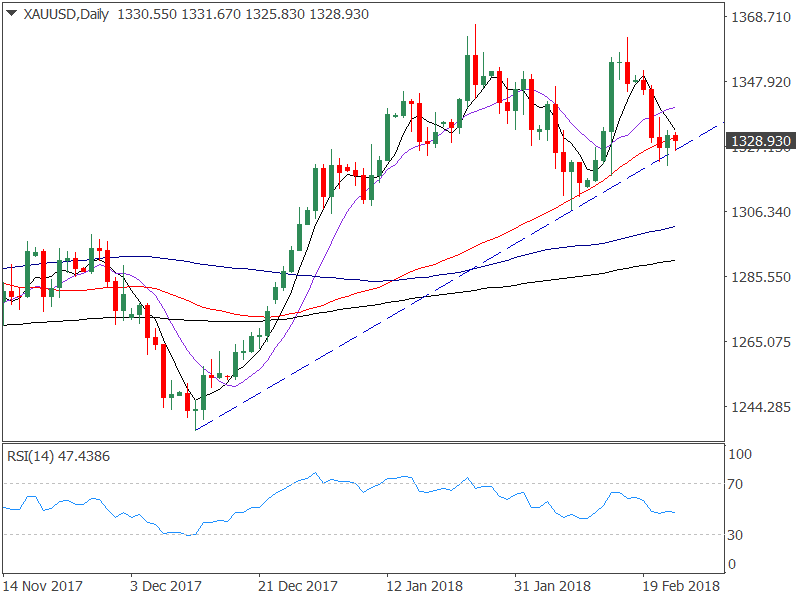
As far as next week is concerned, the focus is on the trendline sloping upwards from the Dec. 12 low and the Feb. 8 low.
Daily chart
Information on these pages contains forward-looking statements that involve risks and uncertainties. Markets and instruments profiled on this page are for informational purposes only and should not in any way come across as a recommendation to buy or sell in these securities. You should do your own thorough research before making any investment decisions. FXStreet does not in any way guarantee that this information is free from mistakes, errors, or material misstatements. It also does not guarantee that this information is of a timely nature. Investing in Forex involves a great deal of risk, including the loss of all or a portion of your investment, as well as emotional distress. All risks, losses and costs associated with investing, including total loss of principal, are your responsibility.