Gold Weekly: It Will Shine
Gold sold off 2.4% last week in spite of a sharp equity sell-off. Where is the safe-haven bid?
Speculators cut their net long positions for the second week in a row, the CFTC shows.
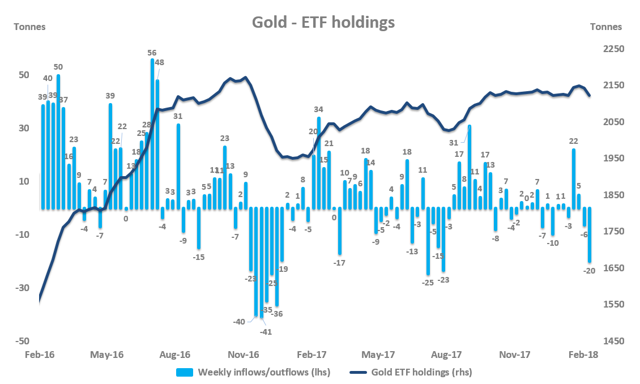
ETF investors cut their gold holdings at the largest pace since July 2017, according to FastMarkets' estimates.
But don't worry! Why gold is set to shine in the months ahead?
I remain long IAU over the long term (12m).

Introduction
Welcome to my Gold Weekly.
In this report, I wish to discuss mainly my views about the gold market.
To do so, I analyse the recent changes in net speculative positions on the Comex (based on) and ETF holdings (based on FastMarkets' estimates) and draw some interpretations about investor and speculator behavior. I conclude the report by sharing my trading positioning.
While the CFTC statistics are public and free, the data about gold ETF holdings are from FastMarkets, an independent metals agency which tracks ETF holdings across the precious metals complex.
Speculative positioning
Source: CFTC
According to the latest Commitment of Traders report (COTR) provided by the CFTC, money managers cut their net long position for a second straight week over the reporting period (January 30-February 06) while spot gold prices dropped 1.0% from $1,339 per oz to $1,325 over the corresponding period.
The net long fund position - at 518.59 tonnes as of February 06 - dropped 69.83 tonnes or 12% from the previous week (w/w). This was driven predominantly by long liquidation (for a second week in a row) of 68.66 tonnes and reinforced slightly by short accumulation of 1.17 tonnes.
The net long fund position remains up a solid 213.11 tonnes or 70% since the start of the year after rising 182.55 tonnes or 149% in the whole of 2017.
Gold's spec positioning is still quite long, with its net spec length at 67% of its historical record.
Investment positioning
Source: FastMarkets
ETF investors sold a significant 20 tonnes of gold over February 02-09, while spot gold prices sold off 2.4% from $1,349 per oz to $1,316 oz over the corresponding period.
This was the largest weekly net outflow since July 2017 when ETF investors liquidated around 23 tonnes of gold between July 21 and July 28.
Outflows from gold ETFs were concentrated on Tuesday, 06 February, amounting to 10.84 tonnes and marking the largest daily net outflow since July 03, 2017 (-11.43 tonnes), according to FastMarkets' estimates. Outflows were also noticeable on Friday, 09 February (-5.16 tonnes).
The largest part of last week's outflows came from the SPDR GLD ETF (-21 tonnes or -2.5% w/w), whereas the iShares Gold Trust ETF (IAU) received roughly 2 tonnes of gold (+0.6% w/w).
Given the accelerating wave of outflows from gold ETFs in the past two weeks, ETF investors have now turned net sellers of gold in the year to date. Gold ETF holdings are down a little 1.17 tonnes since the start of 2018.
In the whole of 2017, ETF investors were net buyers of 173.38 tonnes of gold, which represents an increase of 8.8% in gold ETF holdings from 2016.
As of February 09, 2018, gold ETF holdings totaled 2,122 tonnes, according to FastMarkets' estimates.
Macro backdrop for gold
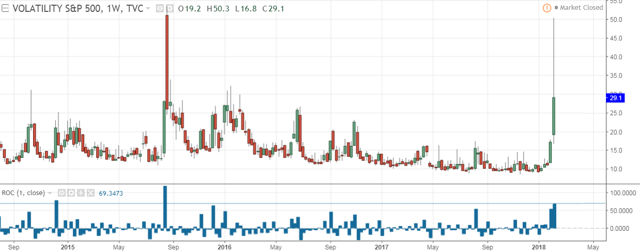
Last week was marked by a substantial surge in risk aversion.
The VIX, which climbed 70% w/w, experienced its largest weekly increase since August 2015 when the VIX jumped ~120% in one single week.
Source: Trading View
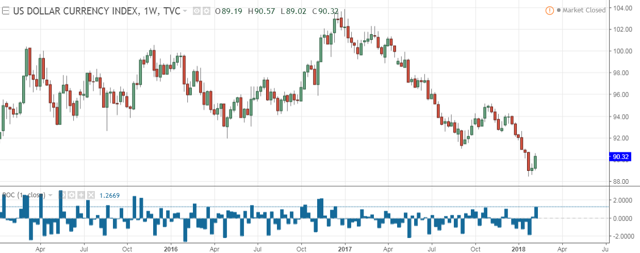
Despite the fall in global risk appetite, ETF investors did not express any interest in building long positions in gold, as evident in the sharp outflows from gold ETFs and the reduction in gold's net spec length. While this looks surprising at the first glance, one explanation may be that investors expect the sell-off in global equities to be only transient and as such, hold the view that there is no need to lift long exposure to risk-unfriendly positions (like gold) at this stage. Instead, investors prefer to hold cash and await the equity dip to be complete before buying it. This would explain why the dollar rose sharply last week.
Source: Trading View
As can be seen above, the surge in global risk aversion benefited the dollar, which rose 1.27% w/w last week, its largest weekly gain since November 2016.
Since US equities surprised to the upside last year, I am inclined to think that they could surprise investors to the downside this year. The magnitude of the recent sell-off in the stock market boosts my conviction.
Source: GS
As Goldman Sachs illustrates in the chart above, the recent drop in the S&P 500 has been sharper than the historical average. While I do not believe that US equities will experience a bear market this year, principally because I expect the "Goldilocks" environment to persist, I think that the magnitude of the correction could take many investors by surprise.
According to Goldman Sachs, the largest historical correction took place in January 1948 when the S&P 500 dropped a whopping 21% over 12 months and took 7 months to recover. So far, the correction is around 10%, still slightly below its historical average of 13%, according to Goldman Sachs' estimates and is less than one month old.
Against this backdrop, I am inclined to think that US equities are only at the early stage of their consolidation phase, and investors may eventually change their view about the need to hold risk-unfriendly positions in their global portfolios. While US equities could rebound in the immediate term after being quite oversold last week, a renewed wave of selling could prompt investors to position their portfolios in a more defensive way. In such a scenario, I expect gold to be heavily bid, reflected in an increase in speculative and ETF demand for the yellow metal.
Trading positioning
I have a positive long-term view (12m) on gold.
While I could hold physical gold to express my optimistic view on the "barbarous relic", I find it more convenient to play with ETFs. After screening a number of ETFs to express my positive gold view, I came to the conclusion that the iShares Gold Trust ETF (IAU) is the best play for my investment strategy.
Since I expect to hold this position over the long term, I pay a close attention to the expense ratio, which corresponds to the net annual fee I have to pay to the issuer. In this regard, IAU offers a relatively low expense ratio of 0.25%, compared with 0.40% (almost double) for GLD.
For retail investors trading small accounts, liquidity conditions in IAU are largely sufficient. The average daily volumes represent ~$141 million. For institutional investors, GLD may be a better fit, thanks to its stronger liquidity conditions, with an average daily volume totaling around $998 million.
As far as I am concerned, the size of my position is a drop in the ocean so I am comfortable to take a position IAU to play my bullish gold thesis.
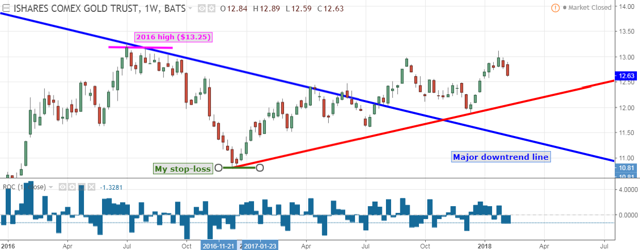
As can be seen at the end of the report, I built a long IAU position on Monday, 29 January 2018, at $12.89. I set a stop-loss level at $10.81 (i.e., -16% from my entry point), which corresponds to the 2016 low. And I have a profit target at $19.00 (+48%) from my entry point, which corresponds to the all-time high. This position has therefore a reward-to-risk-ratio of 3, which is skewed in my favor.
Let's have a look at the technical picture of IAU.
Source: Trading View
As can be seen in the weekly chart above, IAU dropped for a second week in a row last week, down 1.3% w/w.
Although momentum-based indicators have deteriorated of late, I am not worried over the long term. The fact that IAU was able to make a yearly high in January suggests that the uptrend is strong and sustainable.
But it is important to keep in mind that a retest of a downtrend line after a bullish breakout is not abnormal; rather, this is often the case. This is why I decided to set quite a wild stop loss (at $10.81) to make sure not be caught by the noise of the market.
On the downside, I see two key levels: $12, which corresponds to the uptrend line from the 2016 low (red line), and $11.50, which corresponds to the downtrend line from the all-time high (blue line). While I am not sure whether IAU will retest these levels, I would be tempted to lift the size of my IAU position should these two levels be tested. I hope this shows the extent to which I am convinced in the coming bull market in gold.
For the sake of transparency, I will update my trading activity on my Twitter account and post my trade summary at the end of each report.
Final note
My dear friends, thank so much for showing your support by pressing the "Follow" button and sharing this article. I look forward to reading your comments below.
Disclosure: I am/we are long IAU.
I wrote this article myself, and it expresses my own opinions. I am not receiving compensation for it (other than from Seeking Alpha). I have no business relationship with any company whose stock is mentioned in this article.


