Gold- Testing critical breakout level, again!

Below looks at the Gold/US Dollar ratio over the past 8-years. The ratio is testing a level that has been critical to Gold bulls for the past few years and we suspect it will be critical for it again at this level!
CLICK ON CHART TO ENLARGE
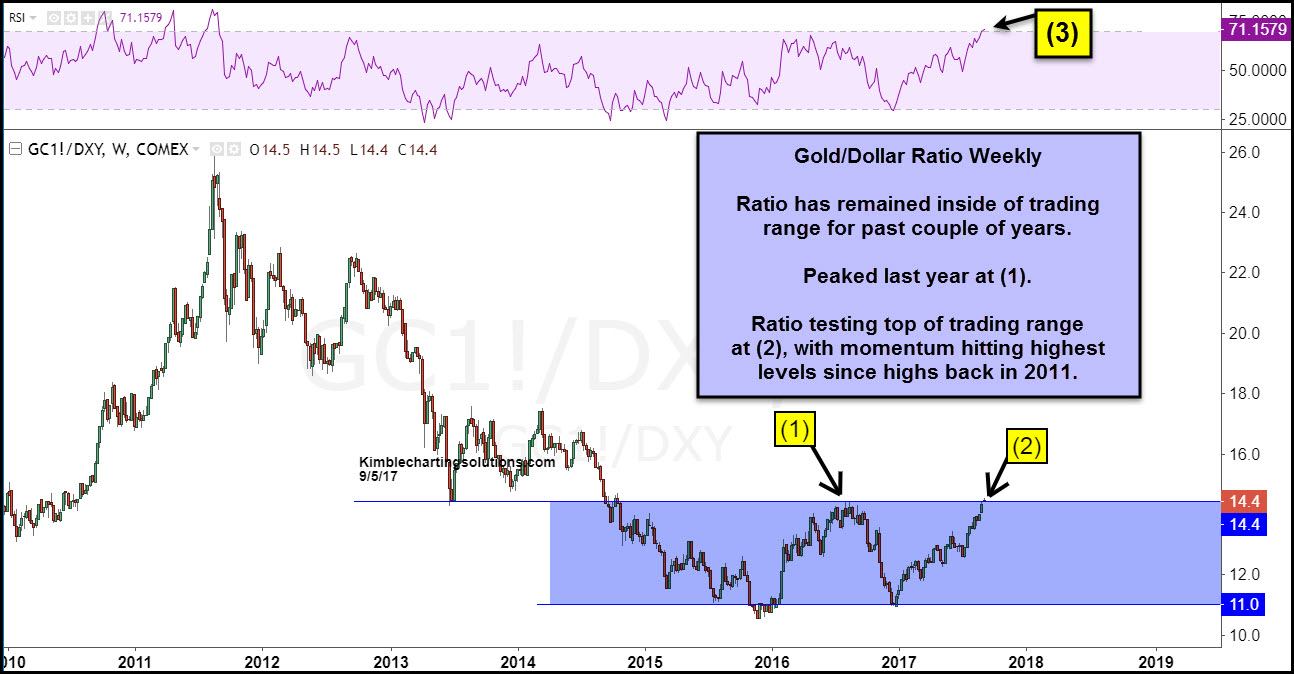
The ratio declined sharply from 2011 thru 2013, where it hit a low in the 14.4 level. After hitting this level, the ratio rallied and created a new trading range before turning weak again and breaking below 2013 lows in late 2014. Since breaking below the 14.4 level in 2014, the ratio has created another trading range for the past couple of years, shaded in blue.
The ratio is now testing 2016 highs at (1), again this week at (2), which happens to be the 14.4 level again. As it is testing the top of the trading range at (2), momentum is now hitting the highest levels in the past 6-years (2011 highs) at (3).
Gold bulls want this to be the case; The ratio could be forming a two-year base to push higher from. The Power of the Pattern would suggest this is one of the most important price points for the ratio in the past few years, as this is where the ratio has run out of gas in the past.
Gold bulls want it to be different this time!!!