Gold Holding Key Level, Commodities Are Positive And The Dollar Is Negative
The Gold Trust ETF has a positive but overbought weekly chart and is above my semiannual pivot at $120.36.
The commodities ETF has clawed out of bear market territory and now has a positive weekly chart but below its quarterly pivot at $15.60.
The long dollar ETF remains above its "reversion to the mean" at $25.01 with its annual pivot at $25.47.
Here are the weekly charts for the gold, commodities and the dollar ETFs.
The gold trust ETF tracks the spot price of gold and are said to be backed by gold bars in vaults in London.
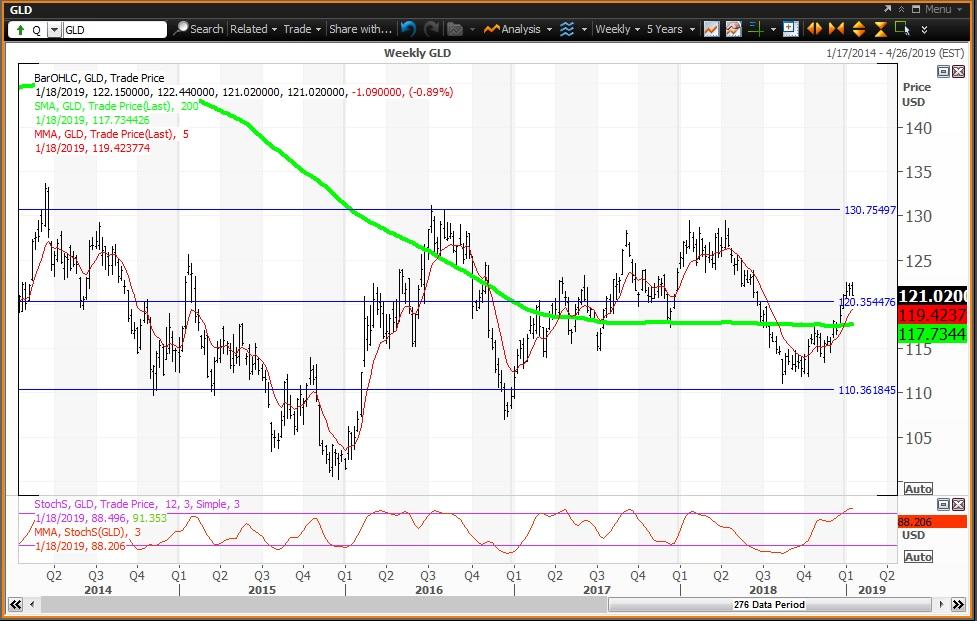
SPDR Gold Trust (NYSEARCA:GLD)
 Courtesy of MetaStock Xenith
The Gold ETF ($121.03 on Jan. 18) has a positive but overbought weekly chart with the ETF above its five-week modified moving average at $119.42 and above its 200-week simple moving average or "reversion to the mean" at $117.73. The 12x3x3 weekly slow stochastic reading rose to 88.21 last week up from 85.23 on Jan. 11 moving further above the overbought threshold of 80.00. If this reading rises above 90.00 it will become an "inflating parabolic bubble".
Investor Strategy: Buy weakness to my semiannual value level at $120.36 and reduce holdings on strength to my quarterly risky level at $130.76. My annual value level lags at $110.38.
The commodity ETF is heavily-weighted to energy by about 60%.
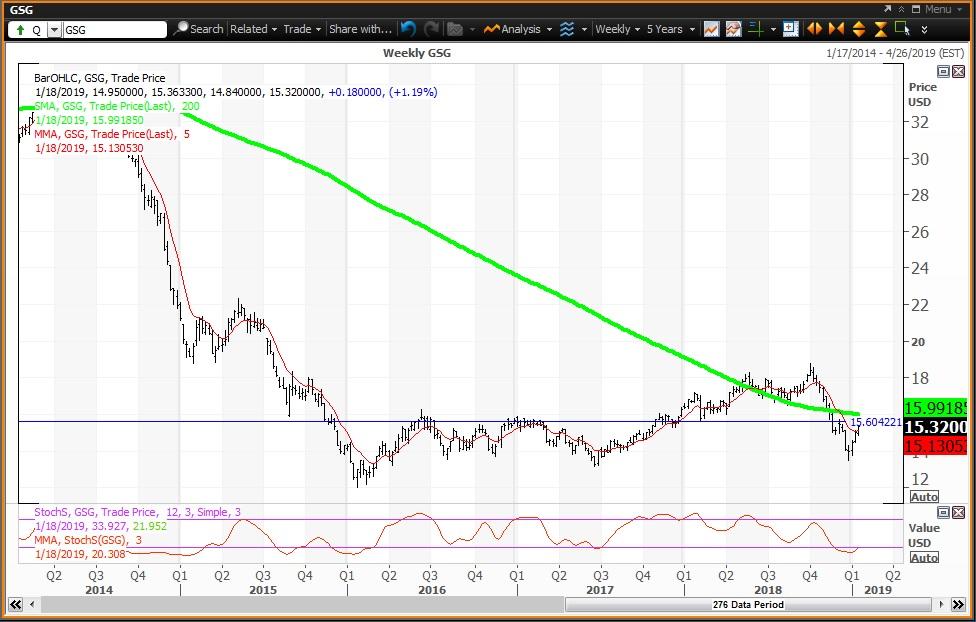
iShares S&P GSCI Commodity-Indexed Trust ETF (NYSEARCA:GSG)
 Courtesy of MetaStock Xenith
The Commodities ETF ($15.32 on Jan. 18) has a positive weekly chart with the ETF above its five-week MMA of $15.13 and still below its 200-week SMA or "reversion to the mean" at $15.99. The 12x3x3 weekly slow stochastic reading ended last week rising to 20.31 moving above the oversold threshold of 20.00. The reading below 10.00 as 2018 ended and 2019 began made commodities "too cheap to ignore".
The weekly chart for Nymex crude oil will have a positive weekly chart at the end of this week if Friday's close is above its five-week modified moving at $52.00. Oil is also above its 200-week SMA and "reversion to the mean" also at $52.00. The 12x3x3 weekly slow stochastic reading rose to 19.00 last week and will be above the oversold threshold of 20.00 next week. Crude oil is still in bear market territory 29.7% below its 2018 high of $76.90 set on Oct. 3 but is now also in bull market territory 24.8% above its Dec. 24 low of $43.30.
Investor Strategy: Buy GSG on weakness to my weekly value level of $14.68 and reduce holdings on strength to my monthly and quarterly risky levels at $15.59 and $15.60, respectively. The ETF needs to pop above the 200-week SMA at $15.99 to begin a momentum run-up.
The US Dollar ETF is a basket of currencies that includes the dollar vs. Euro, Japanese Yen, British Pound, Canadian Dollar, Swedish Krona and Swiss Franc.
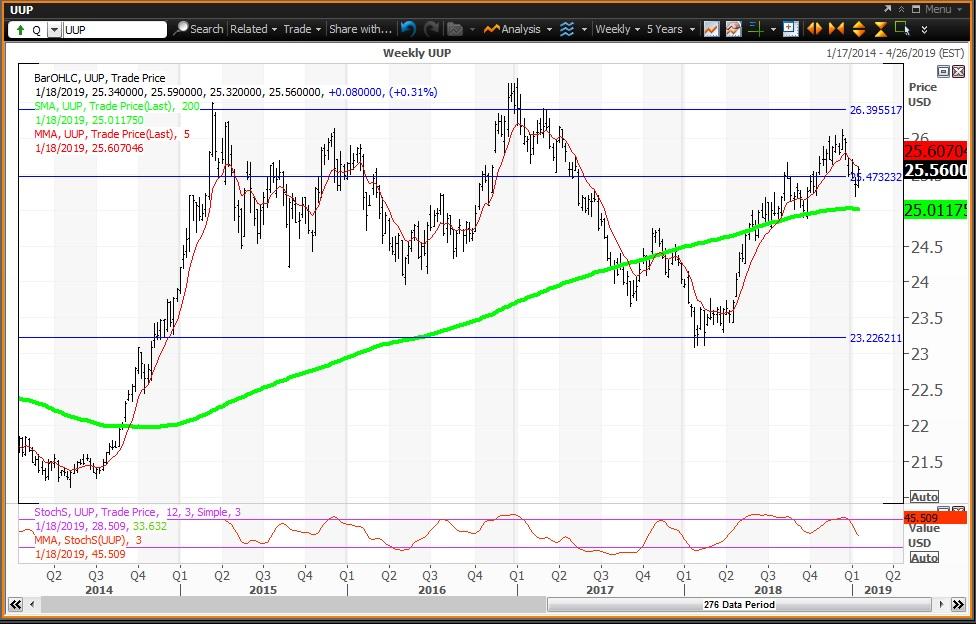
PowerShares DB US Dollar Index Bullish ETF (NYSEARCA:UUP)
 Courtesy of MetaStock Xenith
The Dollar ETF ($25.56 on Jan. 18) has a negative weekly chart with the ETF below its five-week MMA of $25.61 but above its 200-week SMA or "reversion to the mean" of $25.01. The 12x3x3 weekly slow stochastic reading declined to 45.51 last week down from 54.01 on Jan. 11. The ETF is above my annual pivot (or magnet) at $25.47.
Investor Strategy: Buy weakness to my quarterly value level at $23.23 and reduce holdings on strength to my semiannual and monthly risky levels at $26.39 and $26.49, respectively.
Disclosure: I/we have no positions in any stocks mentioned, and no plans to initiate any positions within the next 72 hours. I wrote this article myself, and it expresses my own opinions. I am not receiving compensation for it (other than from Seeking Alpha). I have no business relationship with any company whose stock is mentioned in this article.
Follow Richard Suttmeier and get email alerts