Industrial Commodities Support Higher Gold Prices
Even after the impressive 5-week rally, gold prices still have upside potential.
Some key industrial commodities are pointing the way higher.
Meanwhile, internal momentum remains supportive of the XAU rally.
After a strong start to the New Year, what some traders think is just a temporary short-covering rally gold will likely prove otherwise. As I'll argue here, the metal has enough support to continue in the coming weeks as we'll examine the factors underlying the rally which began over a month ago. They strongly suggest that gold's upside move is more structural than cyclical in nature. Meanwhile, some key industrial commodities are providing strong hints that this is an inflation-driven rally which has intermediate-term implications.
A brief review of the market's latest performance is in order first. Gold prices hit their highest since September last week, buoyed by a weakening U.S. dollar and surging oil prices. The dollar index (DXY) slumped to a three-year low on Friday, while the crude oil price rallied to its highest level since July 2015. The rally in the inflation-sensitive commodities hasn't yet captured enough mainstream investor interest to threaten the upward trend from the standpoint of contrarian sentiment. Most importantly, the supporting indicators for gold continue to reflect strength and are pointing to higher prices ahead for the yellow metal.
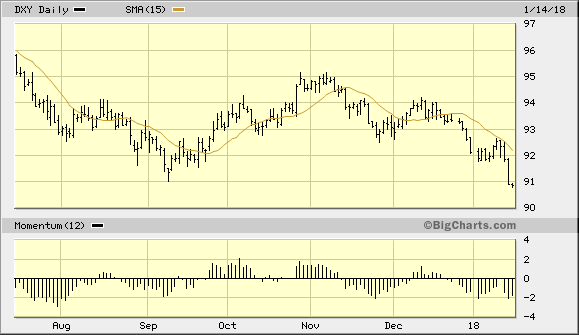
Source: www.BigCharts.com
In the latest session, spot gold gained 1 percent on Jan. 12 to close at $1,339 after hitting its highest level since Sept. 6. Gold rose for a fifth consecutive week last week and gaining 1.4 percent in the process. The latest rally was unaffected by President Trump's announcement that he would waive nuclear sanctions against Iran for the final time to give Washington and its European allies a chance to fix the "terrible flaws" of the 2015 nuclear deal.
While the dollar dropped to its lowest level in three years, it was announced that U.S. consumer prices recorded their largest increase in 11 months in December. The increase came on the back of strong gains in the cost of rental accommodation and healthcare, which bolstered investor expectations that inflation will accelerate in 2018. As discussed in my Jan. 2 commentary, the gradual return of inflation is a story which I believe will come increasingly into play for precious metal investors in the year ahead. Some members of the Federal Reserve are also apparently worried about this, as Boston Fed President Eric Rosengren warned Friday that the latest drop in U.S. unemployment could spark a surge in inflation.
Speaking of inflation, several inflation-sensitive markets which tend to lead gold rallies have been showing a conspicuous amount of relative strength versus the gold price. These include several leading industrial commodities like copper, steel, along with crude oil. While a weakening dollar and higher interest rates have been major factors in gold's recent gains, the strength shown in the industrial metals and oil price are providing additional confirmation that gold's intermediate-term (3-6 month) prospects are definitely improved.
Shown below is a daily graph which plots the 6-month performance of the various commodities mentioned here along with the gold price, which is signified by the black line. Historically, whenever crude oil and the industry metals are showing significant leadership, it has led to higher gold prices in the intermediate-term outlook. The strength in these commodities underscore the improvement to industry in the developed countries as the global economy continues to move further away from the deflationary undercurrents of previous years. A moderate, healthy dose of inflation (not the economically damaging runaway variety) is now discernible in the market for industrial commodities.
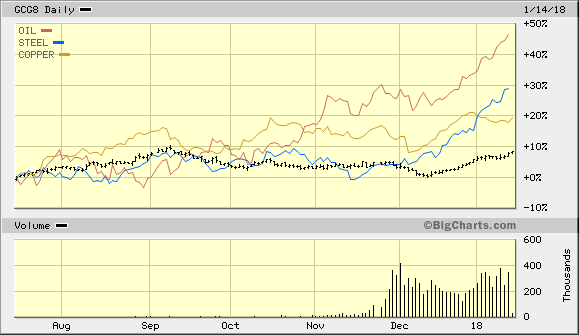
Source: www.BigCharts.com
On the managed money front, hedge funds and money managers raised their net long positions in COMEX gold and silver contracts in the week to Jan. 9, according to data provided by the Commodity Futures Trading Commission (CTFC). After months of reducing their exposure, funds are beginning to warm up to the metals after five weeks of higher prices. Their commitments haven't yet reached levels which would be considered dangerous (from a contrarian sentiment perspective) to the rally, however.
Meanwhile, the mining shares as a group are still in good shape as can be seen in the following graph. This features the primary short-term directional components of my gold stock internal momentum (GOLDMO) index, which is based on the 10-week new highs and lows of the 45 most actively traded gold stocks. The graph shown here measures the 4-week rate of change of those new highs and lows and is a good reflection of the incremental demand for gold stocks in general. Note also that the directional indicator is now decisively positive territory for the first time in several months, which is an encouraging sign for the short-term outlook.
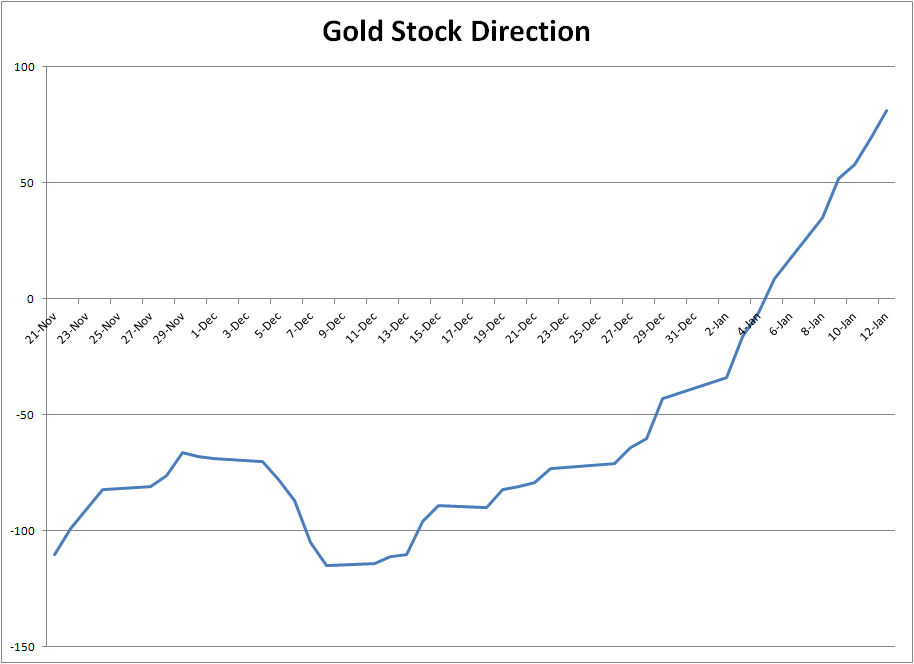
Chart created by Clif Droke
As previously discussed, a rising short-term directional indicator suggests that the near-term path of least resistance for gold stock prices is up. Therefore as long as this indicator is rising I recommend that traders maintain long position in the VanEck Vectors Gold Miners ETF (GDX), my tracking fund of choice for the XAU, using the 23.45 level as the stop-loss on a closing basis.
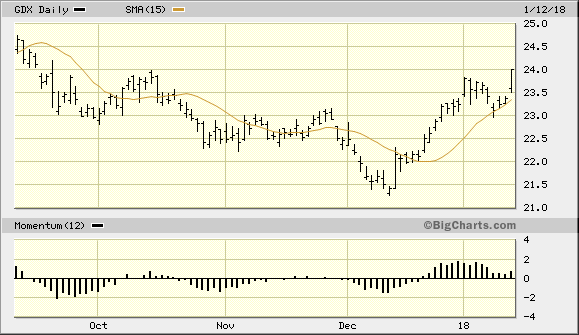
Source: www.Bigcharts.com
Concerning trading strategy, I previously recommended that technical traders book some profit in gold and the iShares Gold Trust ETF (IAU) following the 5% rally from the confirmed immediate-term buy signal on Dec. 21 (per the rules of the 15-day moving average trading method). I also recommend raising the stop loss on existing long positions to slightly under the $1,312 level in February gold, which is where the 15-day moving average is currently found in gold's daily chart.
For long positions in IAU, the stop loss should be adjusted to slightly under the $12.55 level where the 15-day MA currently is found in the daily chart. From here on, the 15-day moving average will serve as our guide for progressively raising the stop loss on our long position in IAU. No additional profits should be taken as I recommend simply riding out the rest of the rally and letting the stop-loss take us out of the remainder of the trading position.
Disclosure: I am/we are long IAU, GDX.
I wrote this article myself, and it expresses my own opinions. I am not receiving compensation for it (other than from Seeking Alpha). I have no business relationship with any company whose stock is mentioned in this article.