Market Melts Up As Economic Growth Weakens
Authored by Lance Roberts via RealInvestmentAdvice.com,
Market Back To Extreme Overbought
With earnings season in full swing, stocks continued to push higher this week. Even disappointing earnings from Starbucks, Apple, and Amazon couldn't keep the bulls down much. So far, the earnings season has pretty much aligned with expectations. As noted by FactSet:
"Overall, 56% of the companies in the S&P 500 have reported actual results for Q3 2021 to date. Of these companies, 82% have reported actual EPS above estimates, which is above the five-year average of 76%. If 82% is the final percentage for the quarter, it will mark with the fourth highest percentage of S&P 500 companies reporting a positive earnings surprise since FactSet began tracking this metric in 2008. In aggregate, companies are reporting earnings that are 10.3% above estimates, which is also above the five-year average of 8.4%."
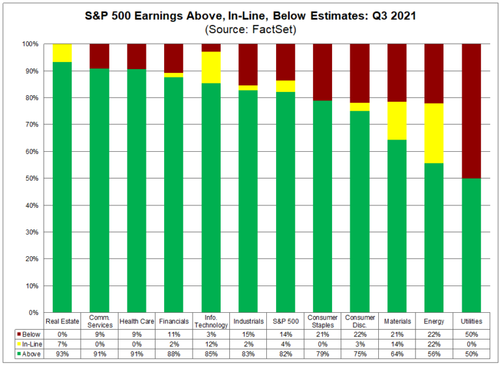
Earnings have indeed been very impressive, but as we will discuss, this quarter will likely mark the peak of growth for a while.
The more significant concern, however, remains the underlying technical condition of the market. While the rally has been impressive, rising almost 6% from the recent lows, the market is now back to more extreme overbought levels, trading 2-standard deviations above the 50-dma, and breadth remains troubling.
Chart updated through Friday.
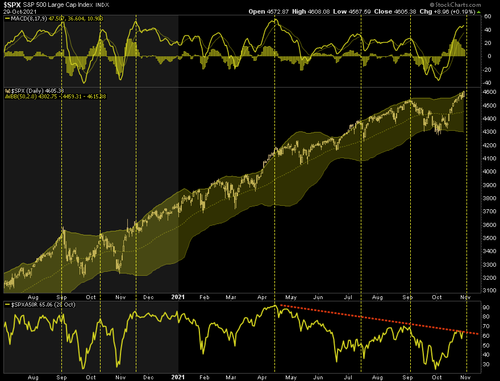
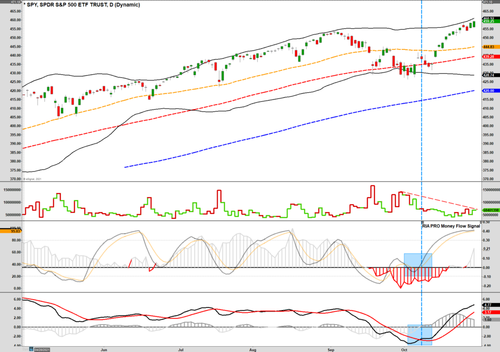
As noted last week, our "money flow buy signal" is near a peak and is close to triggering a "sell signal." With the MACD still positive, the signal suggests more consolidation than correction. However, a confirming MACD often aligns with short-term corrections at a minimum. Also, as shown, this entire rally from the recent lows has been on very weak volume, which suggests a lack of commitment.
At the moment, the bulls control the market, and downside risk is somewhat limited. However, that positioning is getting very aggressive.
Aggressive Positioning
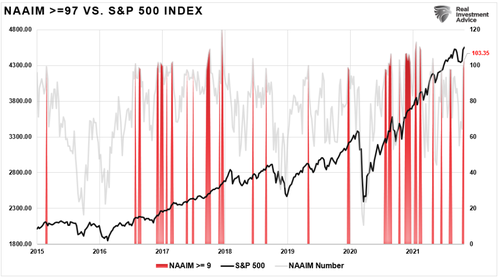
As noted, the current spat of economic weakness, combined with rising inflationary pressures, doesn't bode well historically for asset markets. However, the recent 5% correction did little to reverse more aggressive positioning. As shown below, the NAAIM Index (Fund manager positioning) has surged back levels that have previously aligned with short-term corrections or worse.
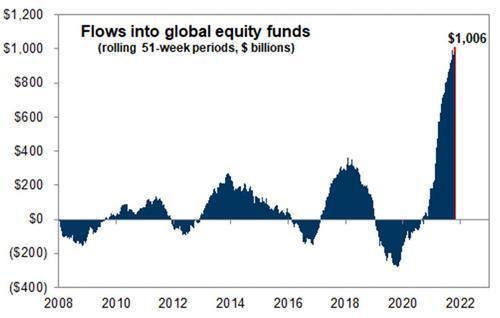
Such is not surprising given the massive inflows of capital into the market this year alone which have now exceeded $1 trillion. (Chart courtesy of Zerohedge)
Furthermore, with the window for corporate share buybacks opening in November, the primary buyer of equities will return to the market. Share buybacks are already at a record and could add as much as $90 billion to the total by year-end.

While capital flows certainly support the bullish narrative in the short-term, such can get easily reversed with a change in sentiment. As noted, with economic growth weakening and inflation increasing, the risk of a reversal is increasing. Moreover, the chart shows that previous spikes in inflation have not been kind to equity returns.
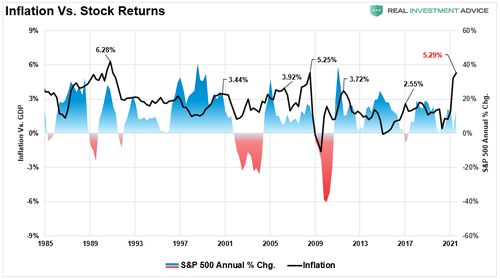
Of course, inflation also hurts economic growth which impacts profit margins.
Economic Growth Weakens
In March of this year, I penned an article entitled "Sugar Rush,"wherein we discussed the economy would run "hot" and then "crash." At the time, I received a lot of "pushback" on my "dire predictions" of economic growth later in the year. Furthermore, I followed that analysis asking if Q2 was the "Peak Of Economic Growth?" To wit:
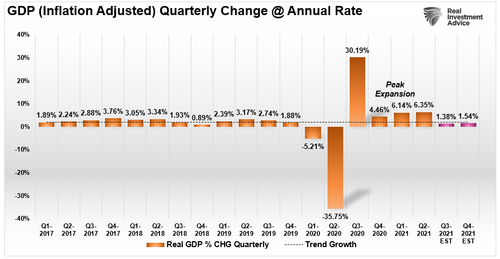
"Was the second quarter the peak of economic growth and earnings? If estimates are correct and the year-over-year 'base effect' fades, such suggests risk to current earnings estimates. The chart from a "Grossly Defective Product," utilizes the Atlanta Fed's current estimates for Q2-2021 GDP. The full-year estimates are from JP Morgan. Notably, the economy quickly slows to 2% heading into 2022."
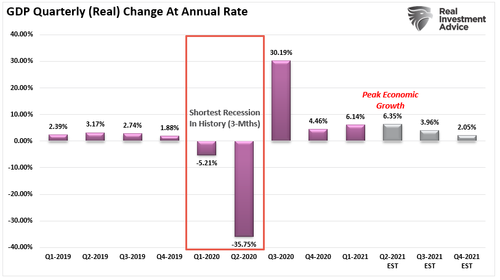
At that time, we estimated less than a 4% growth rate for the economy, with the Atlanta Fed well above 6%. On Thursday, the initial release of Q3 GDP came in well below even our lowered expectations of just 2%.
"Real gross domestic product (GDP) increased at an annual rate of 2.0 percent in the third quarter of 2021 (table 1), according to the "advance" estimate released by the Bureau of Economic Analysis. In the second quarter, real GDP increased 6.7 percent." - BEA
Notably, the "advance estimate" is derived from a sampling of economists' estimates. As actual data gets factored into the GDP calculation during the next two months, the growth estimates will get revised. As discussed in "The Bullish/Bearish Case," the weakness in the economic data suggests those GDP revisions will be lower.
The implications of weak economic growth are broad. Consumer sentiment will remain weak as inflationary pressures undermine consumption. Furthermore, the negative impact on earnings seems to elude investors currently.
Earnings Expectations Way Ahead Of Reality
Despite economic growth weakening as inflation increases, liquidity reducing, and profit margins under pressure, analysts continue to increase their earnings estimates. Currently, estimates for the Q4-2022 are $207/share according to S&P. As shown, that level will exceed the historical 6% exponential growth trend that contained earnings growth since 1950.
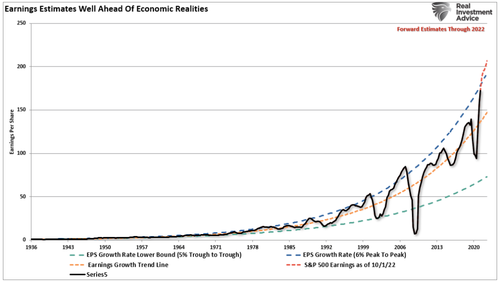
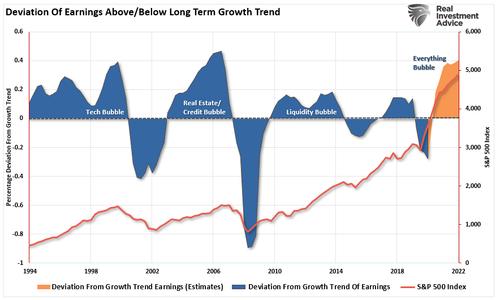
Currently, earnings expectations exceed the annual exponential growth trend by one of the most significant deviations on record. The only other two periods with similar deviations are the "Financial Crisis" and the "Dot.com" bubble.
With analysts extremely exuberant, there seems to be little concern for investors. However, I would caution against such complacency.
The chart below is the Economic Output Composite Index. The index comprises the CFNAI, Chicago PMI, ISM Composite, the Fed surveys, Markit Economic Index, Markit PMI, NFIB, TIPP Confidence, and the LEI. In other words, this indicator is the broadest indicator of the U.S. economy there is.
The last complete set of data is through September. Notably, the index peaked at the second-highest level on record. When October gets fully accounted for, the index will decline further.
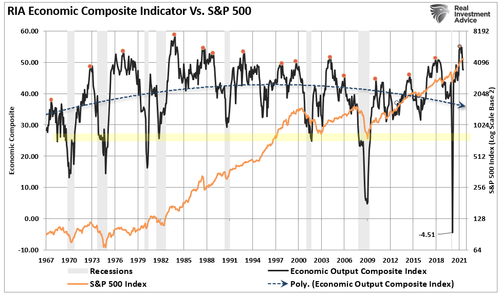
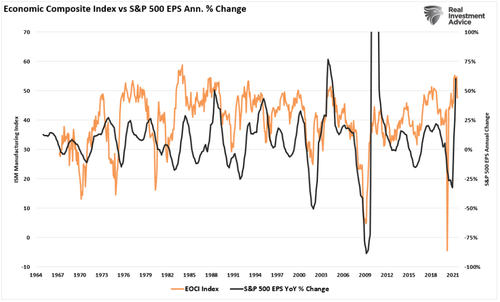
There are two critical takeaways from the EOCI index: 1) the stock market tends to either correct or fall into a bear market during reversals, and 2) there is a high correlation between the index and the annual change in earnings.
As we have noted previously, with the Fed beginning to "taper" bond purchases, the risk to investors continues to rise as earnings peak and profit margins contract.