Petro-Yuan Challenges The Dollar: Good For Gold
China is continuing its long-running assault on the US dollar as the world's global reserve currency.
The PetroDollar is backed by US Treasuries, which helps fuel US government deficit spending. Take that support away and the US dollar is in serious trouble. It looks like that.
Gold closing this coming week above $1337 is going to activate the price momentum into a bullish camp that is indicating targets at $1352 and $1367.
China is continuing its long-running assault on the US dollar as the world's global reserve currency. The focus recently has been the world's oil markets. China is the largest crude oil consumer, which gives it great influence over the oil markets. That influence was highlighted on March 26, 2018, when China launched trading of the Petro-Yuan to challenge the US Dollar and the PetroDollar. The South China Morning Post reported that the PetroYuan started trading on the Shanghai International Energy Exchange at 440.20 Yuan or $69.67 per barrel. PetroYuan futures traded more than 10 billion notional trades in the first hour, with than 23,000 contracts in the first hour, which signaled significant demand.
Graticule Asset Management Asia's Adam Levinson, managing partner, said the shift to the PetroYuan will be "a wakeup call" to those investors who have not been paying attention. It could deal a major blow to the already weakening US dollar.
The Yuan is already among the world's five most used currencies and the Chinese have been actively promoting the Yuan globally to replace the dollar. In 2015, in the first of a number of strikes against the dollar, Gazprom Neft, Russia's third largest oil producer, started using the renminbi for trade settlement instead of the dollar. Iran soon followed suit by dropping the dollar for trade settlement. Iran started using the Yuan and other foreign currencies for trade. China in 2015 also began to develop their new Silk Road, which could boost trade with Europe, further supplanting the dollar as the world's reserve currency, while increasing use of the Yuan and Euro.
China in 2015, however, still faced obstacles to making the Yuan the global reserve currency. In 2015, Nick Cunningham of Oilprice.com wrote,:
Despite accounting for much of the world's growth and demand in the 21st Century, China's oil imports have been all over the map in recent months. In April, China imported 7.4 million barrels per day, a record high and enough to make it the world's largest oil importer, but a month later, imports plummeted to just 5.5 million barrels per day.
That problem of massive fluctuation has since gone away and China's oil imports have stabilized.
US Dollar Under Threat
The PetroDollar is backed by US Treasuries, which helps fuel US government deficit spending. Take that support away and the US dollar is in serious trouble. It looks like that time has come.
In 2017 China became the world's largest consumer of imported crude oil, giving the PetroYuan much greater power than the PetroDollar. Beijing can now use much greater leverage over Saudi Arabia and other oil producers to use the PetroYuan instead of the dollar to sell their oil.
The Epic Economist reported in 2017, "The US Dollar's value depends massively on its use as an oil-trade vehicle. When that goes away, we will likely see a strong and steady decline in the dollar's value." Once the oil markets are upended, the Yuan will likely become the world's reserve currency, replacing the dollar.
Sungwoo Park, Bloomberg News oil analyst, said China hopes to challenge the dollar-based oil benchmarks, Brent Blend and West Texas Intermediate (NYSE:WTI), as part of the Chinese government's ongoing efforts to internationalize its own currency and global trade.
Park said that the main challenge or hurdle to achieving this goal is the apparent control the Chinese government has over the Yuan. Foreign investors are reluctant to jump into using the Yuan if the Chinese government has too much control over the currency. She said that the dollar has been the go-to currency for many decades, so it is "very hard for us to imagine the dollar losing its grip anytime soon. But it remains to be seen" what will happen.
China has many oil contracts trading already on various exchanges. The big three exchanges are Shanghai, Zhengzhou, and Dalian, and trading has been exploding. However, trading has mainly been driven by speculators, Park said. Therefore, investors are concerned about the abundance of speculation, since traders in oil are seeking a stable currency on which to base the value of oil. Such speculation and volatility is a major reason why the Yuan has not been able to establish itself as a benchmark for the oil market.
Yuan Rises, Dollar Falls, Gold Rises?
The US dollar has been steadily in decline against the Yuan for the past year or so. If the PetroDollar falls, gold could rise. The US has been off the gold standard since the early 1970s, but now physical gold is being reintroduced into the global monetary system in a major way. China is set to make the PetroYuan convertible into gold. This is good news for gold owners. Investors and oil traders will clearly prefer an investment backed by gold rather than one backed by the promises of a government, whether it's Washington or anywhere else. Fiat currencies are rarely preferred over currencies backed by a physical asset.
VC PMI Report: Gold
When we published our last report on Seeking Alpha on March 23, 2018, the price of gold was trading at about $1356. The numbers that we were getting using the Variable Changing Price Momentum Indicator (VC PMI) automated algorithm indicated to take profits at the Sell 1 (S1) level of the extreme above the mean of $1341, which was the average price for last week, into $1370 to $1385, which were the S1 and Sell 2 (S2) levels.
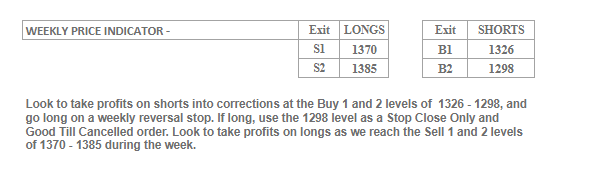
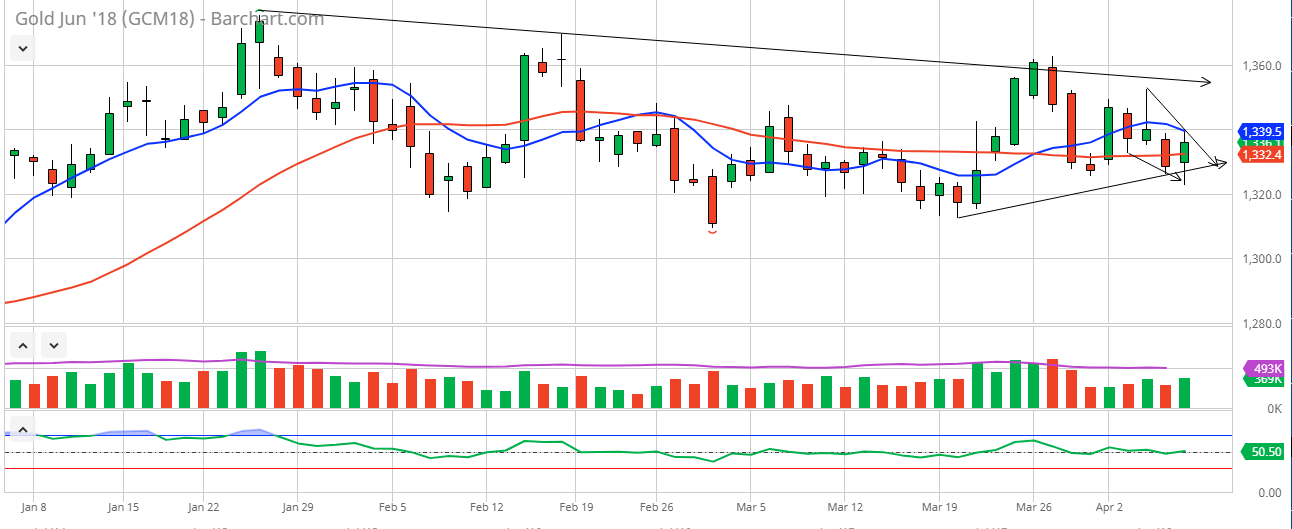
The action of the market did not have the strength to go up to $1370 to complete the expected high of $1370. It did come up to $1362.60 on the 27th and from that point on the market came down to test the extreme below the mean that we forecast in our March 23 report of $1326, making a low of $1325.50. That was the Buy 1 (B1) level that we were anticipating, and if you were short, these were the levels where the VC PMI recommended that you should cover your short positions. The B1 level gives us a 90% probability that a reversion to the mean will occur. We indicated that if the market were to come down below $1341 or the 9-day average of $1340, we could be testing this B1 level of $1326. We have seen the market come down to test that level on March 29 and once again on 6 April. After a second test of this extreme below the mean, the market rallied above the previous week's high and closed at $1336. What this shows is the accuracy of the VC PMI in forecasting movements in markets; in this case the gold market.
It looks like we have activated an area of demand in the gold market with a high probability that reversion to the mean will occur as we come into this week. The market made a high of $1352.50 on April 4 and then a low on the 3rd of $1332.70. When the market broke below this low, it came down into the level that we saw Friday of $1322.60 and reversed from there. The reversion to the mean appears to be occurring and as we come into next week, we should be able to get more market confirmation of the continuation of this pattern.
VC PMI Weekly S&D Levels for Next Week
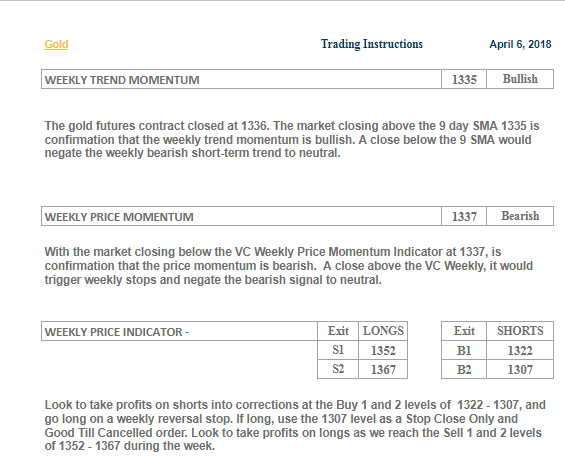
The gold futures contract closed at $1336. The first filter that we use is the 9-day moving average of $1335 and with the market closing above that price, we are coming into next week with a bullish sentiment. The VC PMI also tells us that if we close below $1335, this bullish pattern would be negated for this coming week. This tells us that the sentiment of the market has switched into the bullish camp. The methodology that the algorithm uses is systematic; if the price closes below this price, then the pattern or sentiment shifts to neutral. We use it systematically by following the market price direction and the relationship of the price to these levels that are produced daily, weekly and monthly by the VC PMI automated algorithm. This algorithm has taught me that it basically allows you to have the discipline to follow the market, instead of chasing the market, which 90% of traders do.
The second filter that we use is the average price or the mean pivot point, which we call the weekly price momentum indicator. The VC PMI has identified $1337 as this level. With the market closing at $1336, it was not quite able to reverse this trend, although we were close enough to keep an eye on it. The market is still bullish, but if it closes above $1337, it would revert this bearishness to neutral sentiment.
As we look at the price relationship to this average or mean, once we identify the average price, the algorithm is able to identify the extreme levels of volatility above and below the mean. The S1 level is $1352. If gold reaches $1352, the probability is 90% that the price will revert back from that level to the mean of $1337. The S2 level is $1367; if the price reaches this level, there is a 95% probability that the price will revert back to the mean of $1337.
We are able to use the VC PMI AI program to identify the level of supply that we can expect as we come into next week. With this methodology, which we teach our subscribers, we can identify the trigger points depending on the daily, weekly and monthly numbers. We use these extremes to enter and exit the market at the highest probability levels and use the structure from the VC PMI to trade confidently and without emotion.
The extreme below the mean is telling us that because the price of gold closed below the mean of $1337, if you are short and the market comes down to the B1 level of $1322, you should cover your short positions between the B1 level of $1322 and the B2 level of $1307. If the price of gold comes down to $1307, cover your short positions and go long, since there is a 95% probability that the price will revert back to the mean of $1337.
Conclusion
The conclusion that we have made as we come into next week is that the market has come down a couple of times to test the extreme below the mean of $1326. Closing this coming week above $1337 is going to activate the price momentum into a bullish camp that is indicating targets at $1352 and $1367. If we close above $1367, then we are opening up the larger fractals in price, including the February 16 highs of $1369 and the January 25 highs of $1375, which could be tested. These are the long-term targets that we published toward the beginning of October on Seeking Alpha. The targets in the gold market we are looking for are in the $1385 to $1404 area over the next six months of this year.
Disclaimer: The information in the Market Commentaries was obtained from sources believed to be reliable, but we do not guarantee its accuracy. Neither the information nor any opinion expressed herein constitutes a solicitation of the purchase or sale of any futures or options contracts. It is for educational purposes only.
Disclosure: I/we have no positions in any stocks mentioned, and no plans to initiate any positions within the next 72 hours.
I wrote this article myself, and it expresses my own opinions. I am not receiving compensation for it (other than from Seeking Alpha). I have no business relationship with any company whose stock is mentioned in this article.
Follow Scot Macdonald and get email alerts