Sandstorm Gold Is Worth A Bet
Sandstorm gold released its 4Q'17 results on February 15, 2018. For the three months ended December 31, 2017, revenues were $15.4 million compared with $16.5 million for the comparable period.
Production of gold equivalent was 12,032 Oz in the fourth quarter, down 9.2% compared with a year ago and down 15.8% sequentially.
Sandstorm is exploring the idea of becoming a dividend paying company soon. It is a significant move that should please shareholders.
I believe that SAND is more an excellent trading tool than a long-term investment.

Investment thesis
Sandstorm Gold (SAND) generates cash through two types of arrangements: royalties and streams. Its output is on a similar model used by Franco-Nevada (FNV). It is an exciting lending business model that provides a few benefits (reliability and fewer risks) for the company and potentially for its shareholders.
Sandstorm Gold has acquired a portfolio of 174 streams and royalties, of, which 20+ of the underlying mines are producing gold.
However, one caveat attached to a junior streamer such as Sandstorm Gold is that the company is often expanding its assets portfolio at the expense of its existing shareholders. The company has used its shares extensively to finance its expansion and turned this investment into a mediocre venture, at least while this expanding phase is still going on.
If we look at the recent acquisitions concluded in 2017, it is easy to see what I mean. The result is that the stock has not moved higher on a yearly basis, and shares outstanding are now close to 190 million.
Thus, I do not recommend investing long-term in the company until we see a change in the Sandstorm's investment strategy, which is not likely in 2018. I believe that SAND is instead an excellent mid-term trading tool.
The company should be accumulated on any weakness, especially under $4. Of course, the gold price is of paramount importance and should always be part of the investment decision.
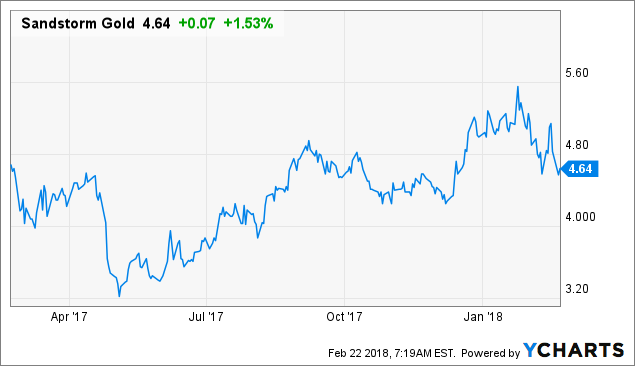 SAND data by YCharts
M. Nolan Watson, CEO said in the conference call:
We're pleased to see that 2017 was another record year despite 2017 being slightly harder than 2016 for mining companies to raise capital. This year, there were over 500,000 meters drilled on Sandstorm properties, which is an incredible amount of exploration. And again, our investors get the benefit of that exploration, with no additional payments.
Sandstorm - Financial results snapshot 4Q'17 - The raw numbers
| Sandstorm Gold | 1Q'15 | 2Q'15 | 3Q'15 | 4Q'15 | 1Q'16 | 2Q'16 | 3Q'16 | 4Q'16 | 1Q'17 | 2Q'17 | 3Q'17 | 4Q'17 |
| Total Revenues in $ Million | 15.29 | 15.43 | 12.09 | 9.86 | 13.38 | 15.71 | 16.82 | 16.46 | 18.82 | 16.07 | 17.94 | 15.45 |
| Net Income in $ Million | 0.8 | ?^'13.5 | ?^'5.5 | ?^'25.0 | 13.2 | 5.2 | 6.9 | 0.2 | 7.0 | ?^'1.9 | 4.8 | 0.71 |
| EBITDA $ Million | - | - | - | - | - | - | 16.6 | 8.3 | 17.8 | 6.6 | 14.7 | 2.8 |
| Profit margin % (0 if loss) | 5.4% | 0 | 0 | 0 | 98.4% | 33.1% | 41.1% | 1.2% | 37.0% | 0 | 26.6% | 4.6% |
| EPS diluted in $/share | 0.01 | ?^'0.11 | ?^'0.05 | ?^'0.20 | 0.10 | 0.04 | 0.04 | 0.00 | 0.05 | ?^'0.01 | 0.02 | ?^'0,01 |
| Cash from operations in $ Million | 8.1 | 9.5 | 8.2 | 5.0 | 9.7 | 8.9 | 10.3 | 10.1 | 11.9 | 11.1 | 11.9 | 9.9 |
| Capital Expenditure in $ Million | 0.05 | 0.00 | 1.95 | 0.02 | 1.59 | 0.9 | ||||||
| Free Cash Flow (Ychart) in $ Million | ?^'50.95 | 17.23 | 6.39 | ?^'159.19 | 3.49 | 4.43 | 21.02 | ?^'0.75 | 9.99 | 11.09 | 10,28 | 9.01 |
| Cash and short term investments $ Billion | 42.5 | 51.6 | 46.5 | 5.3 | 5.3 | 3.1 | 10.1 | 21.4 | 35.4 | 4.6 | 18,3 | 30.8 |
| Long term Debt in $ Million | 0 | 0 | 0 | 0 | 0 | 84 | 77 | 60 | 0 | 0 | 0 | 7.5 |
| Dividend per share in $ | 0 | 0 | 0 | 0 | 0 | 0 | 0 | 0 | 0 | 0 | 0 | 0 |
| Shares outstanding (diluted) in Million | 119.1 | 118.1 | 118.6 | 128.9 | 137.9 | 140.4 | 161.2 | 151.9 | 151.9 | 152.0 | 191.1 | 183.6 |
| GEOs | 1Q'15 | 2Q'15 | 3Q'15 | 4Q'15 | 1Q'16 | 2Q'16 | 3Q'16 | 4Q'16 | 1Q'17 | 2Q'17 | 3Q'17 | 4Q'17 |
| Production in Gold Equivalent Oz K GEO | 12.46 | 12.90 | 10.83 | 8.95 | 11.38 | 12.52 | 12.59 | 13.25 | 15.56 | 12.75 | 14.29 | 12.03 |
| Gold price realized $/Oz | 1,227 | 1,196 | 1,116 | 1,102 | 1,176 | 1,255 | 1,336 | 1,243 | 1,210 | 1,260 | 1,255 | 1,284 |
Source: company filing Annual report 2017 and Ycharts.
Note from the company:
On December 20, 2017, the company amended its revolving credit facility by increasing the facility to $150 million and adjusting its terms such that the facility can now be used for general corporate purposes. The tenure of the facility is four years and is extendable by mutual consent of Sandstorm and the majority of the banking syndicate.
As of February 15, 2018, the company had 183,559,416 common shares outstanding.
Gold Production and balance sheet details:
1 - Revenues

For the three months ended December 31, 2017, revenues were $15.4 million compared with $16.5 million for the comparable period in 2016. For the full 2017 year, gold sales reached record revenues of $68.3 million and cash flow of $44.8 million.
Liquidity and Capital Resources as of December 31, 2017:
As of December 31, 2017, the company had cash and cash equivalents of $12.5 million (December 31, 2016 - $21.4 million) and working capital of $31.9 million (December 31, 2016 - $23.8 million). As of the date of the MD&A, only $7.5 million has been drawn under the Revolving Facility, leaving $142.5 million undrawn and available for future acquisitions and general corporate purposes.
Guidance 2018:
Based on the company's existing royalties, attributable gold equivalent production for 2018 is forecast to be between 50K Oz and 60K Oz. The company is predicting gold equivalent production of approximately 125K Oz per annum in 2022.
2 - Free Cash Flow
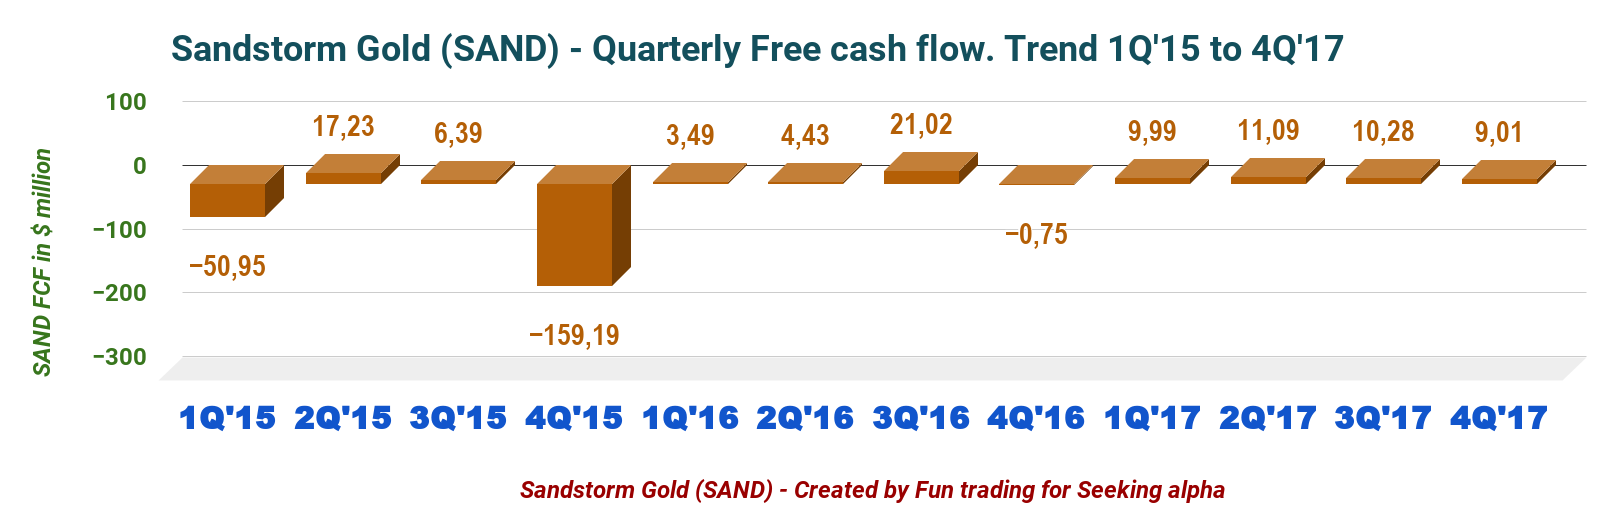 One crucial financial element that deserves some serious attention is the ability of the company to deliver sufficient free cash flow. On a yearly basis, SAND FCF is now $40.37 million, which is impressive for a young company like Sandstorm.
Free cash flow is an important hint that should always be carefully evaluated when looking at a long-term investment. FCF should be sufficient, and of course, positive if we can consider SAND as a long-term investment.
SAND is passing the FCF test.
3 - Gold production details
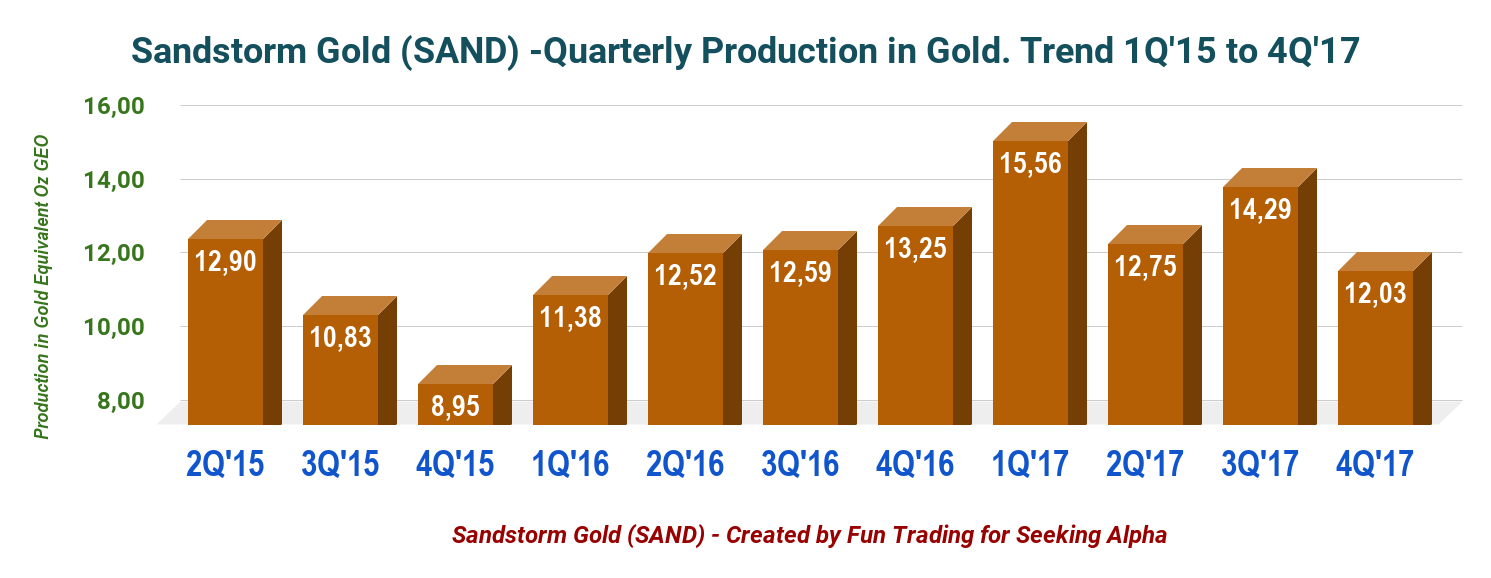
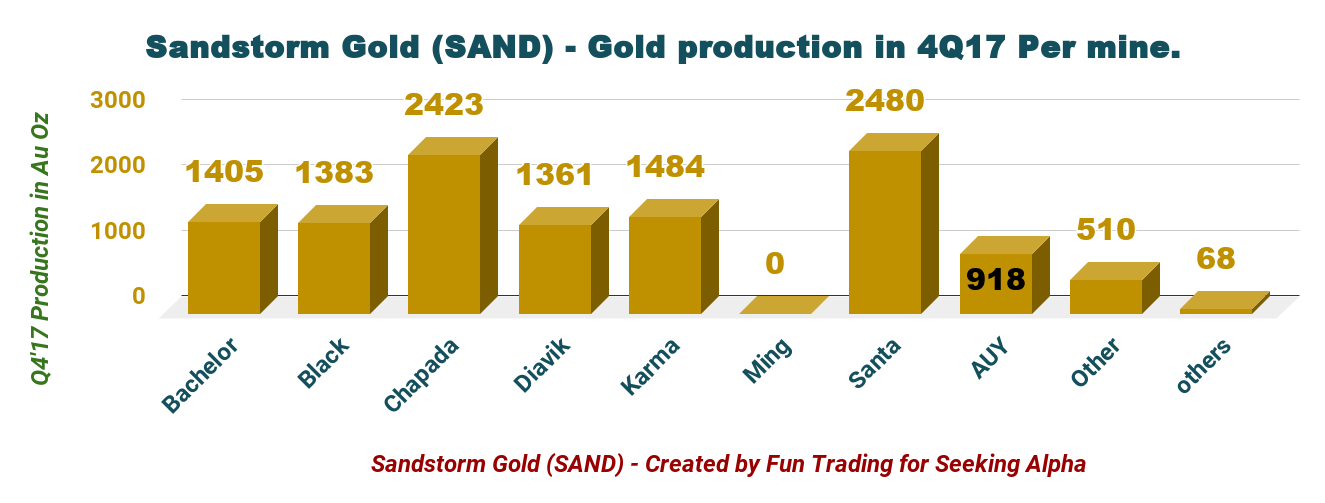
Production of gold equivalent was 12,032 Oz in the fourth quarter, down 9.2% compared with a year ago and down 15.8% sequentially. Output for the 4Q'17 was quite disappointing.
4 - Debt, shares buyback, and potential dividend
One strong element is that the company had virtually no debt ($7.5 million used from the $150 revolver) and was able to repay its debt by issuing equity and cash flow. However, the caveat for shareholders as I explained it above is that by issuing equity the stock suffered some immediate dilution.
Nolan Watson, the CEO, said in the conference call that the company is still focusing on its share buyback program versus paying a dividend. However, the company may start paying a dividend after all:
Meanwhile, our board has begun actively analyzing the potential of becoming a dividend paying company by 2019. We have moved out of the phase of haphazardly thinking about it into the phase of actively analyzing it. This was also one of the motivations for us changing and updating our revolving debt facility.
Becoming a dividend paying company is an essential step in my opinion and should be something that Sandstorm Gold should be focusing on that issue.
Commentary and technical analysis
Sandstorm Gold is an excellent choice even if the risk of dilution remains high.
Let's put it this way; the company has no debt and a good growth prospect until 2020. Risks of an extreme downside are limited to an eventual crash in gold price under $1,000 per ounce, which is remote at best. The company is debt-free, and its streams and royalties portfolio are well diversified. Thus, the strategy is quite simple for an average investor.
Buying around $4.25 - $4 or lower and take profit based on a simple technical analysis interpretation. If your timing is wrong, then wait patiently and accumulate.
Technical analysis:

SAND is forming an ascending channel pattern also called a rising channel with resistance at $5.75 and support at $4.60. Long-term lower support is $4.30.
Ascending channel patterns or rising channels are short-term bullish.
The stock moves higher within an ascending channel, but these patterns often form within longer-term downtrends as continuation patterns. The ascending channel pattern is often followed by lower prices, but only after a downside penetration.
In SAND's case, the stock presents good support between $4.25 and $4.60, and it would take a real bad news to penetrate this support.
Shareholders have unfortunately become accustomed to this type of "bad behavior" on the chart before, with a sudden and painful drop in value from a new deal expecting to be a game changer. See the sharp slide on April 26 after the newly announced merger with Mariana.
It is hard to recommend a long strategy with SAND because I have been disappointed by this unpredictable volatility that comes as a surprise. However, I see an opportunity for the long term if the stock trades below $4. Of course, the gold price is of paramount importance and should always be part of your investment decision.
Important note: Do not forget to follow me in SAND and other gold miners or streamer. Thank you for your support, it is appreciated.
Disclosure: I/we have no positions in any stocks mentioned, but may initiate a long position in SAND over the next 72 hours.
I wrote this article myself, and it expresses my own opinions. I am not receiving compensation for it (other than from Seeking Alpha). I have no business relationship with any company whose stock is mentioned in this article.