Six charts screaming buy gold


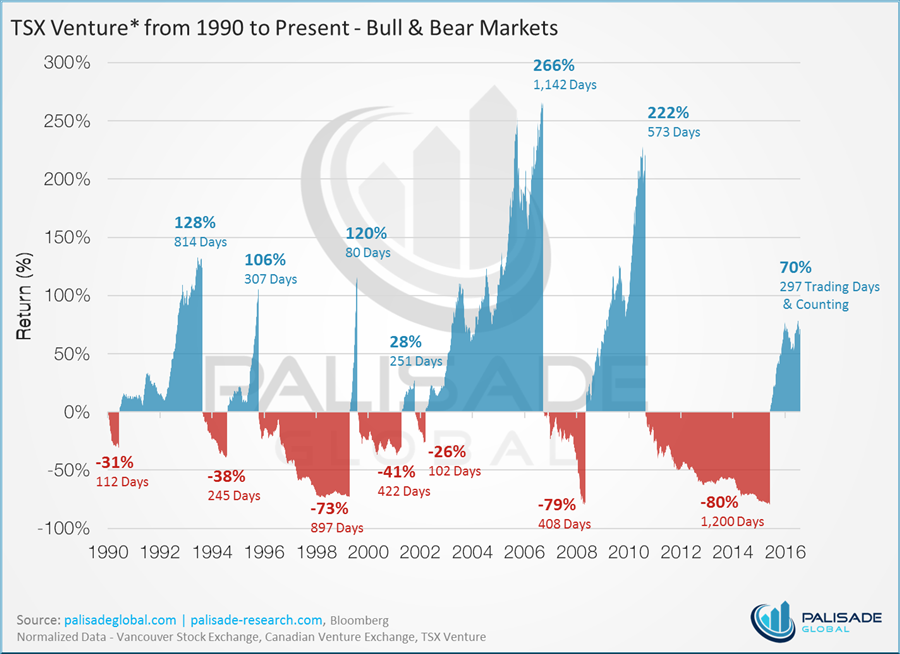
1.) Long-term readers of Palisade Research know this chart well. We are now 297 trading days into a bull market on the TSX Venture Exchange, as depicted by our 1990 to Present - Bull & Bear Markets Chart. During that time, the TSX Venture has had some sell-offs, but history says this is inevitable. In fact, we are currently mired in a several month long pull-back. So what comes next? We took a look at the USD and the US equities market to formulate an idea.
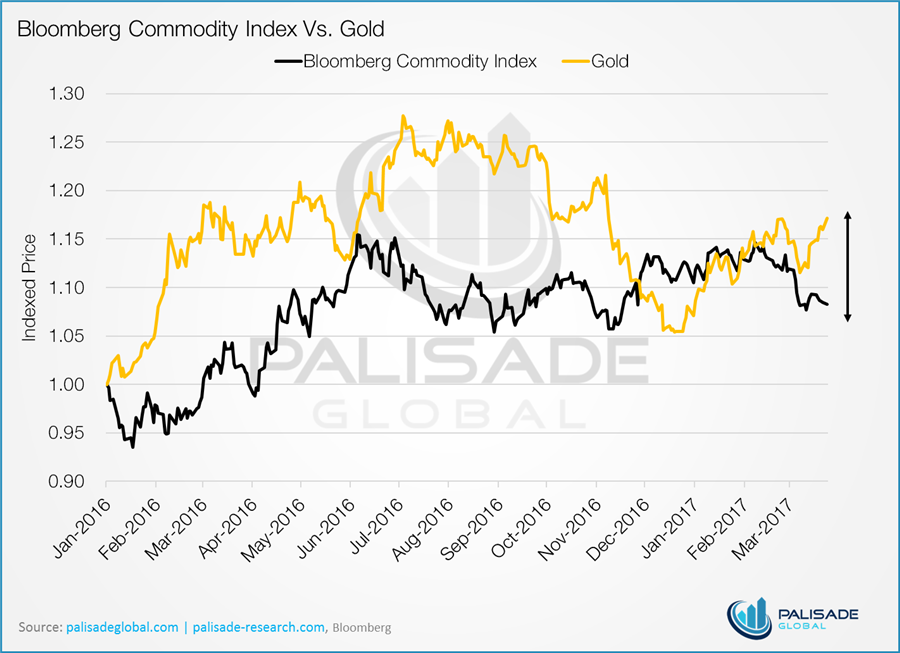
2.) The Bloomberg Commodity Index (BCI) is a diversified price index distributed by Bloomberg Indexes. Since January 2016, gold has outperformed its peers, with a significant divergence taking hold. However, the recent pull-back has allowed the BCI to catch-up. That is until recently, when gold started to charge ahead, yet again.
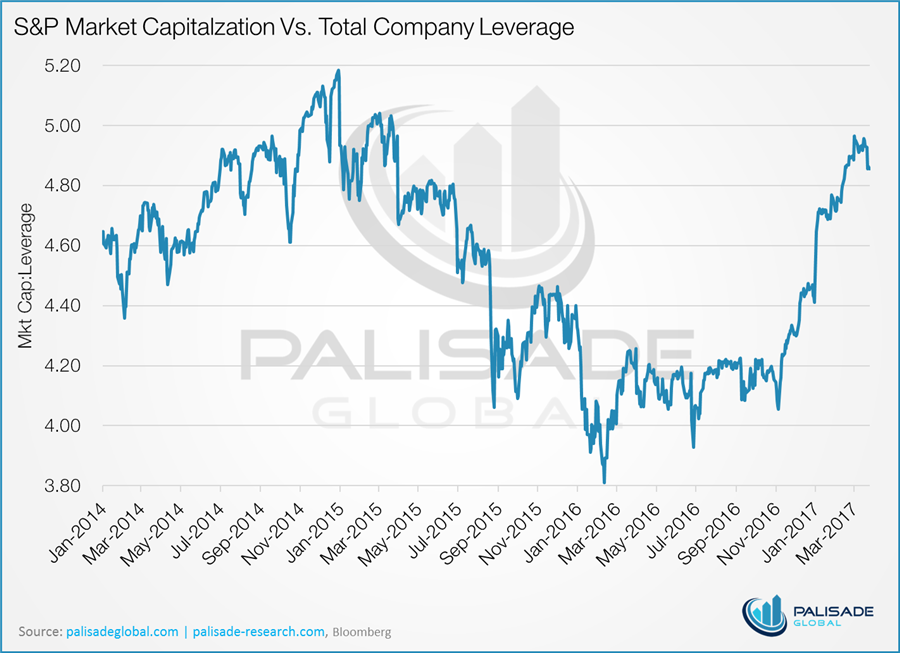
3.) Gold bugs are paying close attention to the US equity markets, which have been embroiled in a multi-year bull market. If money continues to pour into the S&P, little capital is left to fuel a gold bull market. The following chart looks at company leverage, calculated as debt/EBITDA. This is a common metric to assess a company's ability to pay off its debt. This ratio has been increasing in tandem with the market caps of the S&P 500 companies. When looking at these two numbers as a ratio, it appears debt loads are reaching capacity, and can no longer fuel growth. It seems there is still some runway, but the downtick suggests a swift fall.
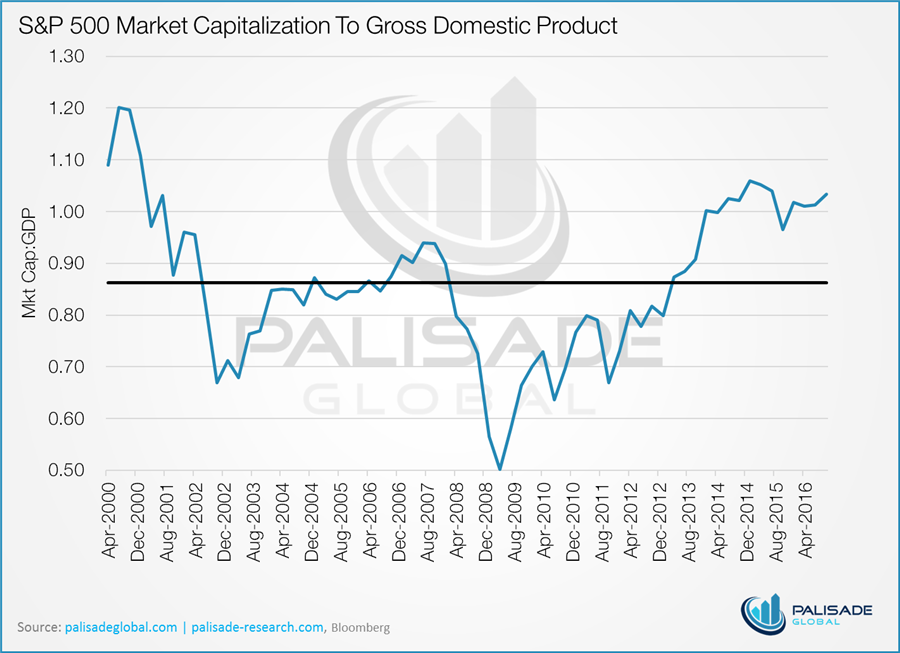
4.) Another key indicator and Warren Buffett's favourite - The S&P 500 market cap to GDP ratio. This ratio is often used to gauge market sentiment and determine if the overall market is under or overvalued. When the metric is greater than 100%, it is often a sign the market is overvalued. In 2000, the ratio was 153%, and the markets fell sharply due to the dot-com bust. We are currently over 100%, a good deal higher than the average of 0.86.
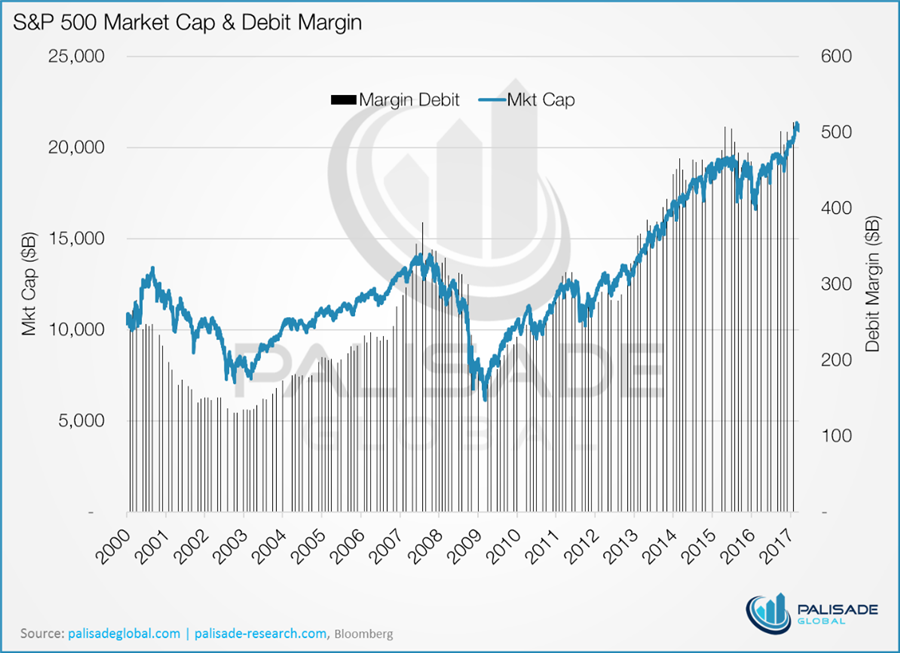
5.) But maybe one of the most compelling cases to be made for exhaustion in the bull market can be seen when looking at margin. When buying on margin, investors borrow funds from their brokers to buy shares. The debit margin is the total money owed by an investor; the higher this number, the more leveraged he is. Buying on margin has been a good bet to date, however, margins are hitting all-time records, and investors are very vulnerable to any sort of market shock. Selling will be exaggerated as margins unwind, which in turn can extend the length of any sort of market downturn.
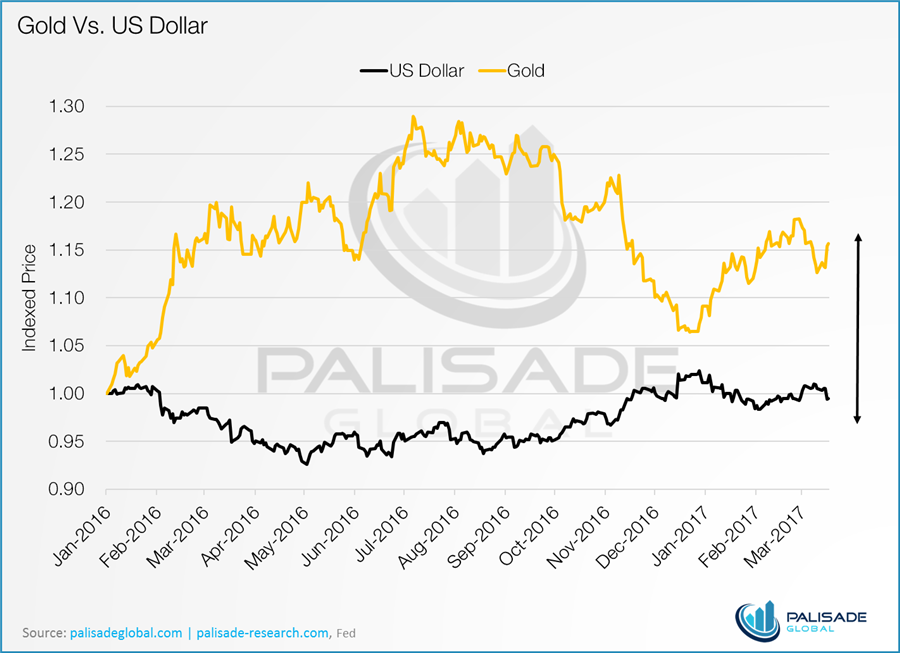
6.) No one knows what will mark the top for US equity markets. We feel they are due for a major correction, but that correction could be months or years away. What we can say for certain is that the USD is weakening despite the Fed increasing rates. The weakness can be attributed to Yellen's dovish tone. Another major factor? Trump's repeal of Obamacare was a major pledge, and its failure only emphasized the rifts within the GOP, which has the potential to derail other major promises, including tax reform and spending. In times of uncertainty, gold is the go to safe haven for every investor!