Top 10 copper mining companies in 2016
Preliminary production by the top 10 copper mining companies compiled by IntelligenceMine totalled 9,448 kilotonnes of copper in 2016. That represents a 4% increase compared to 2015 and makes up ~49% of global copper production that reached 19,400 kt last year.
Six out of 10 companies increased their copper output while four of them declined. All companies in the Top 10 that disclose production costs reported significant reduction in copper unit costs.
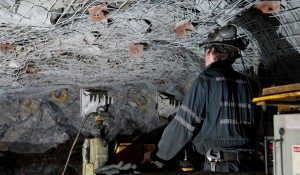
1. Codelco 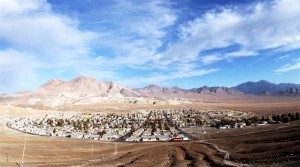 Salvador, Codelco's smallest mine. (Image courtesy of Codelco)
| Chilean state-owned miner Codelco holds first place worldwide in terms of attributable copper mine output with preliminary estimates of 1,827 kt of copper produced in 2016, including Codelco's stake in Minera el Abra and Anglo American Sur S.A, - an approximate 3% decline on 2015 (1,891 kt).This drop was mainly due to lower production coming from El Abra, Anglo American Sur and Andina division, partially offset by higher production in Salvador, El Teniente and Radomiro Tomic divisions. During 2016, Codelco's cash cost was $1.26 per pound, compared to $1.39 per pound in 2015. A decrease of 9% primarily attributable to lower operational costs and favourable exchange rate movements. |
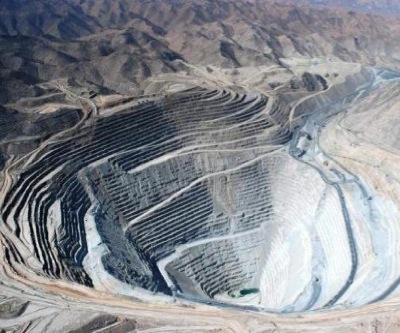
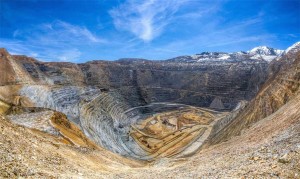
2. Freeport Cerro Verde copper mine, Peru. Image: Freeport
| Headquartered in Phoenix, Ariz., Freeport-McMoRan Copper & Gold Inc. ranks second in global copper competition. It produced about 1,696 kt of copper in 2016 (based on net equity ownership, including discontinued operations), or about 12% higher compared to 2015 (1,514 kt). This significant growth was achieved because of the Cerro Verde expansion project that achieved capacity operating rates during first-quarter 2016, as well as copper production increase at Grasberg operations currently mining the final phase of the Grasberg open pit, which contains high copper and gold ore grades. Consolidated average unit net cash costs (net of by-product credits) for FCX's copper mines (including Tenke) of $1.26 per pound of copper in 2016 were 18% lower than unit net cash costs of $1.53 per pound in 2015, primarily reflecting higher by-product credits and higher sales volumes from Cerro Verde and Grasberg. |
3. Glencore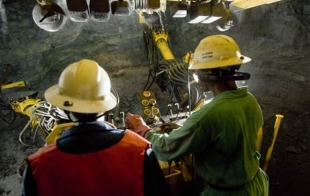 Drilling at Kamoto UG copper mine, DRC. Image: Katanga Mining
| In third place, Swiss-based Glencore International plc with copper production from its own sources of ~1,288 kt (approximate number; efforts were made to calculate attributable Glencore's total mined copper originated from Copper, Zinc and Nickel Operating Divisions, but due to a complex nature of the company's assets, the exact figure might be slightly different), which is 2% lower than in 2015 (~1,311 kt), reflecting the production suspensions at African Copper, partly offset by improved grades and volumes at the South American assets. Glencore's copper unit production costs were $0.87 per pound in 2016. |
4. BHP Billiton
Escondida copper mine, Chile. Image: BHP | Ranking fourth, Anglo-Australian BHP Billiton reduced its copper output by 6%, from 1,179 kt in 2015 to 1,113 kt in 2016 calendar year.This decrease was due to reduced volumes at Olympic Dam, maintenance at Pampa Norte and lower copper grades, as planned, at Antamina. Significant reduction in C1 cash cost during half-year ended December 31, 2016 was mainly related to the increase in estimated recoverable copper contained in the Escondida sulphide leach pad following commissioning of the Escondida Bioleach Pad Extension project and a US$120 million planned build of mined ore ahead of the commissioning of the LCE project. |
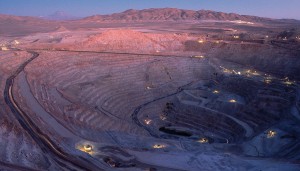
5. Southern Copper
Toquepala copper mine, Peru. Image: Southern Copper | Holding fifth place, Southern Copper Corporation, a subsidiary of Grupo M?(C)xico, increased its copper production by record 21%, from 743 kt in 2015 to 900 kt in 2016. This increase was driven by the expansion of the Buenavista mine, which increased its production by + 57%. Southern Copper's cash cost per pound for 2016 when calculated with by-product revenues was $0.95 per pound, compared to $1.11 per pound in 2015, a decrease of 14.4%. |
6. KGHM
Morrison mine, Sudbury, Canada. Image: KGHM | Sixth-ranked Poland-based KGHM Polska Mied?? Group produced 677 kt of payable copper in 2016, which is 6% lower than in 2015 (718 kt). The decrease in production of payable copper in 2016 as compared to 2015 was due to the lower production of cathodes by KGHM Polska Mied?? S.A. and lower production in KGHM International Ltd. mainly due to lower processing of ore by the Robinson mine. C1 cost of producing copper in concentrate reduced by 11%, which was impacted by a weakening in the PLN and savings initiatives undertaken by KGHM. |
7. Rio Tinto
Bingham Canyon mine, Utah, USA. Image: Rio Tinto |
British-Australian Rio Tinto (LSE:RIO, ASX:RIO) sits in seventh place and increased its attributable mined copper output by 4%, from 504 kt in 2015 to 523 kt in 2016. Production increased at Bingham Canyon, but declined at Escondida. The Grasberg mine put out zero tonnes of copper for Rio Tinto last year. |
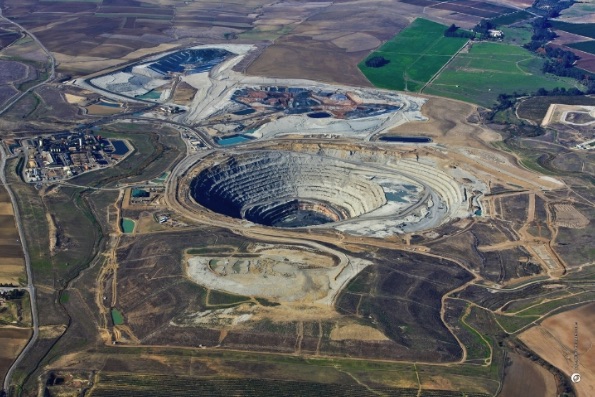
8. First Quantum
Las Cruces copper mine, Spain. Image: First Quantum | First Quantum's record copper production driven by ramp-up of Sentinel, higher Kansanshi volumes with record annual production at Las Cruces, allowed this ambitious company to broke into the Top 10 copper producers list. First Quantum landed eighth in 2016. Attributable copper production of 494 kt (including discontinued as of June 2016 Kevitsa mine production) was higher than 2015 by 29% (383 kt). The average copper production C1 cash cost of $1.06 per lb (including Sentinel) was significantly lower than C1 cash cost of $1.21 per lb in 2015, reflecting impact of acid consumed from the smelter, lower fuel costs, lower treatment charges associated with external smelters, reduced freight charges at Kansanshi and improvement in operating costs from cost savings initiatives implemented at all operations. |
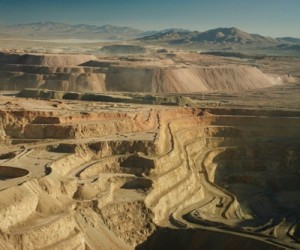
9. Antofagasta
Zaldivar copper mine, Chile. Image: Barrick | Attributable copper production for ninth-place Chilean-based Antofagasta plc in 2016 was 477 kt, a 15% increase compared with 415 kt in 2015. This increase in production was because of the successful integration of Zald?-var and the ramp-up of Antucoya - alongside the completion of the expansion of Centinela Concentrates. Group net cash costs were $1.20/lb or 20% lower than in 2015. This reflected the lower cash costs before by-product credits, higher gold production and higher realised prices for gold and molybdenum, partly offset by lower molybdenum production. |
10. Vale
Conveyor belt at Sossego copper mine, Brazil. Image: Vale | Brazilian Vale is no.10 in the Top 10 list and produced 453 kt of copper in 2016, or 7% more than in 2015 (424 kt). The strong production performance was a result of the record production in both the Sudbury and Salobo operations. |

Anglo American - a long-time member of the Top 10 copper miners club - lost its position and dropped out of this list landing eleventh in 2016. Anglo American reported attributable total copper production, including the company's share in the Collahuasi joint venture, of 400 kt in 2016, which was 18% lower than in 2015.
This was mainly because copper production at Los Bronces was 24% lower as the operation faced a number of challenges, as well as due to Mantoverde and Mantos Blancos mines sale completed in September, 2015. Anglo American's copper cash costs reduced by 11% as a result of cost-reduction initiatives and productivity improvements across all operations.
Anglo American is followed by Russian mining giant Norilsk Nickel which produced 360 kt of copper in 2016.
For more information access the IntelligenceMine database. Get information on more than 13,600 listed and private company profiles, 34,400 mines, projects and processing facilities and 1.6m regulatory and source documents. Learn more about IntelligenceMine.