After Recent Gold High - Where to Now? / Commodities / Gold and Silver 2021

Gold is suffering a hang-over afterit’s early January highs, while the EUR/USD pair is buckling - so when golddeclines, where will its bottom be?
After injecting itself with JanetYellen’s stimulus sentiment, gold came down from its highs on Friday (Jan. 22).
And like the GDX ETF, it’s important toput gold’s recent run into context. For starters, gold is stilltrading below its August declining resistance line, it topped at itstriangle-vertex-based reversal point (which Iwarned about previously ) and the yellow metal remains well-off itsJanuary highs.
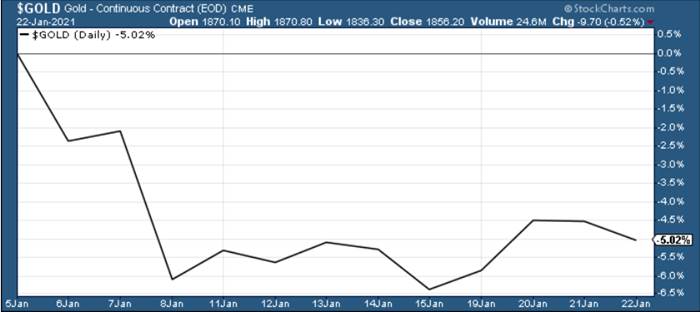
Figure1
Looking at the chart below, we can seegold approaching the upper trendline of its November consolidation channel.
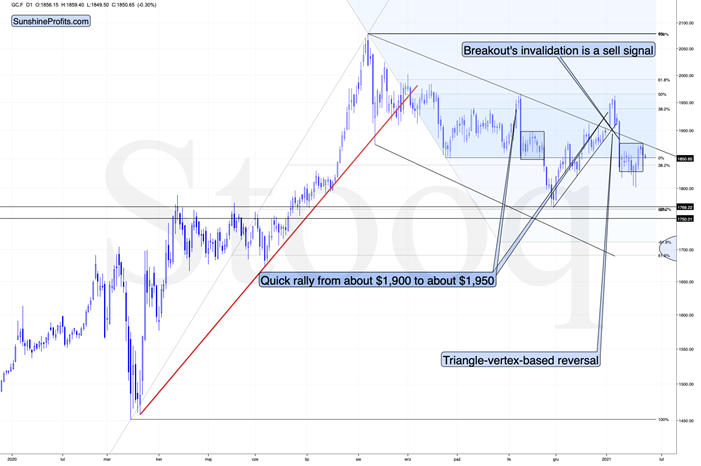
Figure2
I marked the November consolidation witha blue rectangle, and I copied it to the current situation, based on the end ofthe huge daily downswing. Gold moved briefly below it in recent days, afterwhich it rallied back up, and right now it’s very close to the upper right cornerof the rectangle.
This means that the current situationremains very similar to what we saw back in November, right before anotherslide started – and this second slide was bigger than the first one. I wroteabout this previously (Jan. 21), saying that there’s a good reason for goldto reverse any day (or hour) now.
And what happened last Friday?
Well, gold fell by 0.52% as the Yellen -led intoxication began to wear off. Gold also continues to decline in today’spre-market trading, despite a small move lower in the USD Index.
Also adding to the upswing, one of themost popular goldindicators – the stochastic oscillator (see below) dipped below 20last week. Itching to move off oversold levels, the yellow metal responded inkind. However, if you analyze the green arrows below (at the bottom of thechart), you can see that the first green arrow has a red arrow directly aboveit (marking gold’s November top).
Currently, the stochastic oscillator isright near that level, and with November acting as a prelude, the yellow metalcould suffer a similar swoon in the coming days or weeks.
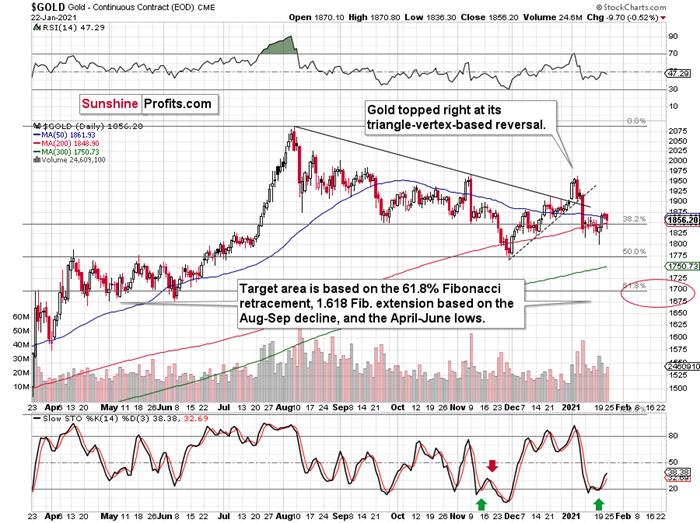
Figure3 – Gold Continuous Contract Overview and Slow Stochastic Oscillator ChartComparison
Back in November, gold’s second decline(second half of the month) was a bit bigger than the initial (first half of themonth) slide that was much sharper. The January performance is very similar sofar, with the difference being that this month, the initial decline that we sawin the early part of the month was bigger.
This means that if the shape of the pricemoves continues to be similar, the next short-term move lower could be biggerthan what we saw so far in January and bigger than the decline that we saw inthe second half of November. This is yet another factor that points to theproximity of $1,700 as the next downside target.
Moving on to cross-asset implications,Yellen’s dollar-negative comments tipped over a string of dominoes across thecurrency market. Ushering the EUR /USD higher, the boost added wind to the yellow metal’s sails.
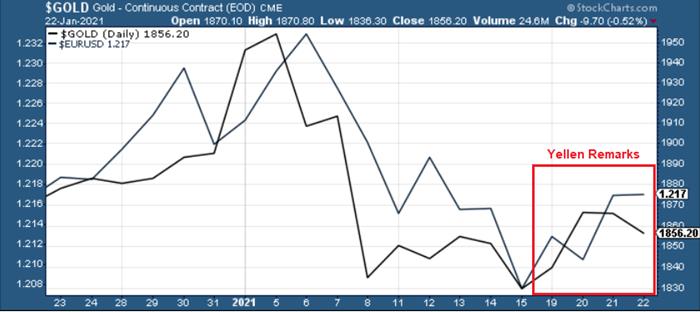
Figure4
And because the EUR/USD accounts fornearly 58% of the movement in the USD Index, the currency pair is an extremelyimportant piece of gold’s puzzle. However, beneath the surface, the euro isalready starting to crack. After breaching critical support last week, Yellen’scomments basically saved the currency, as a rally in the EUR/USD was followedby a rally in the EUR/GBP.
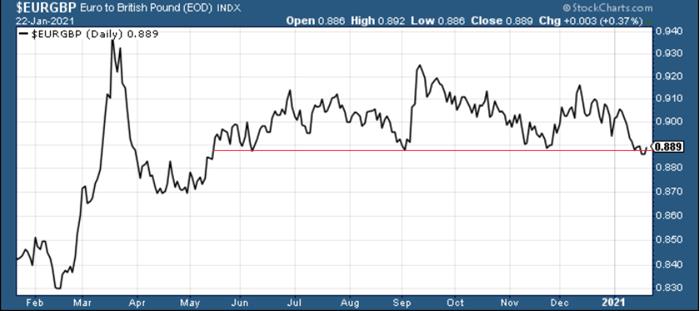
Figure5
However, with Eurozone fundamentals drastically underperforming the U.S. (and many other countries aswell), a come-to-Jesus moment could be on the horizon.
In summary, Friday’s detox – with theEUR/USD flat-lining and gold moving lower – could be a precursor to a rathermessy withdrawal. Right now, the euro is hanging on for dear life, astechnicals, fundamentals and cross-currency signals all point to a weaker euro.As a result, due to gold’s strong positive correlation with the EUR/USD, theyellow metal is unlikely to exit the battle unscathed.
So, why is gold likely to bottom atroughly $1,700 (for the interim)?
One of the reasons is the 61.8% Fibonacciretracement based on the recent 2020 rally, and the other is the 1.618extension of the initial decline. However, there are also morelong-term-oriented indications that gold is about to move to $1,700 and more likely, even lower.
(…) gold recently failed to move aboveits previous long-term (2011) high. Since history tends to repeat itself, it’sonly natural to expect gold to behave as it did during its previous attempt tobreak above its major long-term high.
And the only similar case is from late1978 when gold rallied above the previous 1974 high. Let’s take a look at thechart below for details (courtesy of chartsrus.com)

Figure6 - Gold rallying in 1978, past its 1974 high
As you can see above, in late 1978, golddeclined severely right after it moved above the late-1974 high. This time,gold invalidated the breakout, which makes the subsequent decline more likely.And how far did gold decline back in 1978? It declined by about $50, which isabout 20% of the starting price. If gold was to drop 20% from its 2020 high, itwould slide from $2,089 to about $1,671 .
This is in perfect tune with what wedescribed previously as the downside target while describing gold’s long-termcharts:
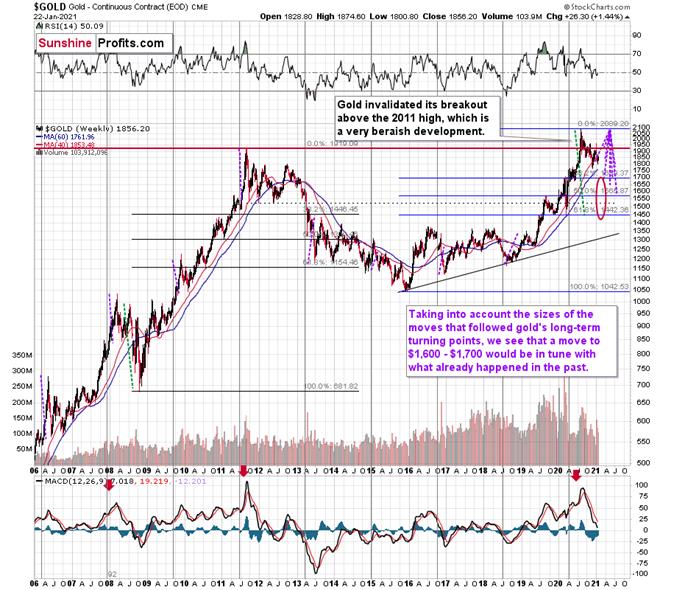
Figure7 - Relative Strength Index (RSI), GOLD, and Moving Average ConvergenceDivergence (MACD) Comparison
The chart above shows exactly why the$1,700 level is even more likely to trigger a rebound in gold, at the veryminimum.
The $1,700 level is additionallyconfirmed by the 38.2% Fibonacci retracement based on the entire 2015 – 2020rally.
There’salso a good possibility that gold could decline to the $1,500 - $1,600 area orso ( 50% - 61.8% Fibonacci retracements and the price level to which gold declinedinitially in 2011). In fact, based on the most recent developments in goldand the USDX (how low the latter fell without a rally in the former), it seemsthat $1,500 is more likely to be the final bottom than $1,700. The $1,700 levelis likely to be a bottom – yes – but aninterim one only.
Before looking at the chart below (whichis very similar to the chart above, but indicates different RSI, volume, etc.),please note the – rather obvious – fact: gold failed to break above its 2011highs. Invalidations of breakouts are sell signals, and it’s tough to imagine a more profound breakout that could have failed. Thus, the implications are extremely bearish for the next several weeks and/ormonths.
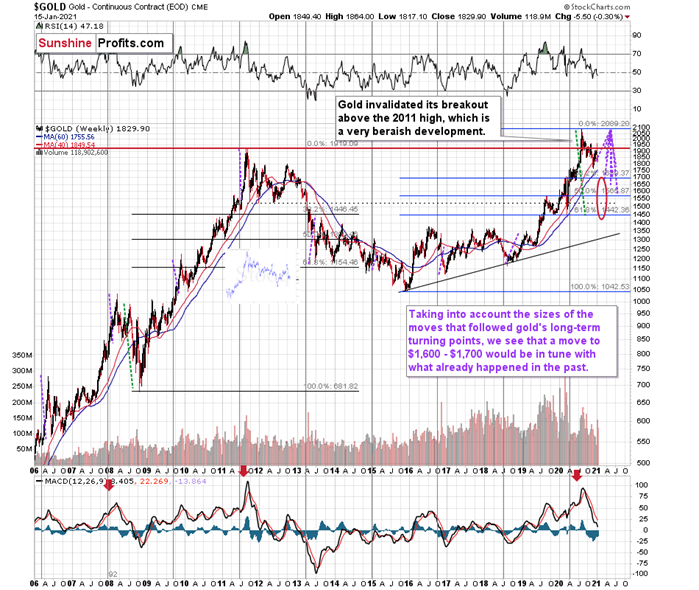
Figure8 - RSI, GOLD, and MACD Comparison
The odd thing about the above chart isthat I copied the most recent movement in gold and pasted it above gold’s 2011– 2013 performance. But – admit it – at first glance, it was clear to you thatboth price moves were very similar.
And that’s exactly my point. The historytends to rhyme and that’s one of the foundations of the technical analysis ingeneral. Retracements, indicators, cycles, and other techniques are used basedon this very foundation – they are just different ways to approach therecurring nature of events.
However, every now and then, the historyrepeats itself to a much greater degree than is normally the case. In extremelyrare cases, we get a direct 1:1 similarity, but in some (still rare, but not asextremely rare) cases we get a similarity where the price is movingproportionately to how it moved previously. That’s called a market’sself-similarity or the fractal nature of the markets. But after taking a brieflook at the chart, you probably instinctively knew that since the price movesare so similar this time, then the follow-up action is also likely to be quitesimilar.
In other words, if something looks like aduck, and quacks like a duck, it’s probably a duck. And it’s likely to do whatducks do.
What did gold do back in 2013 at the endof the self-similar pattern? Saying that it declined is true, but it doesn’tgive the full picture - just like saying that the U.S. public debt is notsmall. Back then, gold truly plunged. And before it plunged, it moved lower ina rather steady manner, with periodic corrections. That’s exactly what we seeright now.
Please note that the above chart (Figure 8) shows gold’s very long-termturning points (vertical lines) and we see that gold topped a bit after it (notmuch off given their long-term nature). Based on how gold performed afterprevious long-term turning points (marked with purple, dashed lines), it seemsthat a decline to even $1,600 would not be out of ordinary.
Finally, please note the strong sellsignal from the MACD indicator in the bottom part of the chart. The only othertime when this indicator flashed a sell signal while being so overbought was atthe 2011 top. The second most-similar case is the 2008 top.
The above-mentioned self-similaritycovers the analogy to the 2011 top, but what about the 2008 performance?
If we take a look at how big the final2008 decline was, we notice that if gold repeated it (percentage-wise), itwould decline to about $1,450. Interestingly, this would mean that gold wouldmove to the 61.8% Fibonacci retracement level based on the entire 2015 – 2020rally. This is so interesting, because that’s the Fibonacci retracement levelthat (approximately) ended the 2013 decline.
History tends to rhyme, so perhaps goldis going to decline even more than the simple analogy to the previous turningpoints indicates. For now, this is relatively unclear, and my target area forgold’s final bottom is quite broad.
Thank you for reading our free analysistoday. Please note that the above is just a small fraction of today’sall-encompassing Gold & Silver Trading Alert. The latter includes multiplepremium details such as the targets for gold and mining stocks that could bereached in the next few weeks. If you’d like to read those premium details, wehave good news for you. As soon as you sign up for our free gold newsletter,you’ll get a free 7-day no-obligation trial access to our premium Gold &Silver Trading Alerts. It’s really free – sign up today.
Przemyslaw Radomski, CFA
Founder, Editor-in-chief
Toolsfor Effective Gold & Silver Investments - SunshineProfits.com
Tools für EffektivesGold- und Silber-Investment - SunshineProfits.DE
* * * * *
About Sunshine Profits
SunshineProfits enables anyone to forecast market changes with a level of accuracy thatwas once only available to closed-door institutions. It provides free trialaccess to its best investment tools (including lists of best gold stocks and best silver stocks),proprietary gold & silver indicators, buy & sell signals, weekly newsletter, and more. Seeing is believing.
Disclaimer
All essays, research and information found aboverepresent analyses and opinions of Przemyslaw Radomski, CFA and SunshineProfits' associates only. As such, it may prove wrong and be a subject tochange without notice. Opinions and analyses were based on data available toauthors of respective essays at the time of writing. Although the informationprovided above is based on careful research and sources that are believed to beaccurate, Przemyslaw Radomski, CFA and his associates do not guarantee theaccuracy or thoroughness of the data or information reported. The opinionspublished above are neither an offer nor a recommendation to purchase or sell anysecurities. Mr. Radomski is not a Registered Securities Advisor. By readingPrzemyslaw Radomski's, CFA reports you fully agree that he will not be heldresponsible or liable for any decisions you make regarding any informationprovided in these reports. Investing, trading and speculation in any financialmarkets may involve high risk of loss. Przemyslaw Radomski, CFA, SunshineProfits' employees and affiliates as well as members of their families may havea short or long position in any securities, including those mentioned in any ofthe reports or essays, and may make additional purchases and/or sales of thosesecurities without notice.
Przemyslaw Radomski Archive |
© 2005-2019 http://www.MarketOracle.co.uk - The Market Oracle is a FREE Daily Financial Markets Analysis & Forecasting online publication.