Monster deposit potential
Golden Triangle has over 150 year history
Some of the highest grade, largest gold deposits on earth
Large, high grade targets in global context
The Golden Triangle in northwestern British Columbia has historically been a major site of Canadian gold production, beginning as early as the mid 1800s. There was a wave of production in the 1990s which cooled as the gold price declined, but larger scale production resumed in 2017, and the area has seen surging exploration interest over the past year, given that the region has some of the largest potential global gold deposits, at very high grades.
Activity had declined because of lack of infrastructure, low gold price...
... but infrastructure has been improved, and gold is soaring
Historical hurdles falling
Production and exploration in the Golden Triangle declined over the twenty years to 2017 partly because of the area's remote location and previous lack of infrastructure, and low gold prices. However, in the ensuing years, infrastructure has been substantially improved, including an electricity grid, port and road development, while the gold price has had a major rebound over the last year, and is now at nine year highs.
Brucejack in the Golden Triangle is one of Canada's largest producing mines
Two other major producing mines, another potential huge mine, and three other explorers at the PEA stage
Major producing and potential mines
The Golden Triangle holds one of Canada's largest producing mines, Brucejack, and two other sizeable mines, New Afton and Red Chris, as well as one potentially huge mine, KSM, which is not yet producing, but is at a very advanced stage of exploration. There are also three large mid-stage explorers, Ascot, Auryn and Skeena, that have made it to the PEA stage. Investment is flowing into the Golden Triangle junior mining sector, with capital raised so far in Q2/20 already at the highest levels in years, with these three mid-stage explorers seeing the most capital directed to them.


Many junior explorers are plays on the new interest in the Golden Triangle
Many juniors in the region have risen over 100% over the past year
Explorers seeing rising interest
Explorers at earlier stages have also been seeing increased interest over the past year, including GT Gold, Brixton, American Creek, Tudor Gold, Teuton, which we cover in detail in this report. The share prices of these stocks have surged over the past three months, and are up between 92%-725%, mainly buoyed by the resurgence in the gold price, which has allayed investor fears during the March crash that many of these smaller names could have problems raising capital.
Golden Triangle was on hold after winter and spring shutdowns
Peak summer months hold highest chance of strong exploration news
Moving into the peak season
Given the Golden Triangle's northern latitude, exploration in the winter months becomes difficult, and during the spring of 2020, much activity was obviously on hold because of the global health crisis. However, with the mining industry beginning to resume production and exploration globally, and the peak summer Golden Triangle exploration period currently ongoing, the next few months could see a wave of drilling and other results, and has some of the highest potential for stock prices gains in the year.
Potential to discover monster high grade deposit
Infrastructure and gold price make Golden Triangle economics more viable
Golden Triangle has potential for monster find
The Golden Triangle is likely one of the best potential locations on earth for a material new gold find, and now has the infrastructure and a sufficient gold price to make the economics of doing the exploration to find such deposits viable. We expect to see increased interest in exploration of the area, and especially if we see the larger explorers with PEAs becoming developed mines over the next few years, and the gold price remains high for an extended period, share prices in the region could see support.
1) Golden Triangle mining overview
B.C. seeing strong increase in gold production
The Golden Triangle is located in the Northwest of British Columbia, which is the third largest province contributing to Canadian gold production, at 11% of total country production in 2018, with 20,135 kilograms (Figure 1). Although the province is a relatively small contributor to gold output in Canada compared to Ontario, at 42% of the total, and Quebec, with 34% (Figure 2), it is home to one of the country's largest gold mines, Brucejack, owned by Pretium (Figure 2), which produced over half of the province's gold in 2018, or 54% of the total, at 351k oz, or 10,801 kg.
Figure 1: Canadian gold production by province
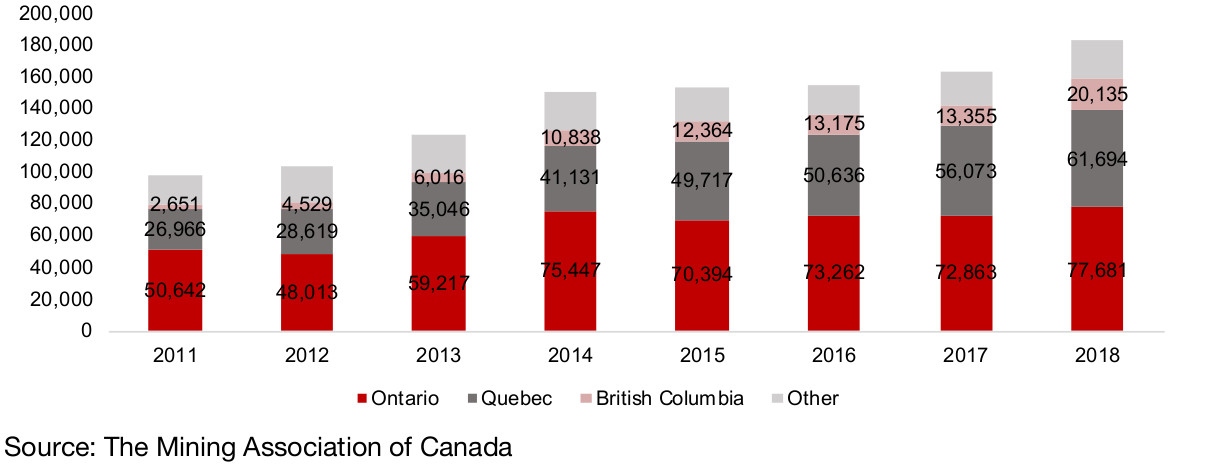
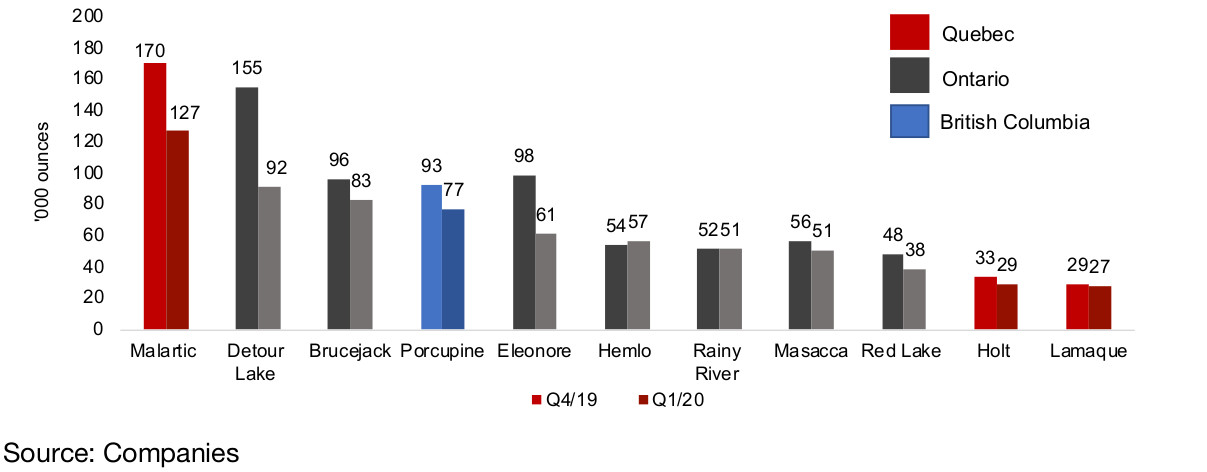
Figure 2: Major Canadian gold mine production ('000 ounces)
Although off a lower base, the contribution of the province to overall Canadian gold production is growing much more quickly than other provinces, up 33.6% on average from 2011 to 2018, compared to 6.3% for Ontario and 12.6% for Quebec (Figure 3). There are two other mines operating in the Golden Triangle, New Gold's New Afton mine and Imperial Metal's Red Chris, with an output of 77.4k oz and 41.9k oz, respectively, for 2018, and while Seabridge's KSM is not yet producing, it has estimated reserves of 6.0x the level of Brucejack, and is now transitioning from late stage exploration to development.
Figure 3: Major Canadian gold mine production ('000 ounces)
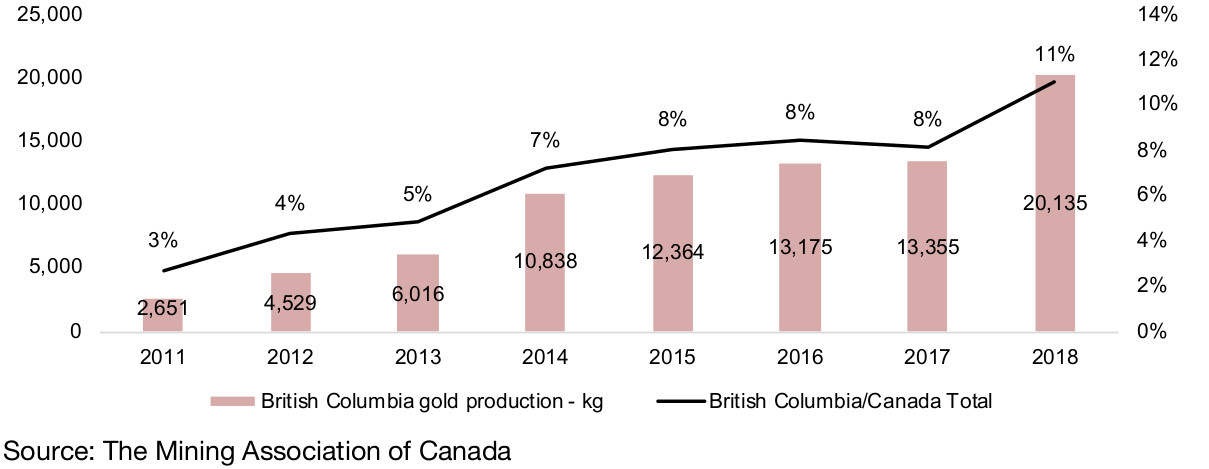
Figure 4, 5: Major Canadian gold mine production ('000 ounces)
BC mining exploration concentrated in NW and gold
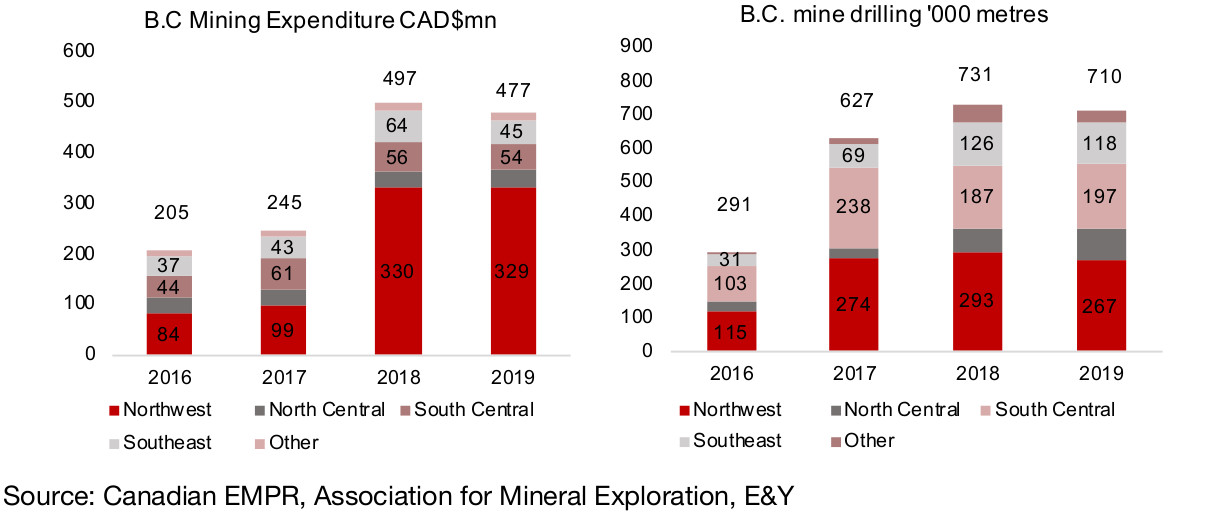
Rising British Columbia production is important for the junior miners, as it points to areas of potentially lucrative exploration, and increases investor expectations for the region and encourages them to invest. Mining exploration investment in British Columbia has jumped considerably in the last two years, from just CAD$207mn in 2016 to CAD$329mn in 2019 (Figure 4). Exploration investment has been mainly focused in the Northwest of the province, where the Golden Triangle is located, with the region accounting for 66% of expenditure in 2018 and 69% in 2019. The Northwest is also seeing the highest number of meters drilled of the province, at 115k meters in 2016, or 40% of the total and 267 meters in 2019, or 38% of the total (Figure 5).
Figure 6, 7: Major Canadian gold mine production ('000 ounces)
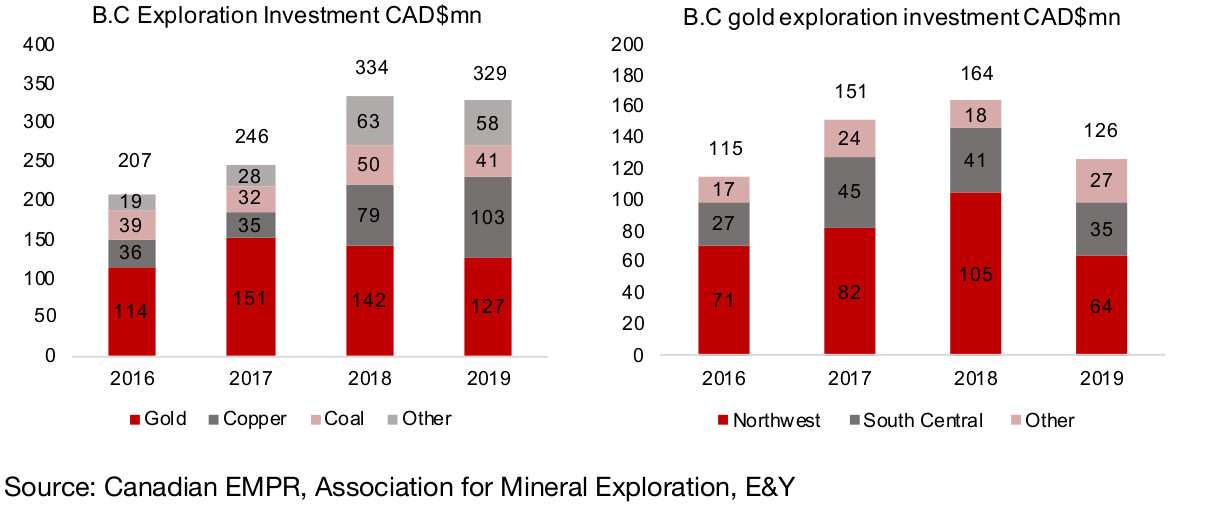
Gold continues to attract the largest amount of mining investment in British Columbia, at CAD$127mn in 2019, or 39% of the total, although this has declined from 61% in 2017, as copper exploration investment has increased from 14% in 2017 to 31% in 2019 (Figure 6). Gold exploration has been concentrated in the Northwest of the country, mainly in the Golden Triangle, and the region accounted for 64% of the total in 2018 and 51% in 2019 (Figure 7). While gold exploration investment in British Columbia declined in 2019 by 23% yoy, we expect that this figure is likely to pick up in 2020.
Mining exploration expenditure in B.C. near the cycle trough in 2019
British Columbia's mining exploration cycle remained near its lows in 2019, judging by mineral exploration and deposit appraisal expenditure (Figure 8). It peaked in absolute terms in 2012, with CAD$734mn spent, declined to a trough of CAD$232mn in 2017, rose in 2018 to CAD$370mn and then declined -13% last year to CAD$318mn. In relative terms, BC as a percentage of Canada's total mineral exploration and deposit appraisal expenditure peaked in 2014 at 22%, fell to 14% for 2016-2017, and was at 15% in 2019. However, as we show below, it appears that in 2020 this number could pick up considerably, especially driven by the rebound in gold exploration.
Figure 8: BC mineral exploration, deposit appraisal expenditure
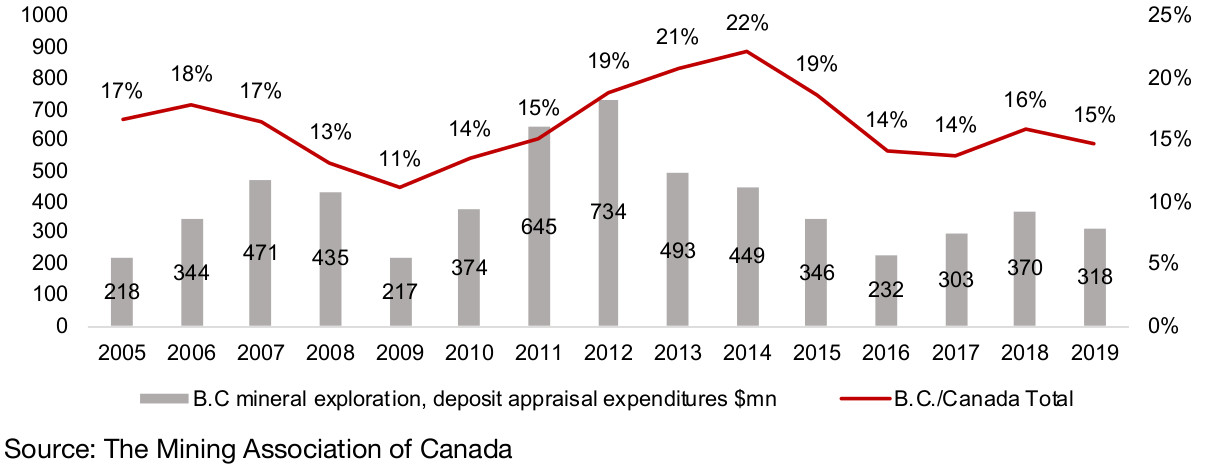
Figure 9: Private placements of Golden Triangle junior gold miners
Gold exploration firms see major jump in capital raising
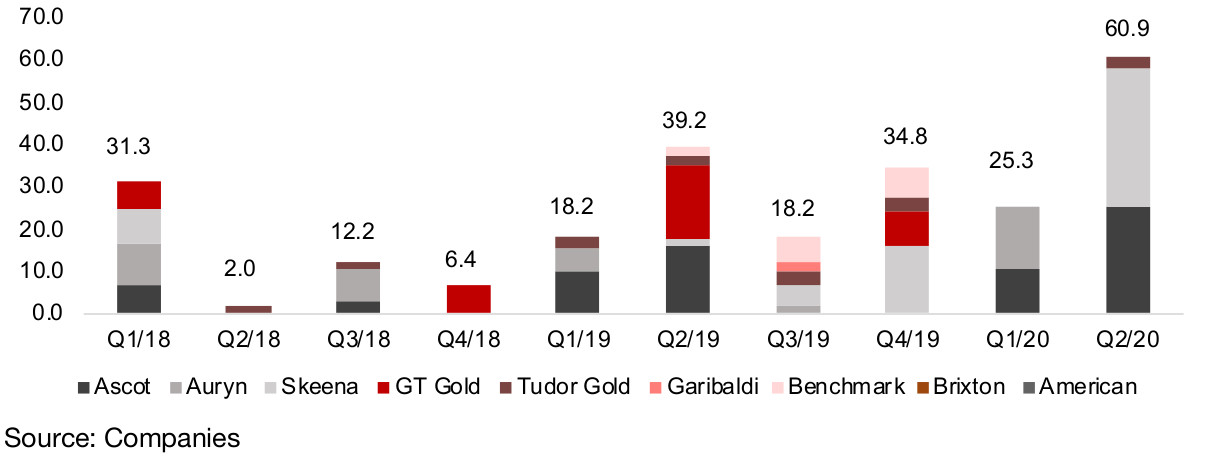
Using private placements by large Golden Triangle gold exploration firms as a proxy for eventual mining exploration expenditure, we can see that there has been a substantial pick up in capital raising especially in Q2/20 by these firms, and that the quarterly total for private placements has been trending up off Q2/18 lows (Figure 9). Given that this was even in the context of the global health crisis and a dip in gold in March 2020, with gold rebounding to hold firm at above US$1,700/ounce for several months now, there is the prospect that this strength could continue in Q3/20.
The private placements over the past six months have been concentrated in three larger companies all in an advanced stage of exploration and with PEAs, Ascot, Auryn and Skeena. Should the gold price continue to hold at current levels which are now well above average AISC costs for most gold mines in the area, it will likely be high enough to compensate investors even for the higher risk of earlier stage explorers, and could encourage further investment in the other junior miners currently exploring in the Golden Triangle.
Figure 10: The golden triangle in British Columbia
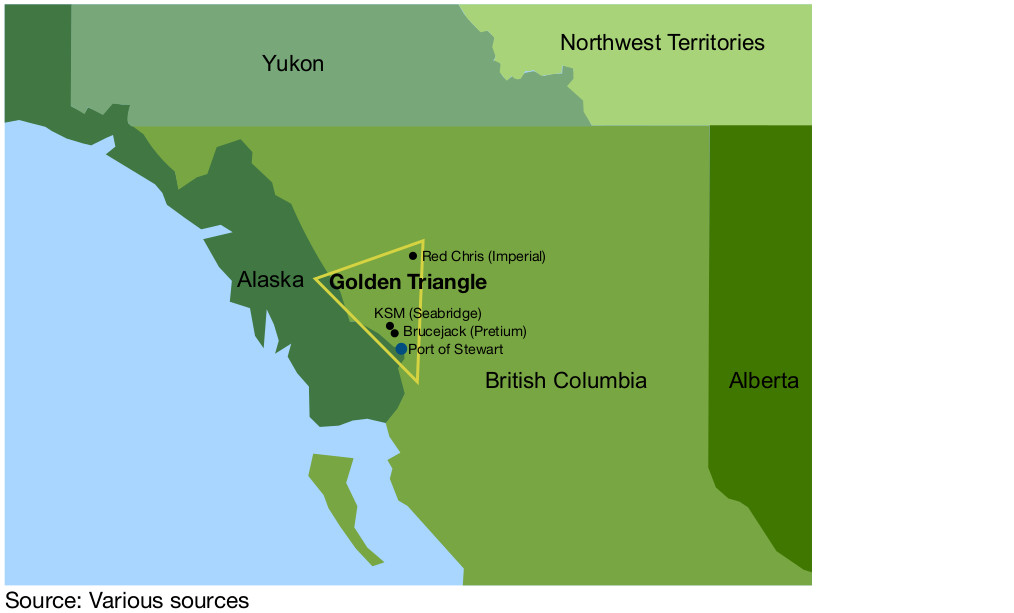
Golden Triangle in production from the mid-1800s
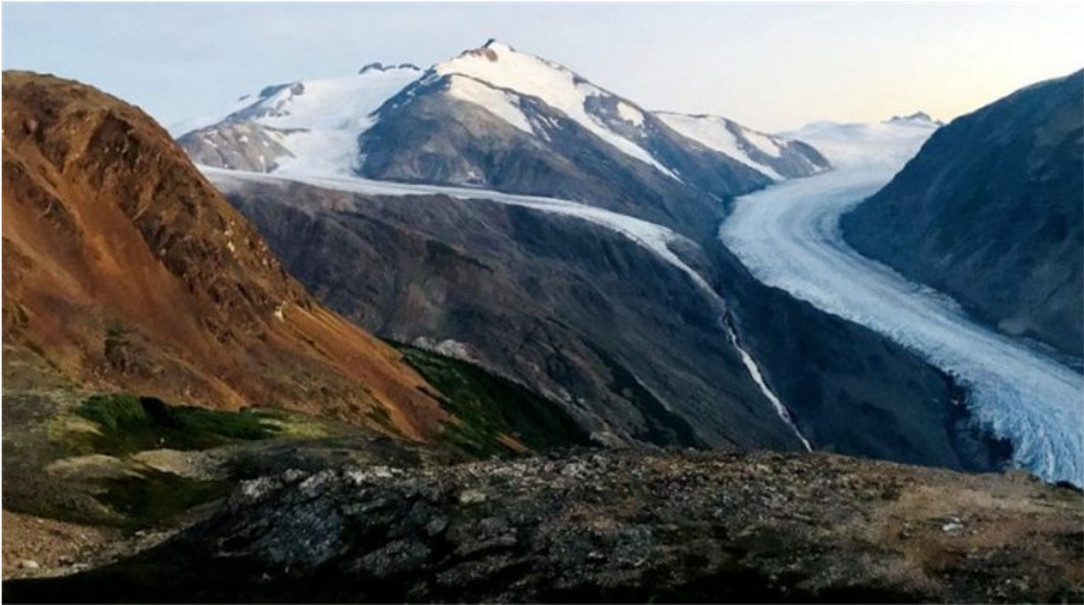
The Golden Triangle lies to the Northwest of British Columbia, with one side running roughly along the border with Alaska, and south of the Yukon border, a remote and relatively difficult to access area, with extreme winters (Figure 10). The history of gold exploration in the Golden Triangle dates back to 1861, with the Stikine Gold Rush, followed by the Cassiar Gold Rush in the 1870s, and then aggressive exploration in Atlin in the late 1890s, which was the Southern part of the Klondike rush. Large mines started to be developed from 1918, with the Premier Gold Mine, which produced a total 2 mn ounces of gold and 45 mn ounces of silver by the time it closed in 1952.
The next large find was the Snip mine, which was originally discovered in 1964 by Cominco but did not begin production until 1991, producing one million ounces by 1999. The next major mine was Eskay Creek, which after exploratory drilling in 1988, went into production in 1994, producing 3.3 mn ounces of gold and 160 mn of silver by 2008. While the mines all showed a very high grade of gold, falling gold prices through the 1990s, and low prices until the mid-2000s coupled with the limited infrastructure, difficult winters and remoteness of the region, lead to a lower interest in development in the area.
Upgrades to the Golden Triangle's infrastructure
Recently, however, both of these issues have been alleviated, with the gold price at its highest levels since 2012, and material improvements in infrastructure over the past decade. First, the northern part of the Stewart-Cassier highway running from Southern B.C. was paved by the 2010s, and there were road improvements made in 2019. The cost of electricity has also decreased with a major upgrade to energy resources with the opening of the 195MW Forest Kerr, and 16MW Volcano Creek hydroelectric plants in 2014, the opening of the 66MW McLymont Creek plant in 2015, and a 344 km, 287-kilovolt Northwest Transmission Line completed and put in service in 2014. Next, a river port in Stewart, B.C. allowing access from the Golden Triangle to rapid shipping routes to Asia, was opened in 2015, and $13mn in spending for expanding the port's capacity was approved by the Canadian government in mid-2019. All of these improvements occurred during a low in gold prices, so did not immediately reattract investment in the region, but did put the region in a much better position as the gold price eventually increased.
Relatively strict B.C. regulatory framework...
British Columbia has a relatively strict regulatory framework when it comes to resource projects, and is ranked as the 'greenest' province in Canada. The Fraser Institute's 2013 B.C. Mining Policy Performance Report has highlighted four main issues that affect mining investment in the province; 1) disputed land claims with local communities, 2) changes in areas preserved for conservation, 3) changes in environmental regulations, and 4) regulatory duplication and inconsistencies. Disputed land agreements have been helped to some extent by Impact Benefit Agreements (IBAs) made with local communities, and in recent years these have been used in major court cases as a legal backing. New areas being denied access for resource development on environmental grounds will continue to be a risk in the province, as will be the potential for new, even stricter environmental regulations, given the province's clear 'green' strategy. Redundant and conflicting regulations between the federal, provincial and local governments will likely also continue to be a risk, although this is common in all layered bureaucracies globally, and not endemic to just B.C..
Figures 11, 12: Fraser Institute investment attractiveness score
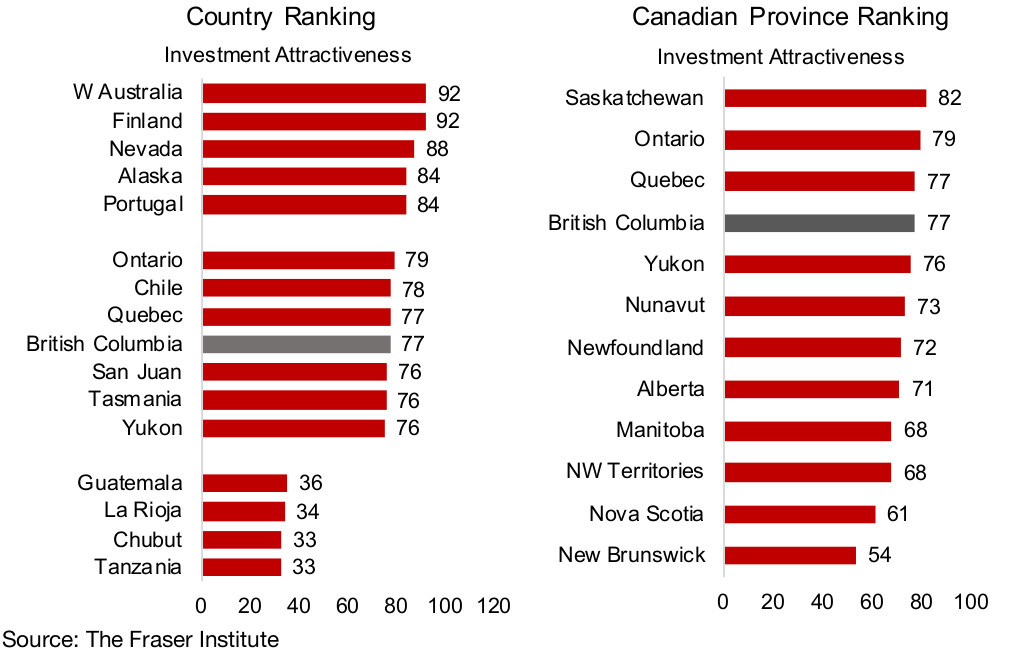
...but province still a reasonably attractive global mining district
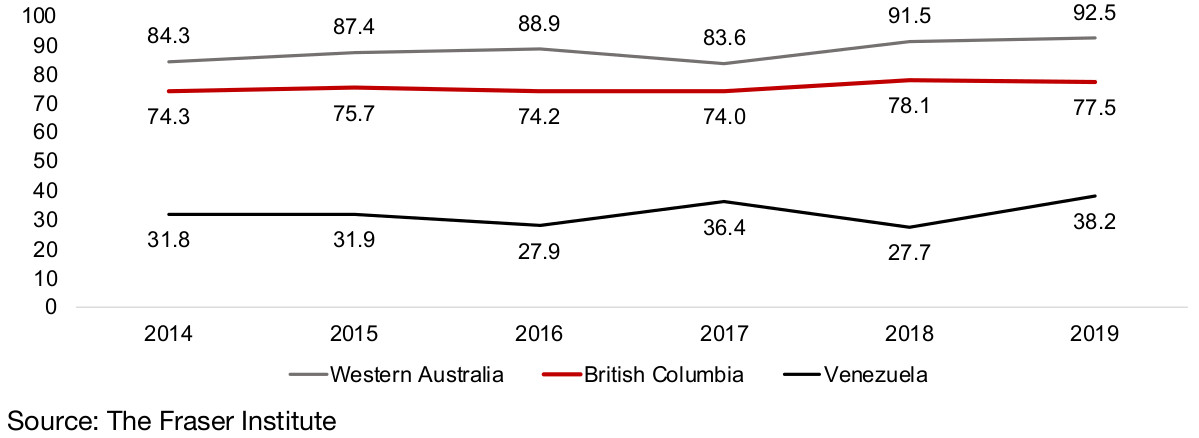
While the relatively strict regulatory framework has affected British Columbia's ranking in terms of investment attractiveness as a global district, it still remains a reasonably attractive investment destination, based on its ranking by the Fraser Institute's global mining survey. It gained a 77 score for investment attractiveness in the 2019 survey, below the highest ranked Western Australia at 92, but well above the lowest ranked Tanzania at 33, and it came in 19 out of a total 76 ranked districts in the survey 2019, just into the top third (Figure 11). It is only the fourth most attractive of the Canadian provinces, below Saskatchewan and Ontario, but just slightly behind Quebec (Figure 12). Overall its investment attractiveness score from the Fraser Institute has increased marginally in recent years, from around 74-76 from 2014-2016, rising to about 77-78 in 2018-2019 (Figure 13).
Figures 13: Fraser Institute investment attractiveness score
2) Major Golden Triangle producers and explorers
Four major gold mines in the Golden Triangle
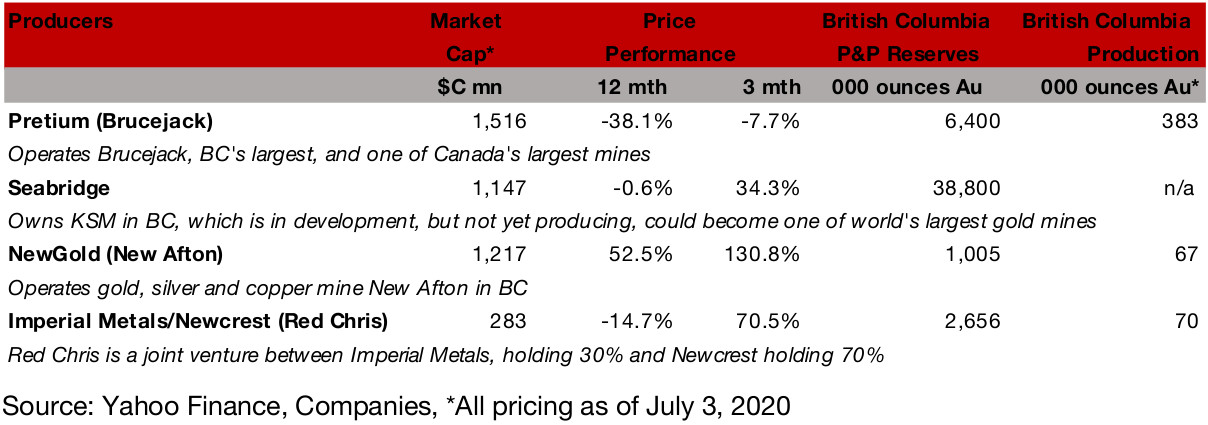
There are four key large mines in the Golden Triangle, three already in the production, and a fourth which is in development. Brucejack, owned and operated by Pretium, is by far the largest in terms of production, and as shown in Figure 2 above, it is one of Canada's largest producing mines. Brucejack has 6,400k oz of Proved and Probable reserves, and with 379k oz produced over the last 12 months to Q1/20, its implied mine life is 16.7 years (Figures 14, 15). The next largest producing mine by reserves is the Red Chris mine, which is a 70%/30% joint venture between Newcrest and Imperial Metals, with 2,656k oz reserves, and 70k oz production over the past 12 months. While this gives an implied mine life of 38.1 years, with Red Chris still ramping up to peak production, the actual mine life will likely be lower. The smallest of the three producers is NewGold's New Afton, with 1,005k oz P&P reserves and 67k oz of production, for a mine life of 14.9 years.
Figure 14: Golden Triangle producing mines and advanced explorers
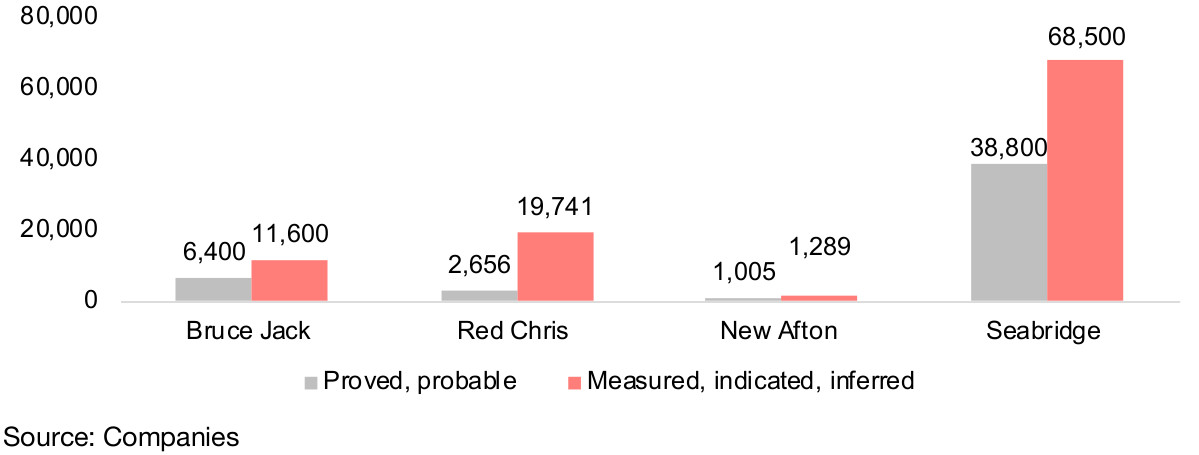
Seabridge's KSM mine reserves at least 6.0x the size of Brucejack
These three mines already point to a long period of significant production for the Golden Triangle alone, but it is really the fourth mine, KSM's huge Seabridge Mine, that has the potential to be the core source of long-term regional output. The mine has 38,800k ounces in Proven and Probable reserves and 68,500k ounces in Indicated and Inferred resources making it one of the largest copper-gold porphyry deposits in the world, dwarfing the reserves of Brucejack by 6.0x based on P&P reserves, and by 10.7x based on I&I resources.
Seabridge's KSM fully permitted with PEA updated in April 2020
The Seabridge mine has achieved both its federal and provincial environmental assessment certificates and signed impact benefit agreements with local communities. The company's updated April 2020 PEA outlines a 44-year mine life, with a total 19.6mn oz of gold produced and 5.6 bn lbs of copper based on M&I resources, and an additional 20.8 mn oz Au and 13.8 lbs Cu including Inferred resources. The total life-of-mine expected recovery would be 27.6mn ounces, and 17.0bn lbs copper. The average annual production is expected to be 1.3mn ounces gold and 265 mn lbs copper during the first five years of the production and the project is expected to have an after-tax NPV of US$6.0bn, assuming US$1,340/oz gold, US$2.80/lb copper, and an operating cost of US$472 per oz of gold produced, net of copper and silver byproduct revenues.
Figure 15: Major BC gold mines production, life, reserves
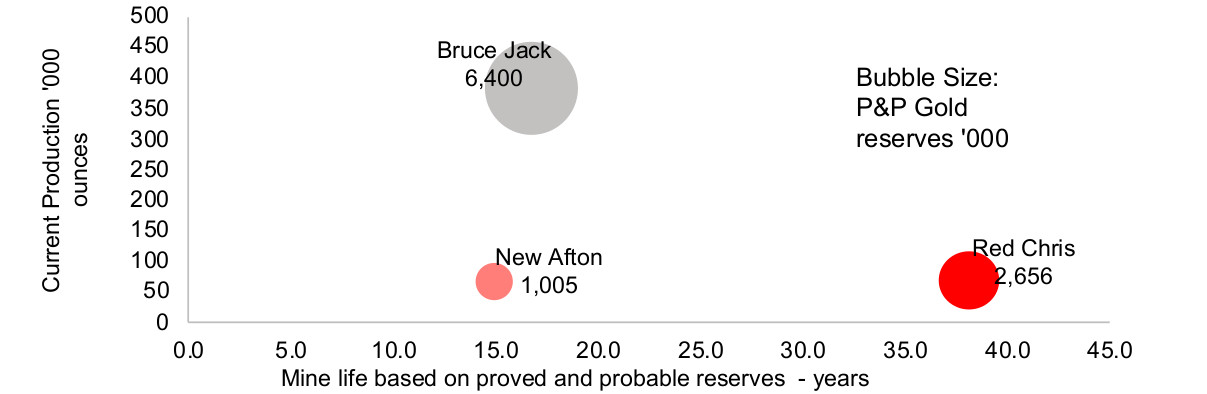
Figure 16: Major BC gold mines' reserves
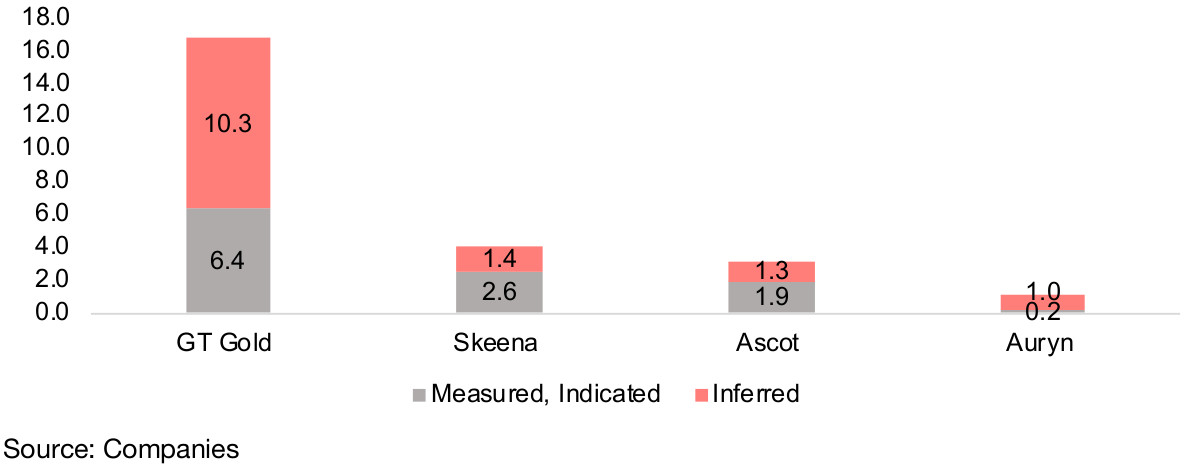
Four larger advanced explorers with M&I resources
The next three key gold companies in the Golden Triangle are four larger junior miners at a relatively advanced stage of exploration, Skeena Resources, Ascott Resources, Auyrn Resources, which have released PEAs, and GT Gold, which has released an initial resource estimate (Figure 17). The largest by market cap, Skeena, has its main project in Eskay Creek, a strong area for production historically, and has a second smaller project, Snip. Skeena's share price has been driven by press releases every month this year of drilling results or other exploration progress. In July, the company announced that it would exercise its option to purchase 100% of the Eskay Project from Barrick Gold, with the deal terms bringing in Barrick as a 12.4% shareholder of Skeena.
Figure 17: Golden Triangle larger cap, advanced junior gold miners
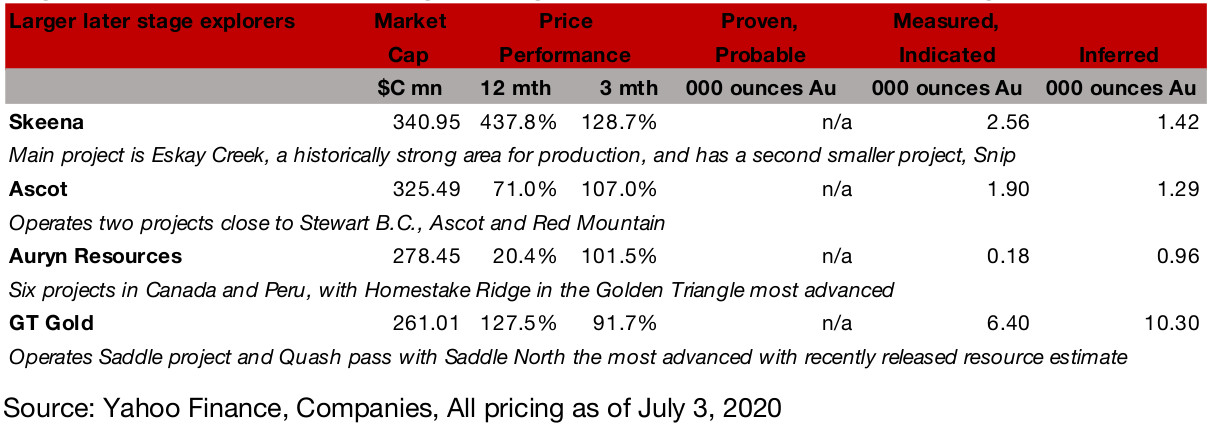
The next largest, Auryn Resources, operates six projects in Canada and Peru. Its Homestake Ridge project in the Golden Triangle is its most advanced, with a PEA, while its projects in Peru are at the permitting stage, and projects in Nunavut are at an earlier exploration phase. Ascot is operating two projects, Ascot, which has four zones, three of which have substantial gold resources, and a smaller project, Red Mountain. GT Gold is the most recent of the group to move to a reported resource, having released M&I reserves just in July 2020.
Even though Auryn has the lowest resources of the four, it has the second largest market cap of this group, as the market is paying a significant premium for Auryn on a market cap/resource basis, at $CAD243/oz, compared to CAD$102/oz for Ascot, $86/oz for Skeena and just $CAD15.6/oz for GT Gold, which has by far the largest M&I of the group (Figures 18, 19).
Figure 18: Junior miners market cap/mineral resource estimate
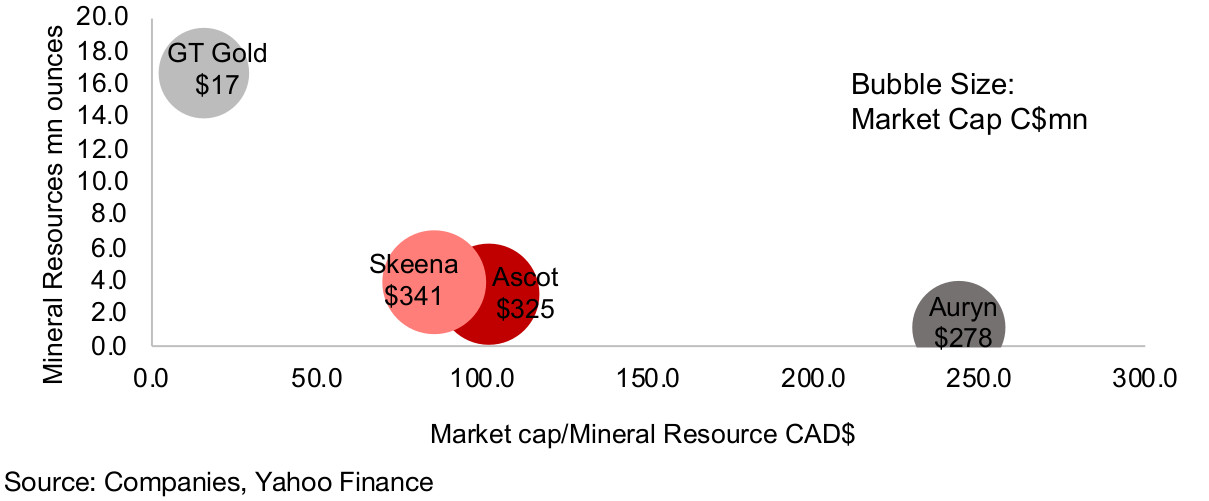
Figure 19: Golden Triangle advanced gold juniors M&I estimates
Six sizeable earlier stage explorers, one revenue stream company
The rest of the major listed companies operating in the Golden Triangle are six earlier stage explorers, Tudor Gold, American Creek, Benchmark Metals, Scottie Resources, Eskay Mining, Brixton Metals and one revenue stream aggregator, Teuton Resources. Figure 20 shows these company listed by market cap, and shows indicative highlights from recent drilling results, except for Eskay Mining, which is at an earlier stage of exploration. Teuton also has no indicative results, as the company is not a pure junior miner, but instead a project generator, that pools holdings in over 30 junior miners, adding value through share price increases following drilling results and spinoffs or acquisitions from its holdings.
Tudor, Teuton and American Creek all hold Treaty Creek
Tudor Gold, Teuton Resources and American Creek are all related firms as they hold large stakes in the Treaty Creek project, 60%, 20% and 20%, respectively, and for all three Treaty Creek is a major project. Tudor has a second JV with American Creek in the Golden Triangle, Electrum, of which it holds 60% and American Creek 40%. Tudor also holds two 100% owned properties in the Golden Triangle, Eskay North and Crown. American Creek holds six other projects, with its 100% owned Dunwell project the most advanced after Treaty Creek, with a drilling program ongoing. These companies top four gold drilling results since 2020 are shown in Figure 21.
Figure 20: Golden Triangle junior miners with resource estimates
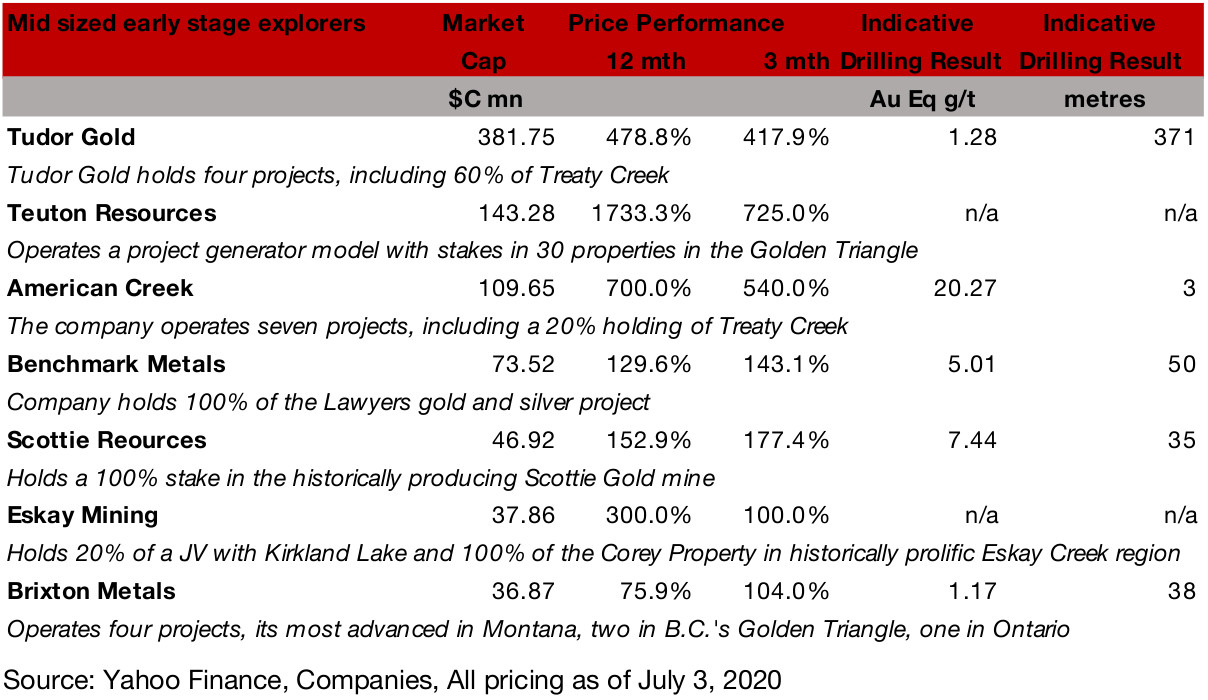
Benchmark and Scottie are entirely Golden Triangle focused
Benchmark Metals is a Golden Triangle explorer focused on its 100% holding of the past producing Lawyers gold and silver project, where it has been undertaking an extensive drilling program and continuing to expand the potential resource. Scottie Resources is another single project Golden Triangle operator, with a 100% stake of the historically producing Scottie Gold Mine.
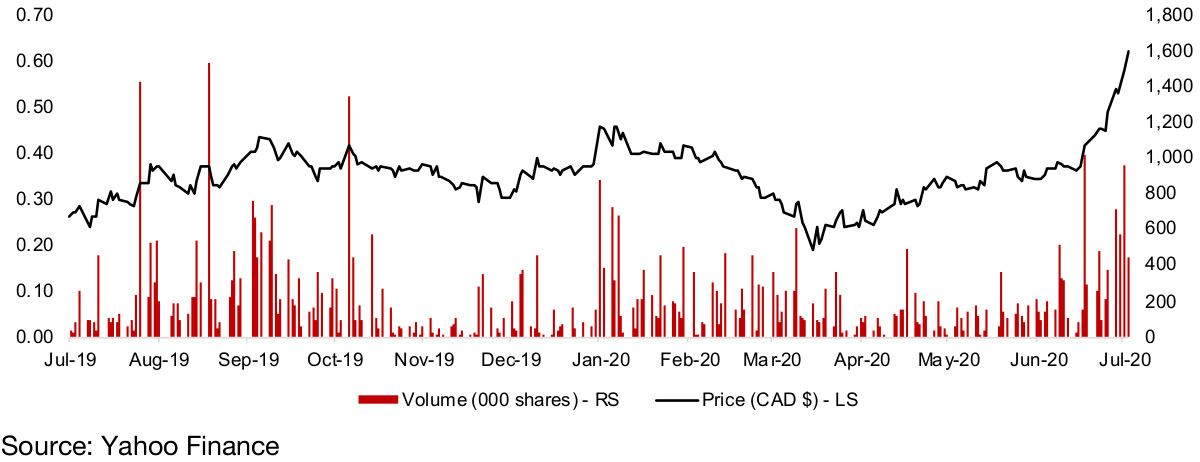
Eskay Mining at earlier stage, Brixton's major project in Montana
Eskay Mining has two main projects in the Golden Triangle, holding 20% of a JV with major producer Kirkland Lake, and 100% of the Corey property, but it has not made press releases reporting major drilling results so far in 2020. Brixton Metals' most advanced project is its Hog Heaven project in Montana, but the company also operates two projects in B.C.'s Golden Triangle, and one in Ontario. For further detail on most of these companies, see the individual company sections at the end of this report.
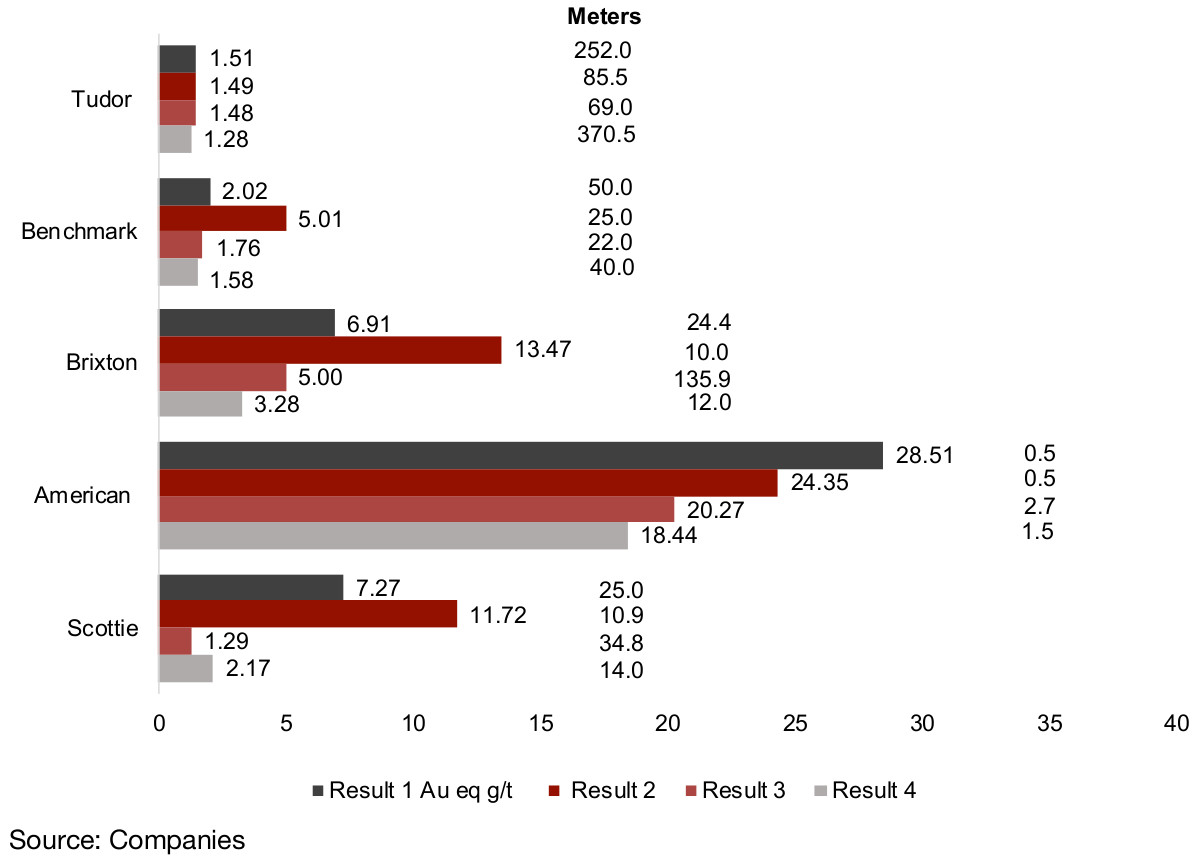
Figure 21: Junior explorers recent highlighted gold drilling results
4) Gold price versus Golden Triangle mining costs
Gold price rises to nine years highs…
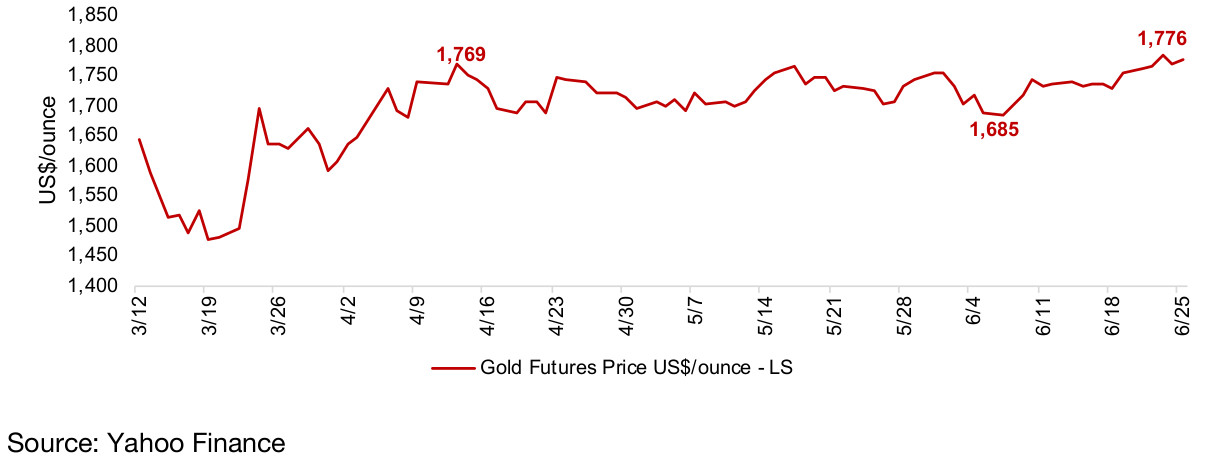
The gold price has risen to nine year highs, with the spot gold price reaching over US$1,800/oz, off of lows in 2016 around US$1,050/oz (Figure 22), on a combination of substantial monetary expansion by the US Federal Reserve, continued global health risks, and overall global economic risks. The gold futures price recently broke out of a trading range between US$1,685/oz to US$1,700/oz that held for about two months from April 2020, and has breached the key resistance level of US$1,800/ounce (Figure 23).
Figure 22: Spot gold price long-term
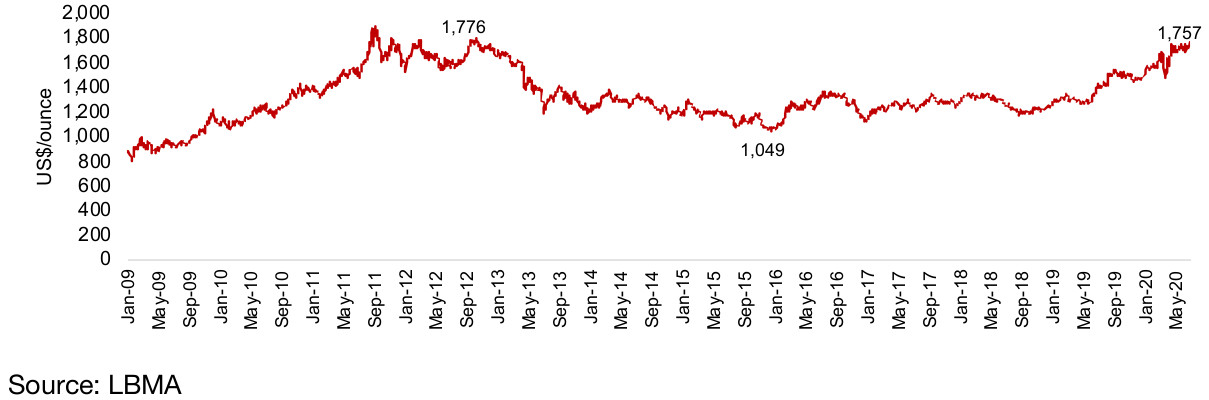
Figure 23: Gold futures nearest contract
Market estimates for gold over the next 12 months are now reaching to as high as US$2,000/oz. With an average for the spot gold price for the year so far at US$1,649/oz, and global economic and monetary risks still elevated, and likely to remain so over the next year, especially dollar depreciation through monetary expansion, even if the global health risk subsides, gold should hold well above US$1,500/oz for an extended period, and is very unlikely to revert back to the average of just US$1,392/oz that held over 2019.
...which is well above costs for most gold mines
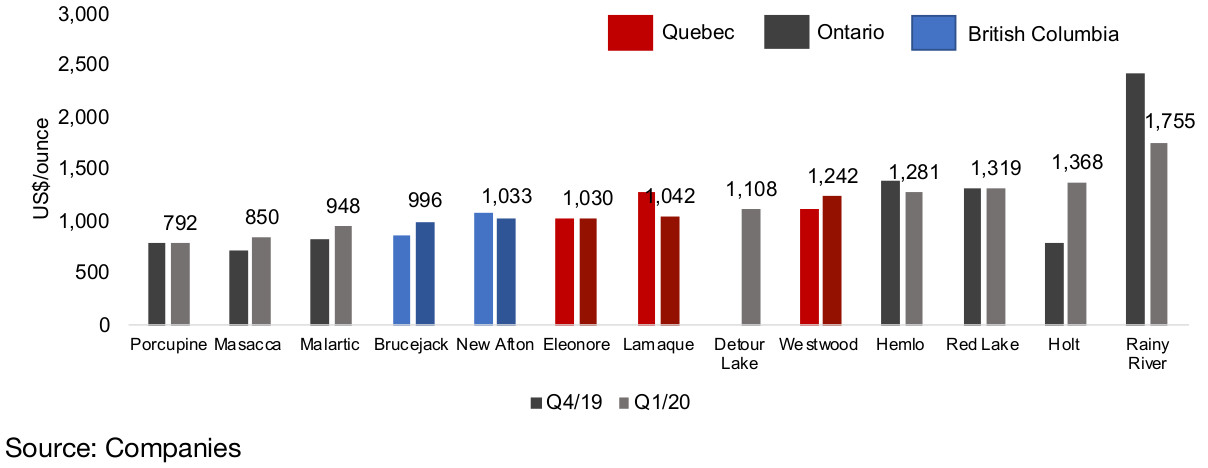
This level of US$1,500/per ounce is key because this is the level where most major Canadian gold mines will be operating at reasonable margin. We can see the average all-in-sustaining cost/oz for the major Canadian producing gold mines over the past two quarters in Figure 24, ranging from US$792/ounce for Porcupine to a high of US$1,755/ounce for Rainy River, with the average, weighted by ounces of production, at US$1,089/oz.
If we exclude the outlier Rainy River, which has above average mining costs because of a relatively low gold grade being processed, for the more expensive mines, gold prices at the 2019 average of just US$1,392/oz would be producing quite thin margins, and certainly not enough to drive major investment into the sector. However, anywhere above US$1,500/oz, margins start to become good for most mines and at US$1,700/oz or above, profitability becomes substantial.
Figure 24: Major BC gold mines AISC costs
BC producing gold mines are lower cost...
The two producing gold mines in the Golden Triangle for which data are available are relatively low cost in the context of the Canadian mines. Overall this bodes well for other prospective mines in the region and highlights in part the reduced costs for the region from improved infrastructure over the past decade, especially in terms of the hydroelectric plants and extension of the electricity grid, with energy costs one of the largest cost components for operating mines. For juniors, the low costs combined with the high gold price could encourage investment from providers of capital given that the implied margins are particularly fat.
...but the cost of new mines will depend on the specific project
However, the existing low costs for the currently operating mines of course does not necessarily translate to a low cost for other mines, which could be very different geologically and require a more expensive development process than the existing mines. Nonetheless, the evidence currently points to a relatively low cost mining district in terms of the fundamental costs of getting the gold out of the ground, even though in compared to some jurisdictions, there may be higher bureaucratic costs upfront in terms of achieving the necessary environmental permitting and establishing agreements with local communities.
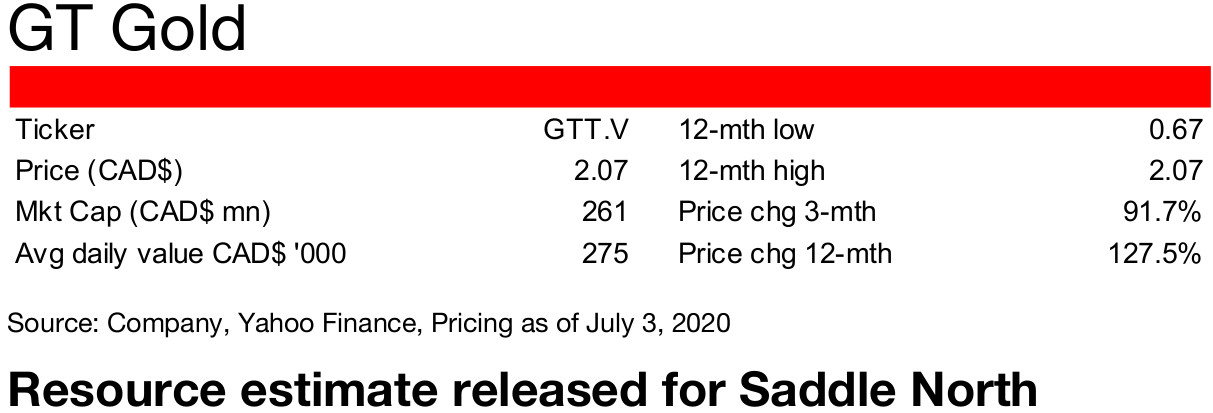
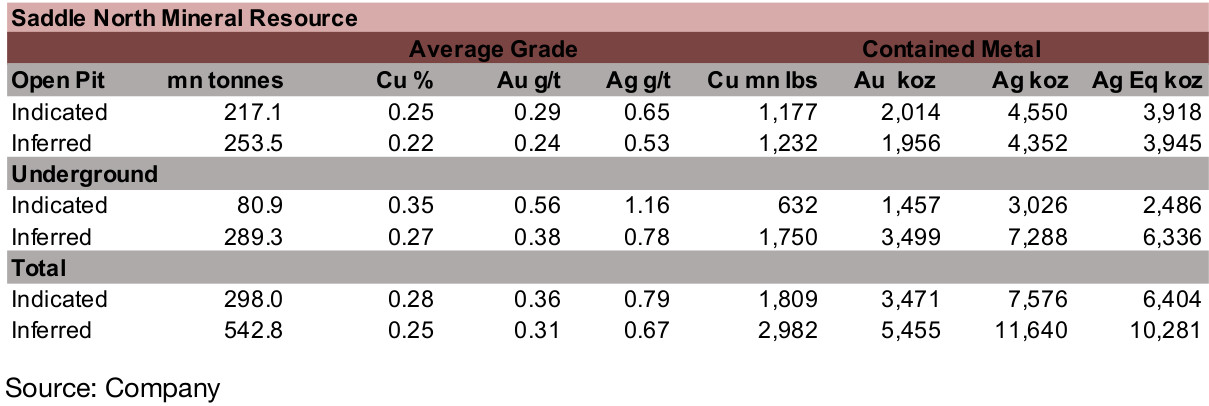
Main project is Saddle, with Saddle North the most advanced: Although GT Gold has a large market cap, it is an earlier stage exploration firm which has yet to release a PEA. Its main project is Saddle in the Golden Triangle, with two main zones, Saddle North and Saddle South, and its other project is Quash Pass. The company's most advanced project is Saddle North, a large, high-grade Cu-Au zone. The company did 23,900m in delineation drilling in 2019, with the best results from the project 1.0% CuEq or 1.5 g/t AuEq over 777 m including 1.5% CuEq or 2.0 g/t AuEq over 342 m. The company has released metallurgical results and a geological model for Saddle North, and is in consultation with local communities for exploration agreements. It is continuing exploration of new targets and definition and infill drilling, announced a resource estimate in July 2020 (Figure 25), and expects a PEA by end 2020.
Figure 25: GT Gold Saddle North mineral resource
Saddle South at earlier stage than Saddle North: The company's Saddle South target is at an earlier stage of development than Saddle North, with 1,289m of drilling done in 2019, allowing the company to expand its understanding on controls on mineralization, collect metallurgical samples, and begin to develop a geological model. The company reported the results from the 2019 Saddle drilling program in January 2020, with the highlights including 10.00 g/t Au and 46.84 g/t Ag over 57.73 meters, including 13.45 g/t Au and 68.01 g/t Ag over 35.73 meters, in turn including 24.90 g/t Au and 114.20 g/t Ag over 15.02 meters, and in turn including 31.69 g/t Au and 92.89 g/t Ag over 6.73 meters.
Quash Pass the focus for 2020 exploration plan: The Quash Pass target, which is seven kilometers southwest of the Saddle North and Saddle South finds, is at an even earlier phase, and will be the focus of the 2020 exploration season, which is set to begin in July 2020. An initial reconnaissance program is planned for greenfield areas at Quash Pass, where two large-scale anomalous trends have been identified.
Newmont a major shareholder: One indicator of GT Gold's perceived prospects is its major strategic shareholder, Newmont Goldcorp, one of the largest gold companies in the world, which holds a 14.9% stake. The company has an additional 39.6% institutional holding, with directors and management holding 11.9%, and major mining investor and Chairman and founder of Equinox gold, Ross Beaty, owning 8.9%.
Figure 26: GT Gold share price and volume
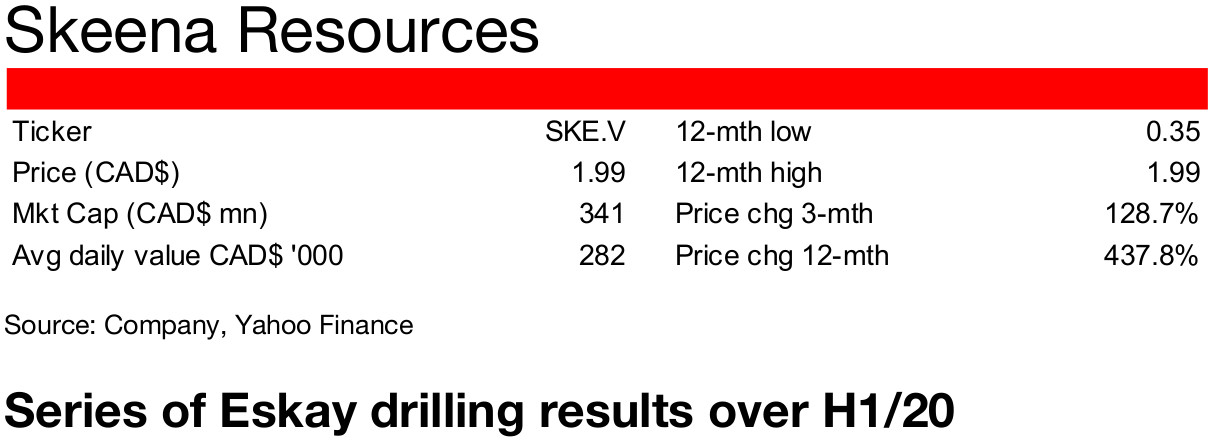
Two projects, historically strong Eskay Creek and Snip: The company operates two projects, Eskay Creek, for which a PEA was released in November 2019, and Snip, close to each other near the middle of the Golden Triangle, with both having access to established infrastructure. Eskay Creek has a strong production history of 3.3mn ounces of gold and 160mn ounces of silver from 1994-2008, at high grades.
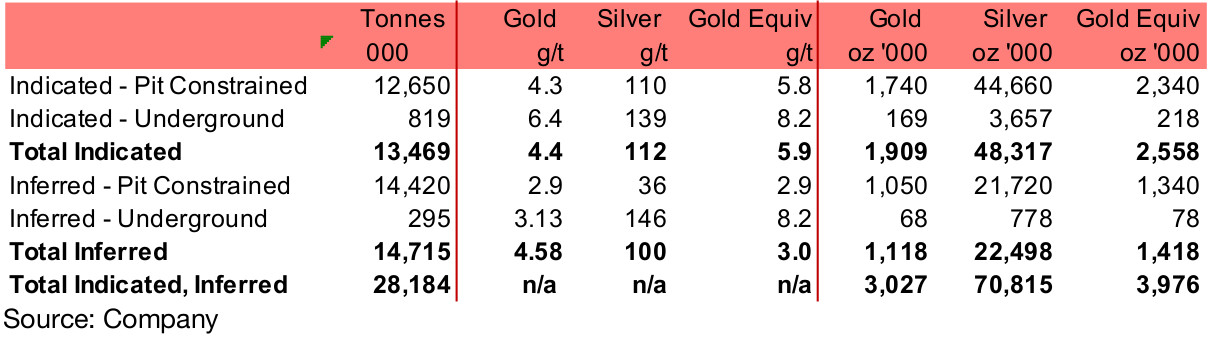
Eskay Creek resources estimated at 3,976k ounces: The company currently estimates total Indicated and Inferred resources at 3,976k AuEq ounces, with 3,027k ounces of gold and 70,815k ounces of silver (Figure 27). The majority of the total resource, 2,558k ounces, or 64% is Indicated, with 36% Inferred. Most of the resource, 92.6%, is pit constrained, with 7.4% of the resource underground.
Figure 27: Skeena Resources Indicated and Inferred Resources
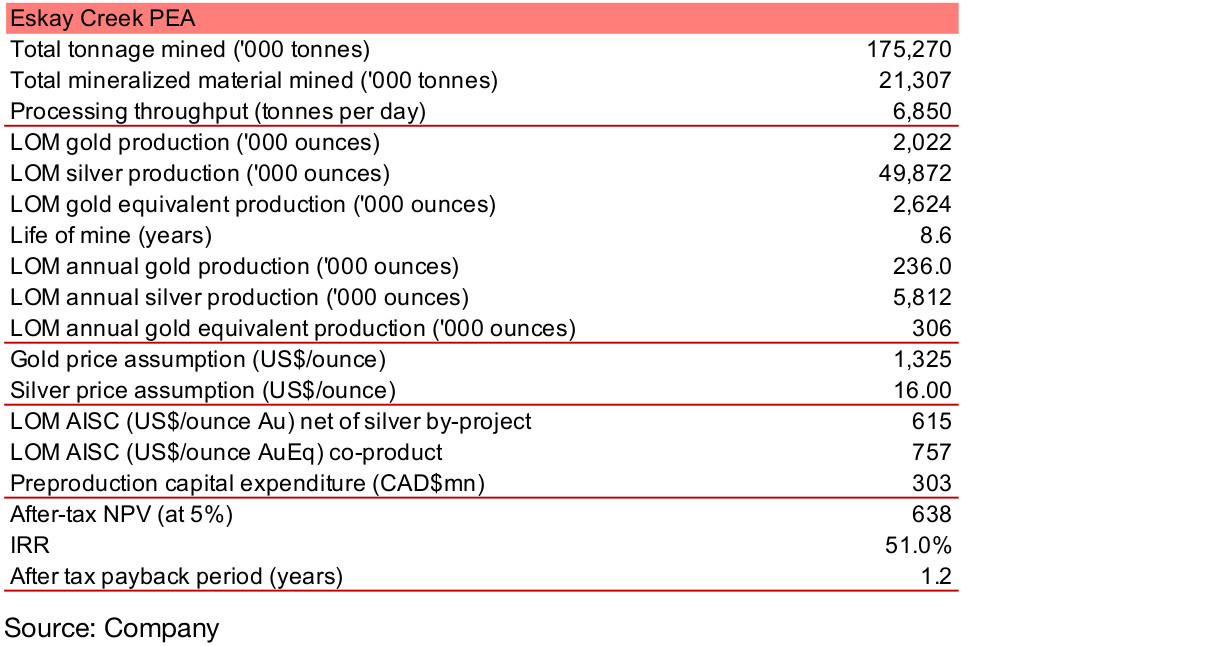
Eskay Creek PEA details released in April 2020: The company released a PEA for Eskay Creek in November 2019, with an after-tax NPV estimate of CAD$638mn at 5%, with 2,624k ounces AuEq LOM production, assuming a gold price of US$1,325/ounce and silver price of US$16.0/ounce, with a LOM cash cost by-product of US$582/ounce, and all-in sustaining cost of U$615/ounce, and initial capital expenditure of CAD$303mn (Figure 28).
Figure 28: Details of PEA for Eskay Creek
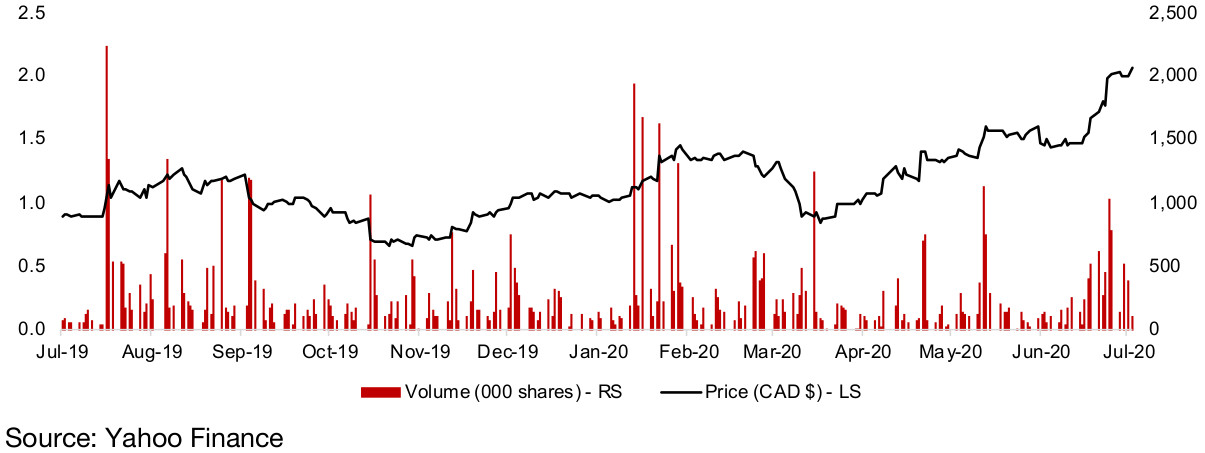
Skeena continuing to announce capital raising and drilling results in H1/2020: Skeena's news flow has shown progress over H1/20, with new drilling results every month, mainly from Eskay, but also from Snip in January 2020. The company has reported three increases in cash this year, including CAD$8mn in February 2020 from asset sales. The company also made a CAD$33.3m private placement, with a first CAD$20mn tranche announced in March 2020, and the second CAD$13.3mn tranche announced in April 2020. The share price rose further when the company announced in July it would exercise its option to acquire 100% in Eskay Creek, making Barrick Gold, one of the largest global gold producers, a 12.4% shareholder in Skeena.
Figure 29: Skeena Resources stock price, volume
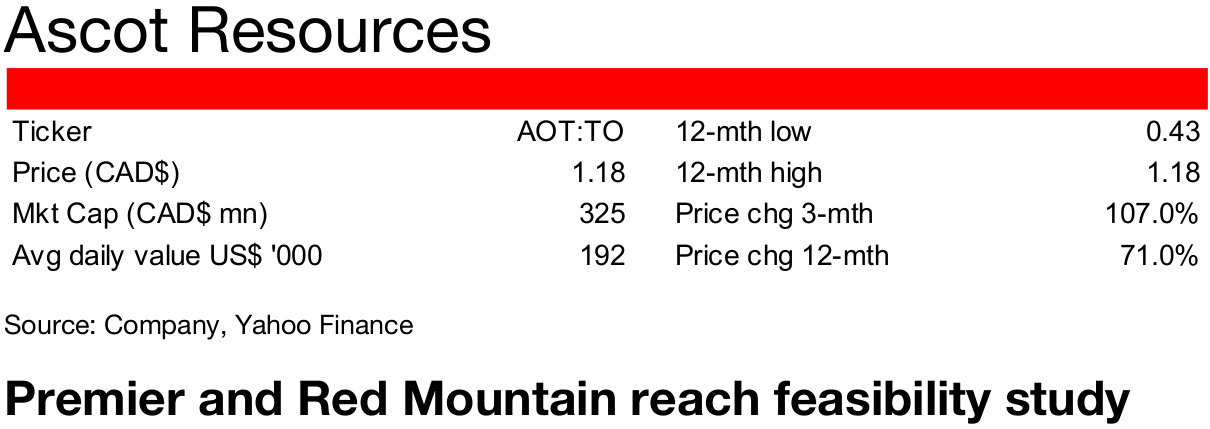
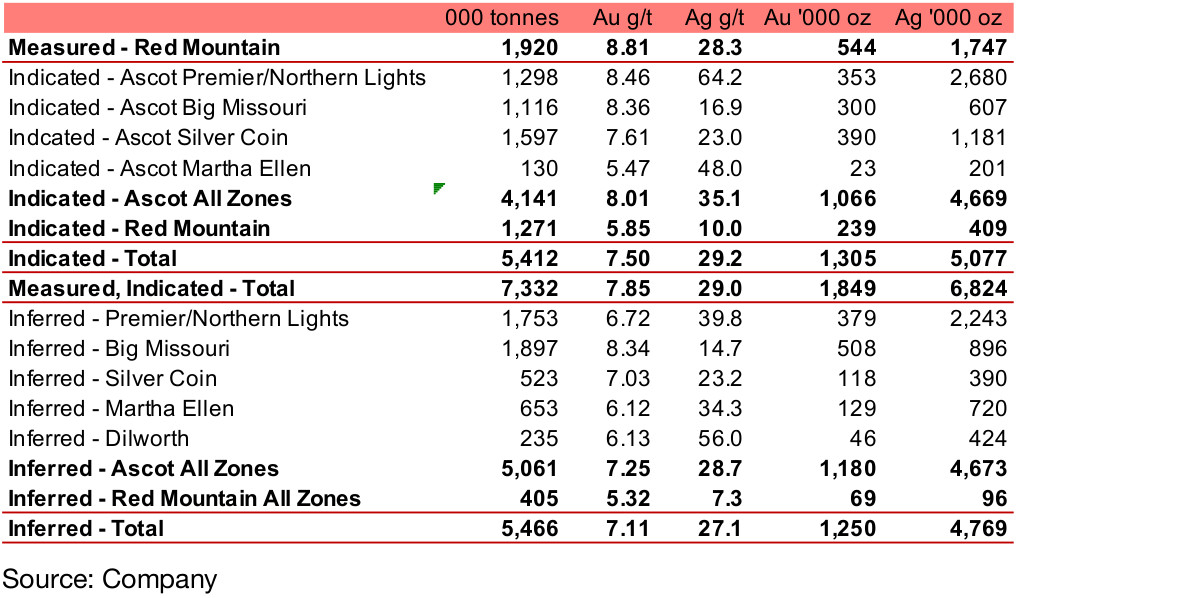
Southern Golden Triangle operator with two major projects: Ascot Resources operates in the south of the Golden Triangle, 25 km from Stewart, BC, with a 25,000 h.a. plot with five areas being explored, four at the Ascot project, Big Missouri, Silver Coin, Premier, and Martha Ellen, and a fifth at the Red Mountain project. Red Mountain has reached the Measured resource stage, with 544k ounces Au and 1,747k ounces Ag, while the Ascot project resource is still classified as Indicated (Figure 30). The total Indicated resources across all projects are 1,305k ounces Au and 5,077k ounces Ag, with total inferred resources at 1,250k ounces Au and 4,769k ounces Ag. The company also has two other assets, a sand and gravel project Swamp Point in B.C., and its Mt. Margaret copper project in Washington.
Figure 30: Ascot Measured, Indicated and Inferred resources
Existing infrastructure, local community agreements, permitting ongoing: Ascot's projects benefit from some existing infrastructure and progress in the permitting process. Ascot will not have to construct a mill, as it has the existing Premier Mill which remains in good condition, although it will require a general refurbishment and will need additional equipment to process potential output from Red Mountain. The company has agreements with the local Nisga'a communities, including a Benefits Agreement on Red Mountain and a Capacity Funding Agreement for Premier. The company is in the process of amending the existing Mines Act and Water Discharge permits for Premier, for which no Environmental Authority (EA) is required. An EA has already been granted for Red Mountain, and the company has started the exploration access application for the project.
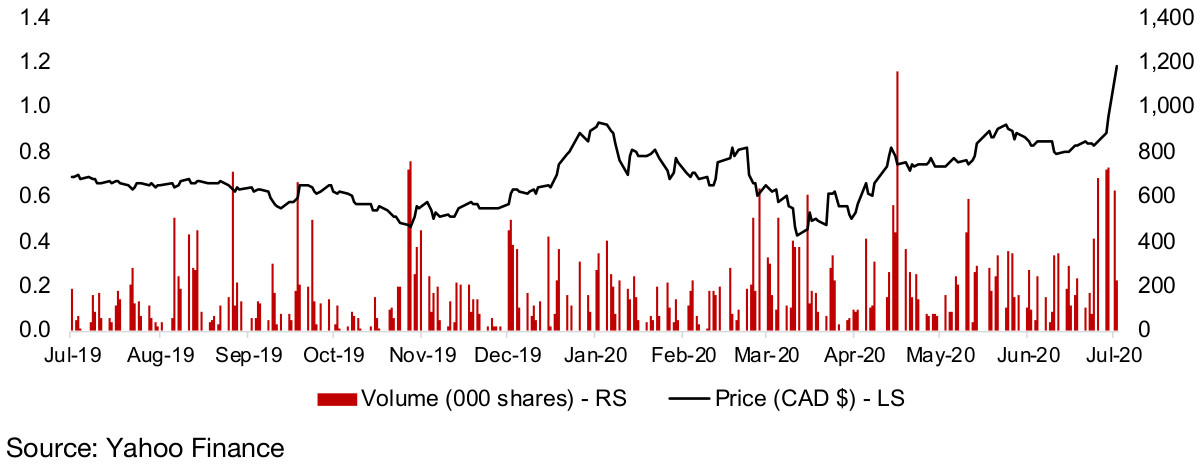
News flow for 2020 showing material progress: Ascot's news flow has indicated considerable progress in 2020. The company updated its Indicated resource estimate at Premier by 60% in January 2020 and raised a CAD$10.3mn private placement in February 2020. The most material news flow so far in 2020 was the completion of a feasibility study for Premier and Red Mountain, which was reported in April 2020. In May 2020, the company filed a feasibility study to restart the Premier Mill, and announced CAD$25mn in bought deal financing.
Feasibility study pretax NPV of $516mn: The feasibility study for the Premier and Red Mountain projects outlines a pre-tax $516mn NPV and after-tax $341mn NPV, at 5%, using Proven and Probable reserves of 6.2mn tonnes at 5.9 g/t Au and 19.7 g/t Ag, an initial capital expenditure $147mn, a LOM production of 1.1mn ounces Au and 3.0mn Ag with peak production of 180k AuEq ounces, with LOM cash costs US$642/ounce and all-in sustaining costs of US$769/ounce.
Figure 31: Ascot Resources share price and volume
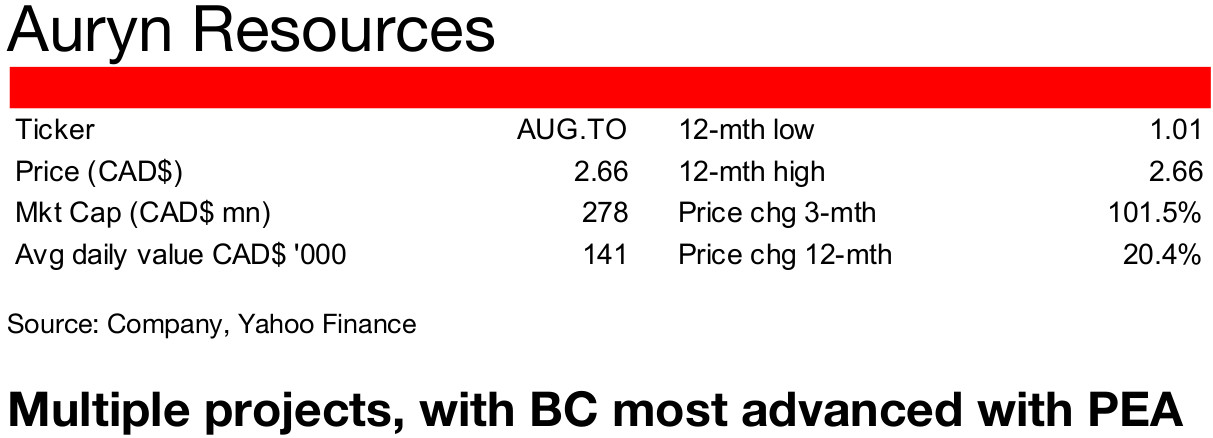
Operating projects in Canada and Peru: Auryn has six projects, with the Homestake Ridge gold project in B.C.'s Golden Triangle its most advanced, having reached the PEA stage. It also operates the Committee Bay and Gibson MacQuoid gold projects in Nunavat and the copper-gold skarn Sombrero project, the Curibaya precious metals project and the Huilacollo oxide gold project, all in Peru.
Figure 32: Auryn's Indicated and Inferred resources
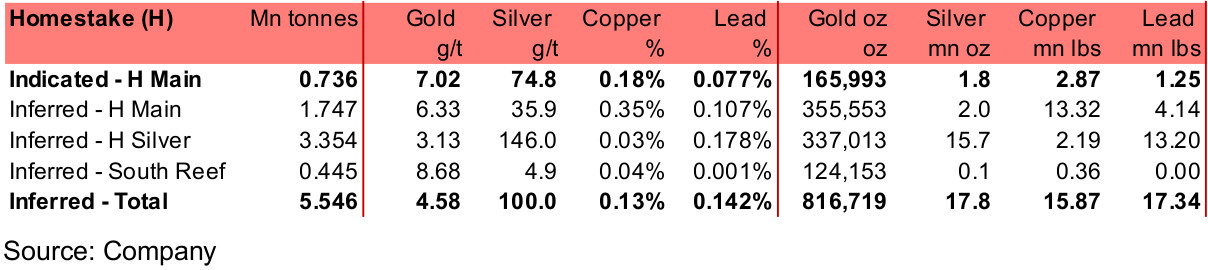
Homestake Ridge Indicated and Inferred Resources: The Homestake Ridge Indicated and Inferred resources are shown in Figure 32. Indicated resources are all at the Homestake Main zone, with 166k mn ounces Au, 1.8mn ounces Ag, 2.87 mn lbs Cu and 1.25mn lbs Pb. For Inferred resources, there are similar levels of gold in Homestake Main and Homestake Silver, but significantly higher silver resources in Homestake Silver, or 15.7mn ounces. The majority of the copper for the project is expected to be at Homestake Main, with 13.32 mn lbs Inferred resources.
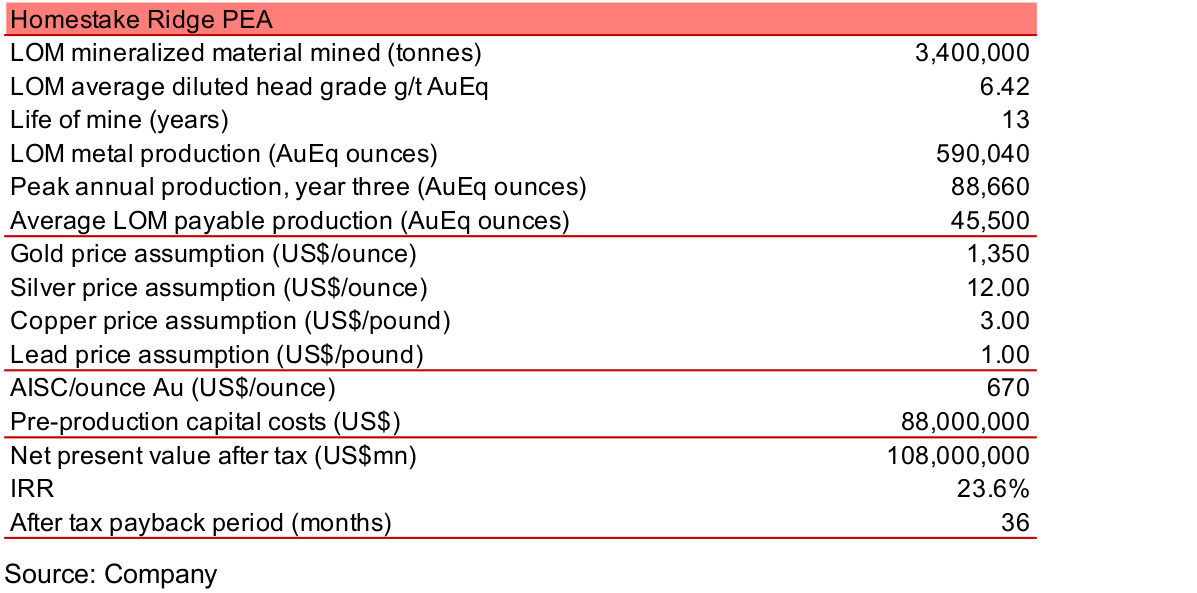
Homestake Ridge PEA completed: The Homestake Ridge project PEA was completed on April 15, 2020, with an after-tax of NPV of US$108mn, with 590k LOM AuEq ounces of production (Figure 33). The project is expected to have peak production of 88k ounces AuEq, assuming gold, silver, copper and lead prices of US$1,350/ounce, US$12/ounce, US$3.0/lb and US$1.0/lb, respectively, an AISC of US$670/ounce and an initial capex of US$88mn.
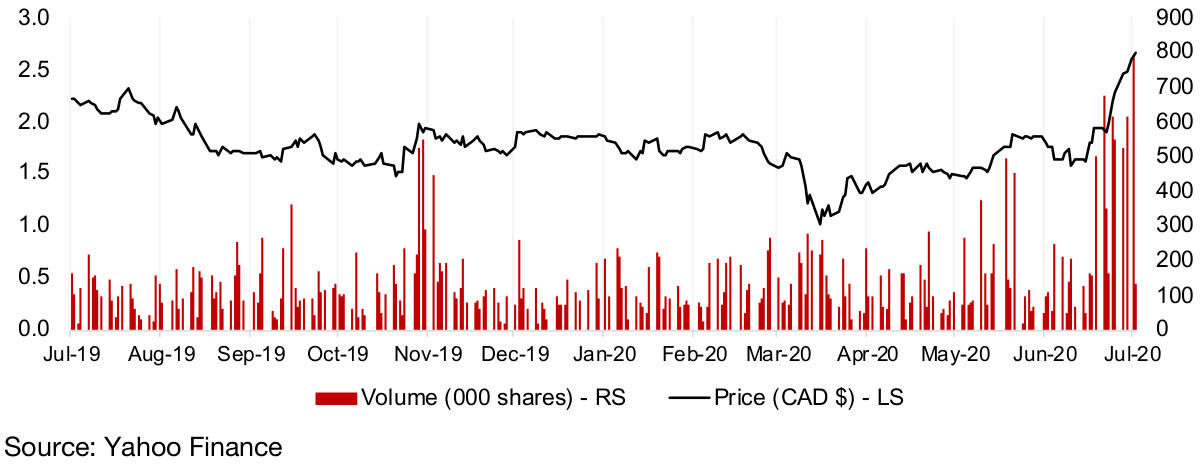
Figure 33: Auryn Resources share price and volume
Progress in financing and other projects in 2020: In addition to the major step of the PEA for Homestake, the company has been reporting progress on its other projects. The company reported age dating results for its Sombrero project in Peru in January 2020, and received an Environmental Permit in February 2020, and has now filed for its Start of Activities permit, putting it in the final permitting stage. At its Curibaya project in Peru, it reported mapping and sampling results in February 2020 and expects drill permitting this year. The company also announced some progress on historical data analysis of gold targets at its Committee Bay project in Nunavut in March 2020, with actual areas for drilling still to be determined.
Figure 34: Auryn Resources share price and volume
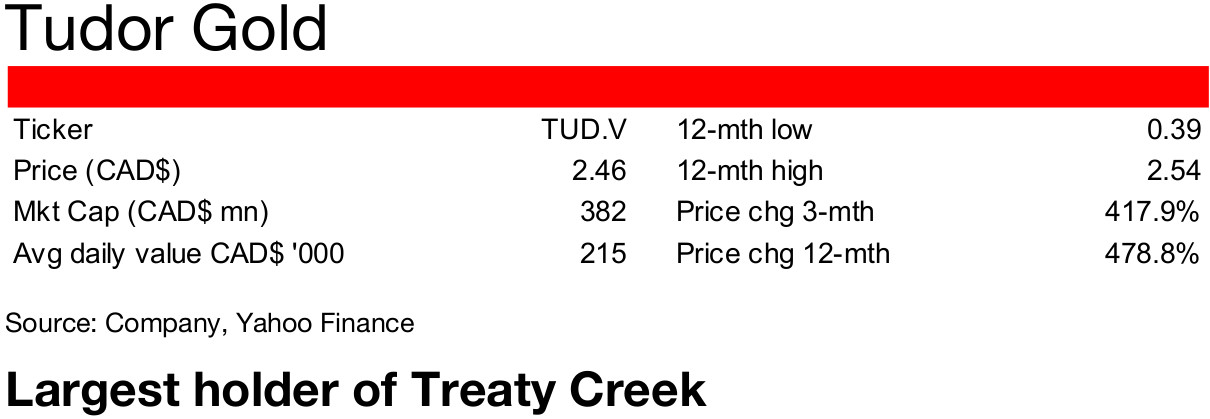
Tudor has four properties, two 60% owned JVs, two 100% owned: Tudor holds 35,518 h.a. over four properties in the Golden Triangle, Treaty Creek, a 17,913 h.a. 60%-owned joint venture with Teuton (holding 20%) and American Creek (20%), Electrum, a 650 h.a. 60%-owned joint venture with American Creek (40%), Crown, a 100%-owned 15,657 h.a. project, and Eskay North, a 100% owned 1,298 h.a. project.
Close to existing mines, infrastructure, agreement with local communities: The properties are close to two major discoveries, Seabridge's KSM project and Pretium's Valley of the Kings projects, which contain resources totalling over 72mn ounces Au and 13bn lbs Cu. They are also close to strong road, air and port infrastructure. The company has also signed engagement, communication and opportunity sharing agreements with the local Tahltan First Nation.
Figure 35: Tudor Gold Treaty Creek drilling results
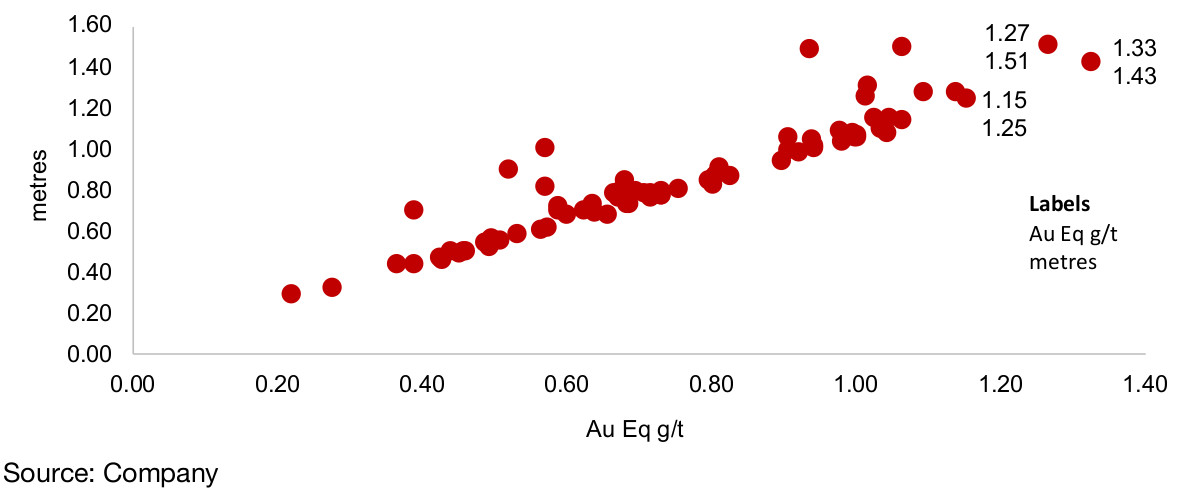
Recent upbeat news flow has driven up share price: The major news releases from the company in 2020 has been two reports in March 2020, one of drilling results from Treaty Creek, with details shown in Figure 35, and another with the company outlining that it is fully funded for its 2020 drilling program at Treaty Creek, after capital raising in December 2019, and the subsequent exercise of warrants in Q1/20. The company then announced the initial metallurgical test study at Treaty Creek in April 2020 to consider the viability of Treaty Creek becoming a bulk tonnage mine using conventional processing techniques, with test work done on results from drilling results from the exploration program in 2019.
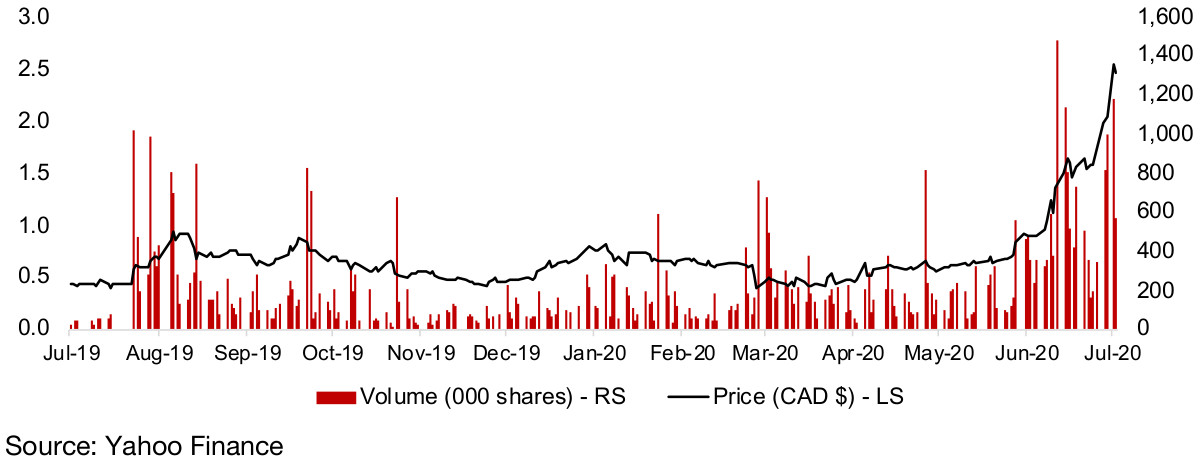
In May the company began its 2020 drilling program at Treaty Creek with two rigs, and in June added a third. It also announced the purchase of the remaining 40% of the Electrum project it did not already hold, from American Creek. Electrum is the site of the East Gold mine, which saw small scale production between 1939-1965 of 3,816 oz Au and 2,442 oz Ag, 15,369 meters of exploration by American Creek in 2006-2007, and 1,406 meters over 19 holes by the Tudor-American Creek joint venture in 2016. All this strong news flow over H1/20 combined, accompanied by a rise in the gold price, has sent the Tudor's shares soaring 418% over the past three months.
Well known mining players as major shareholders, balance sheet improving: While Tudor doesn't have the backing of a large producing miner, its President and CEO Walter Storm, who holds over 50% of the company, was the founder of Osisko Mining, and Eric Sprott holds 19.9%, following an exercise of CAD$2.9mn in warrants, and a private placement of CAD$9.3mn, both in June 2020. The company has also improved its balance sheet through reducing its CAD$320k debt to Teuton Resources in June 2020 via the issuance of 482k shares at CAD$0.664/share.
Figure 36: Tudor Gold stock price, volume
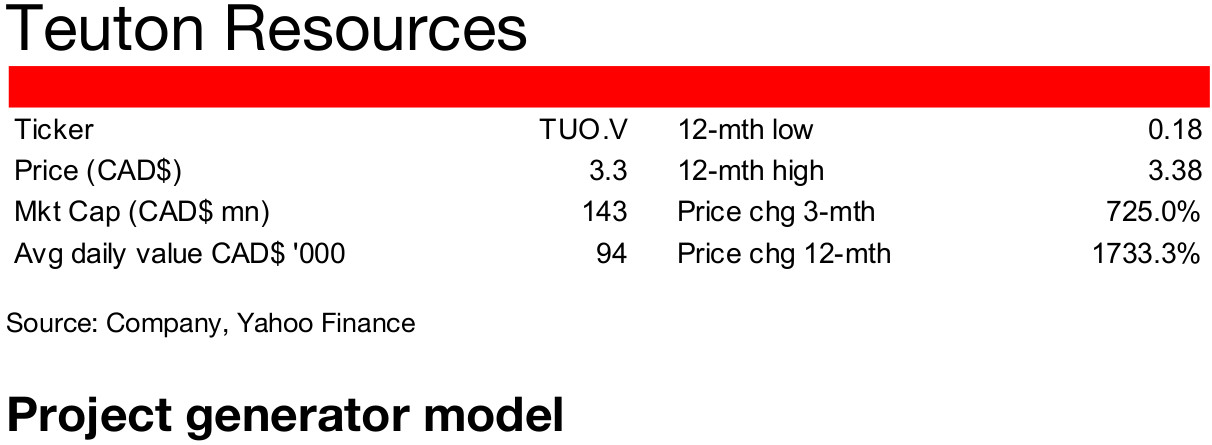
A project generator with interests in over 30 properties in the Golden Triangle: Teuton differs from the above companies in that rather than being a direct gold exploration firm, it has a project generator model, with interests in over 30 properties in the Golden Triangle, with seven currently under option, and ten projects providing NSR royalties to Teuton. The project generator acquires multiple properties and undertakes a first phase of exploration, with the intention to attract a partner for a more extensive drilling program.
Differentiating the project generator and junior miner model: This model generates value in three ways. The first is similar to junior miners, with the share price of the project generator rising after one of its holdings announces strong exploration or drilling results. The second is different from junior miners, as the company has option agreements to receive payments from several holdings over several years, supplying diversified and recurring revenue. The third is another key differentiator from the juniors, which can be acquired and delisted, requiring investors to redeploy capital. The project generator model instead spins out properties that will be acquired, leaving the core revenue stream aggregator continuing as normal and not delisted.
Strong stream of exploration and acquisition news flow in 2020: Teuton's recent news has comprised; 1) updates on exploration of its Del Norte project in the Golden Triangle, where Teuton is exploring directly, in August 2019 and November 2019, and news regarding an option by Decade Resources in January 2020, 2) reports from its partner Tudor Gold on progress at Treaty Creek, in September, October and December 2019, and March and April 2020, 3) increased holdings in properties, including increasing its 50% interest in the Clone gold-cobalt property to 75% in November 2019, after Sky Gold did not proceed with a 25% option held by Teuton and Silver Grail for Clone, leaving Teuton with 75% and Silver Grail with 25%, and 4) most recently a $2.4mn private placement of 3mn units at $0.80/unit, to Eric Sprott.
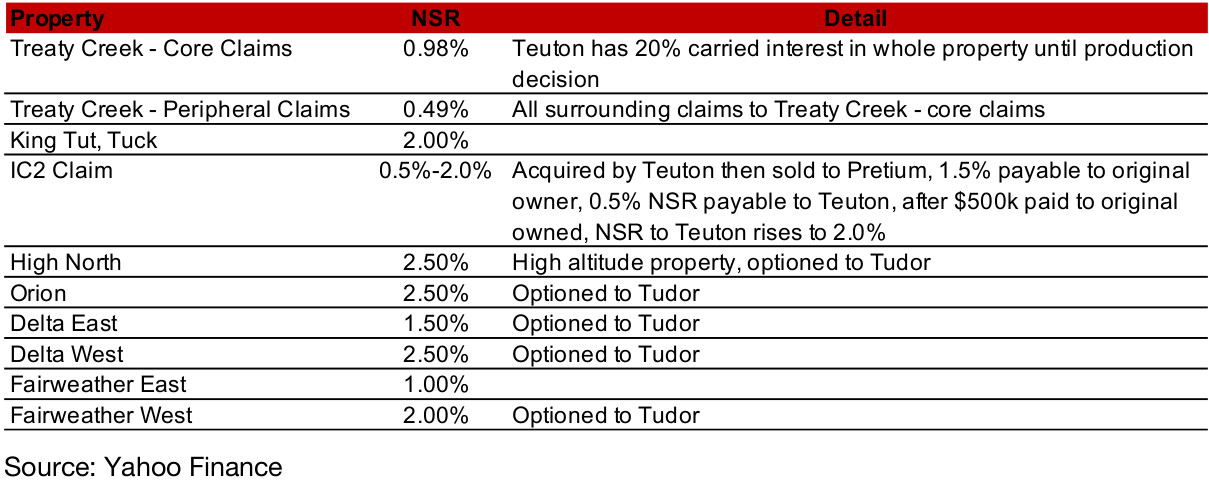
Company has key holdings in the SHS: Many of Teuton's core holdings are in the Golden Triangle's Sulphurets Hydrothermal System, which has one of the most concentrated metals deposits in the world, and is home to Seabridge's KSM, Pretium's Snowfield deposit and Tudor's Goldstorm zone at Treaty Creek, of which Teuton holds 20%. Teuton's NSR royalties from the SHS are shown in Figure 37.
Figure 37: Teuton gold mining property holdings in SHS
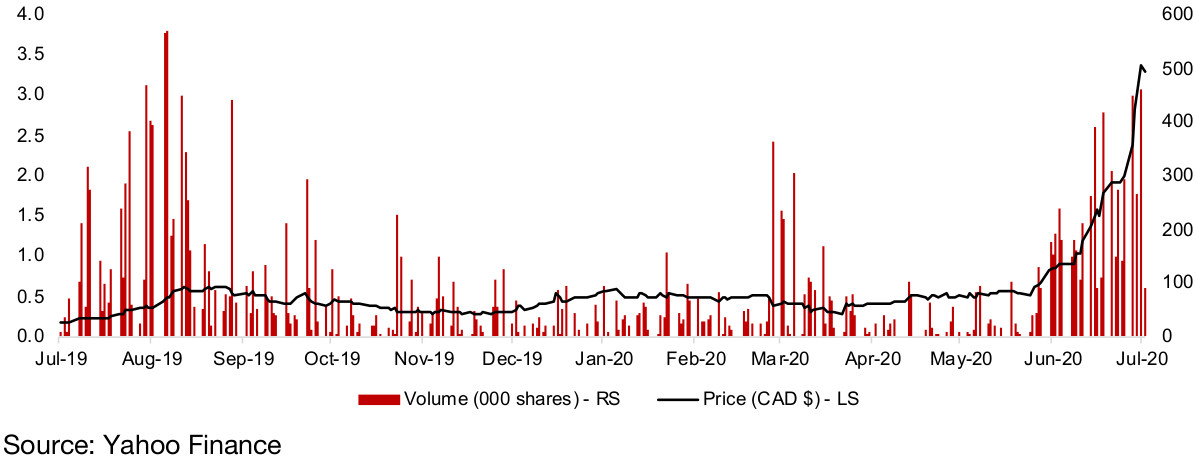
Share price rises even more than already strong ramp up in juniors: Even given the strong ramp junior mining share prices by between 92%-540% over the past two months, Teuton's share price has been outstanding, rising 725%. This premium is likely because the company's pooling of revenue streams supplies strong leverage to the rising gold price, but without the repeated risks faced by the average junior, which must reach a series of major milestones on the way to production or acquisition to investors' satisfaction, or risk a substantial share price decline.
Figure 38: Teuton Resources share price and volume
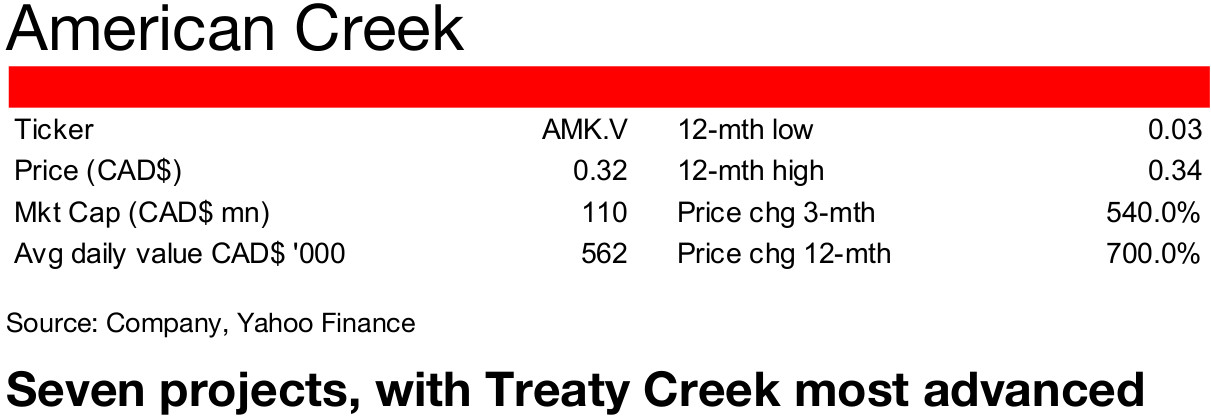
Holds 20% of Treaty Creek, a JV with Teuton and Tudor: The company operates seven projects in British Columbia, mainly gold and silver exploration, including Treaty Creek, a joint venture with Tudor Gold (with American Creek holding 20%, Teuton 20% and Tudor Gold 60%) and Dunwell in the Golden Triangle. Treaty is the most advanced, with a 20,000 drilling program planned for 2020, with Dunwell in a phase II drill program. Its Gold Hill project in Southeastern BC is also in a phase II drill program and other projects are in earlier mapping, surveying and sampling stages.
Newly raised capital jumps in H2/19: The company has seen a substantial increase in the capital raised over the past year. American Creek had only two private placements totaling $600k in 2018, and three totaling $360k in H1/19, but new financing rose over ten-fold in H2/19 to $3.91mn, with the closing of $0.3mn in July 2019, $1.0mn from Eric Sprott in August 2019, $1.76mn in September 2019 and $0.35mn in December 2019. Following this large expansion in capital, the company made a series of press releases of forward movement in its operations.
Company putting new capital to work in H1/20: In January 2020, the company announced the acquisition of claims and the extension of warrants, and drilling results from the Dunwell project in February 2020 and at Treaty Creek in March 2020. Then in April 2020 the company announced metallurgical test work and preliminary baseline studies at Treaty Creek, and the start of a 20,000 meter drill program at Treaty Creak in May 2020. Also in May 2020, the company announced the sale of its minority interest in the Electrum JV to Tudor Gold and the extension of warrants. The continued reported progress combined with the major surge in the gold price over the past few months has driven up American Creek's share price by 540% over the past three months, after it had remained relatively flat from mid-2019 to February 2020 (Figure 40).
Treaty Creek and Dunwell drilling results strong: The company's two main sets of drilling results over the past year have been from the Treaty Creek and Dunwell projects. With Treaty Creek 60% owned by Tudor, and American Creek holding just 20%, we shown the Treaty Creek drilling results from March 2020 above under the Tudor Gold summary. The most recent Dunwell drilling results are shown in Figure 39, based on Au Eq g/t, with most of the holes also containing gold as well as silver, copper, lead and zinc. Some highlights for Dunwell include; 13.3 g/t Au Eq with 2.2 g/t Au, 17.8 g/t Ag and 0.036% Cu, 28.6 Au Eq g/t with 13.9 g/t Au, 258 g/t Ag, and 0.438 g/t Cu, 18.44 g/t Au Eq with 7.89 Au g/t, 84.9 g/t Ag and 0.359% Cu, 20.269 g/t Au Eq, with 11.35 g/t Au, 142.5 g/t Ag and 0.22% Cu, and 24.35 g/t AuEq, with 9.4 g/t Au, 265 g/t Ag and 0.528 g/t Cu.
Figure 39: American Creek Dunwell drilling results
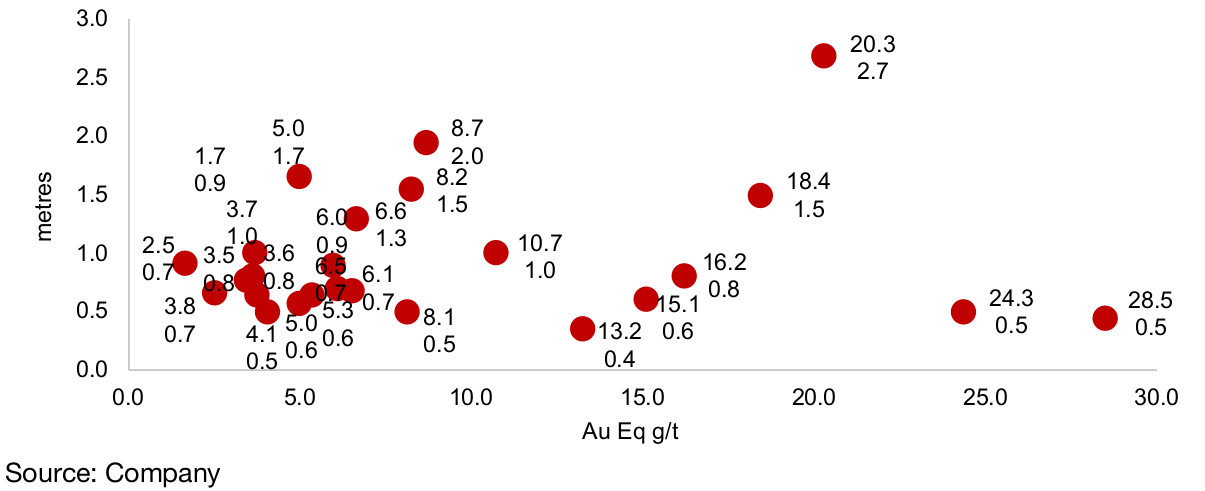
Figure 40: American Creek share price and volume
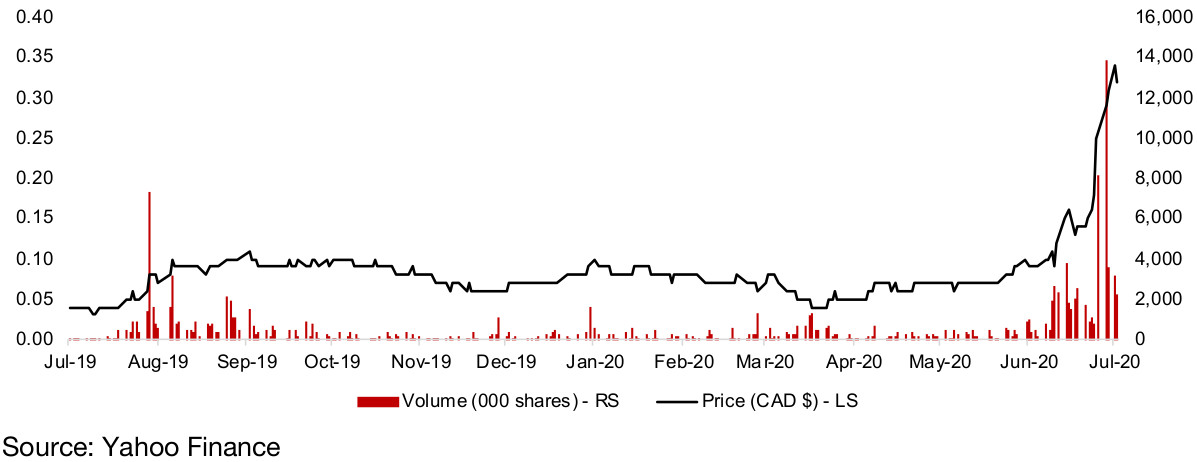
Company owns 100% of Lawyers gold and silver project: The company owns 100% of the Lawyers gold and silver project in the Golden Triangle. Benchmark Metals acquired the project in 2018, with initial drilling in 2019 showing promising results, indicating that the 90% of the 140 sq km property was underexplored. The project has historically produced 171,000 oz gold and 3.7mn oz silver, and has a strong $50mn in existing infrastructure including road access and is close to the already existing and permitted Baker Mill.
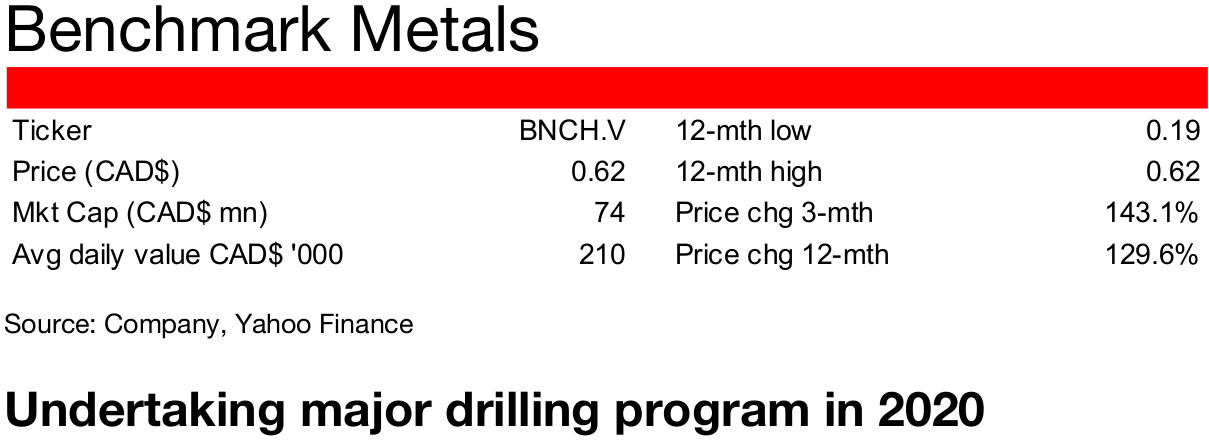
Undertaking 50,000 meter drilling program in 2020: The company started a new 50,000 meter drilling program in June 2020, targeting five zones for exploration, Cliff Creek, AGB, Phoenix, Phoenix South and Duke's Ridge, and reports that 90% of the 140 sq km property is underexplored. Cliff Creek is currently the core focus, where the company is targeting a 1.682mn oz AuEq to 1.924 oz AuEq resource and targets a PEA for the Lawyers project by 2021.
Figure 41, 42: Benchmark recent drilling results, Au Eq*
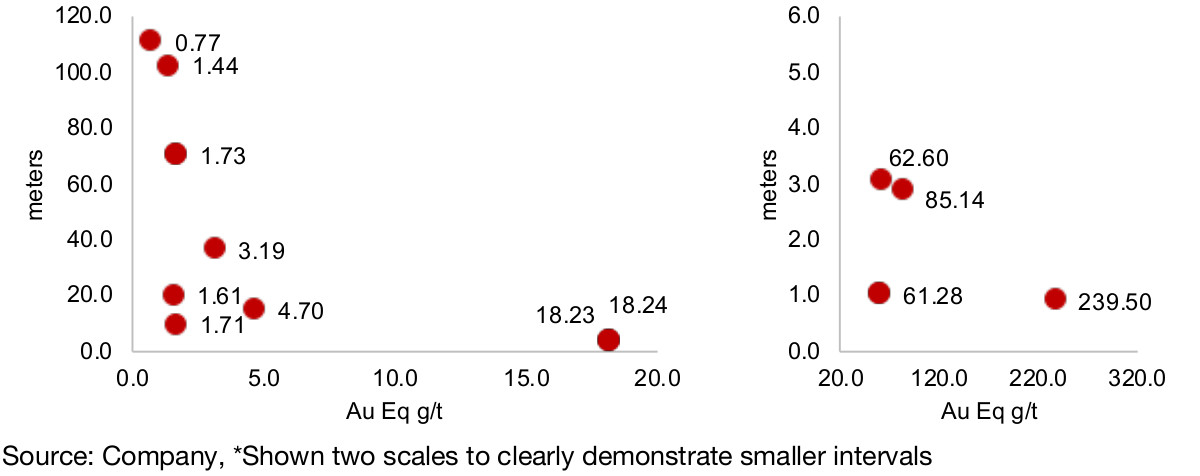
Figure 43, 44: Benchmark recent drilling results, Au g/t, Ag g/t
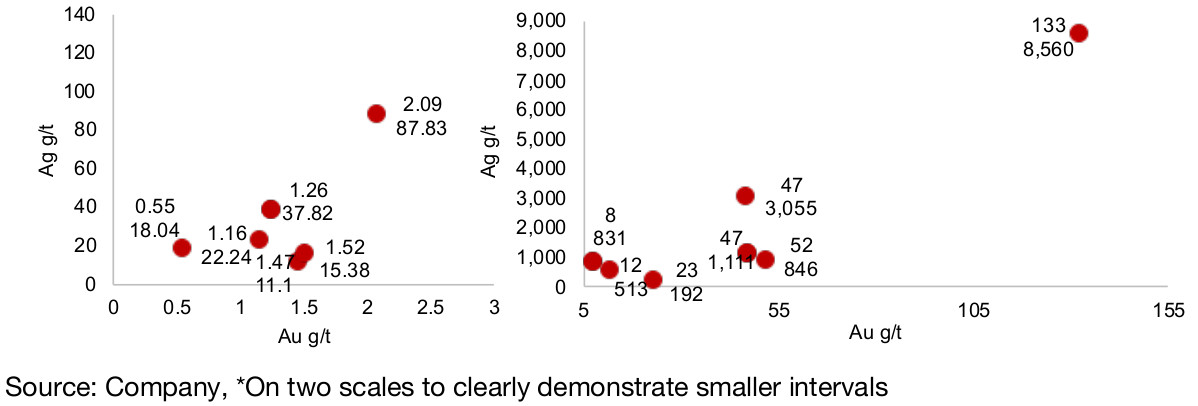
Several announcements on exploration progress in 2020: The company made a series of announcements in early 2020 of drilling results from the previous program from its Cliff Creek, Duke's Ridge and Lawyers projects. The highlighted drilling results are shown in Figures 41 and 42, with the Au Eq g/t and intervals, and the split between Au g/t and Au g/t for the same intervals is shown in Figures 43 and 44. Other major press releases this year included a definition of a bulk tonnage exploration target at Cliff Creek in February, an expansion of its metallurgical program, and the near completion of road development at its Lawyers Gold-Silver project in April 2020. In May 2020 the company announced a new target area at the Silver Pond Zone, and in June 2020 that geophysical surveys had started in this new area. This continued progress in operations matched with the surging gold price has driven the shares up 129.6% over the past three months.
Figure 45: Benchmark Metals share price and volume
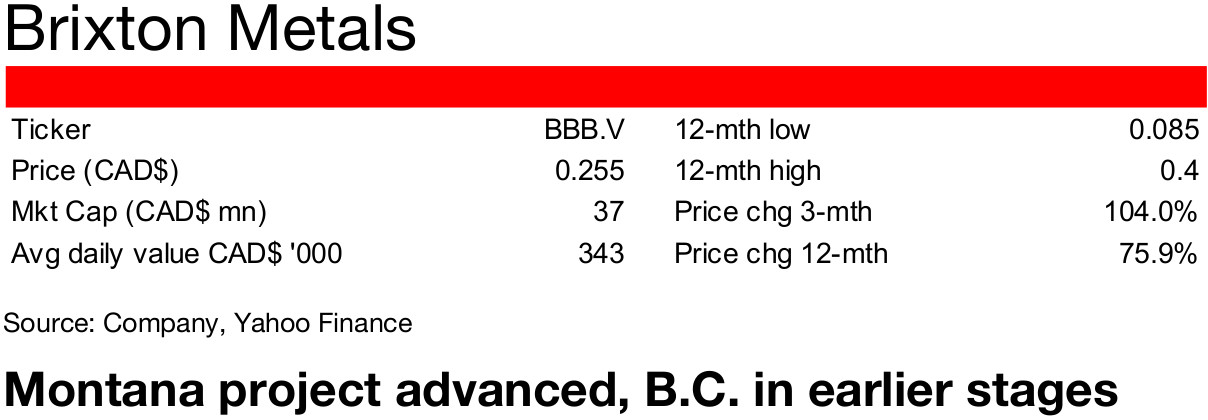
Projects in Golden triangle, Ontario and Montana: The company has four projects, two in BC's Golden Triangle, one in Ontario and one in Montana. The most advanced project is the Montana Hog Heaven gold project, with drilling planned this year, and an upgrade of the resource into compliance targeted by 2021. The BC golden triangle Thorn and Atlin projects are at earlier phases of geophysical surveying, and the company plans exploratory drilling at Langlis, its silver project in Ontario, in 2021.
Hog Heaven has over 100 year production history: Hog Heaven has seen exploration as early as 1913, and produced silver, gold, zinc and copper output from 1928-1975. Since then there has been some exploration, and prior to Brixton, Pan American Silver maintained an operation permit and did baseline water sampling. In 2017, Brixton acquired 100% of the project with a 3% NSR to Pan American. The Hog Heaven historical, non-NI-43-101 compliant resource was 10.3mm tonnes, with 142 Ag g/t for 47.3mn oz Ag, and 0.68 Au g/t, for 0.23mn oz Au.
Drilling program on Hog Heaven through to November 2020: Brixton has been undertaking extensive geophysical work at the property, has constructed a new core facility, is permitted and ready to drill, and has 10 non-forest, non-BLM wholly owned land sections. The company is now undertaking a drilling program to run from May 2020 to November 2020 focusing on high grade Ag-Au-Cu zones, aiming to define a maiden resource sufficient for a PEA.
Thorn and Atlin project geophysical surveys ongoing: Brixton's 2,300 sq km Thorn project is at an earlier phase of development, with a geophysical survey ongoing at Camp Creek in the move towards selecting drilling targets. Surveying so far has been over only a 100 km sq area, so there is still considerable room for further exploration. For the Atlin project, which is at an earlier stage than Thorn, the company plans a major soil survey this year, collecting 5,000 samples.
Recent results from Langis and Hog Heaven: The company announced exploration results from its Langis silver project in Ontario in May 2020, with 992.5 meters drilled over sixteen holes, with highlights including 1,293.34 g/t Ag over 5.0 m, including 3,205 g/t Ag and 0.15 cobalt over 2.0 m, and 250.97 g/t Ag over 6.0 m. In June the company announced the start of its drill season at Thorn in the Golden Triangle, with drilling results shown in Figures 46 and 47. In July 2020 Brixton announced drilling results from its first major program at Montana's Hog Heaven, with highlights including 445.79 g/t Ag, 1.41 g/t Au and 1.50% Cu over 5.48 m, 917.36 g/t Ag, 2.00 g/t Au and 3.06% Cu over 2.13 m, 165.90 g/t Ag, 1.28 g/t Au and 0.55% Cu over 53.49 m, with recent Au g/t and Ag g/t results from Hog Heaven in Montana shown in Figure 48.
Figure 46, 47, 48: Brixton Metals drilling results
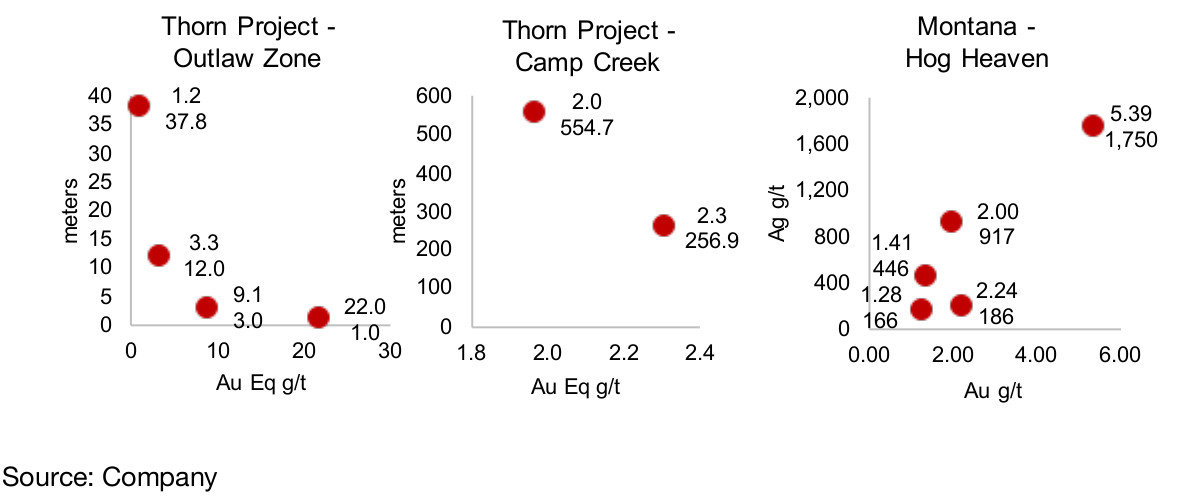
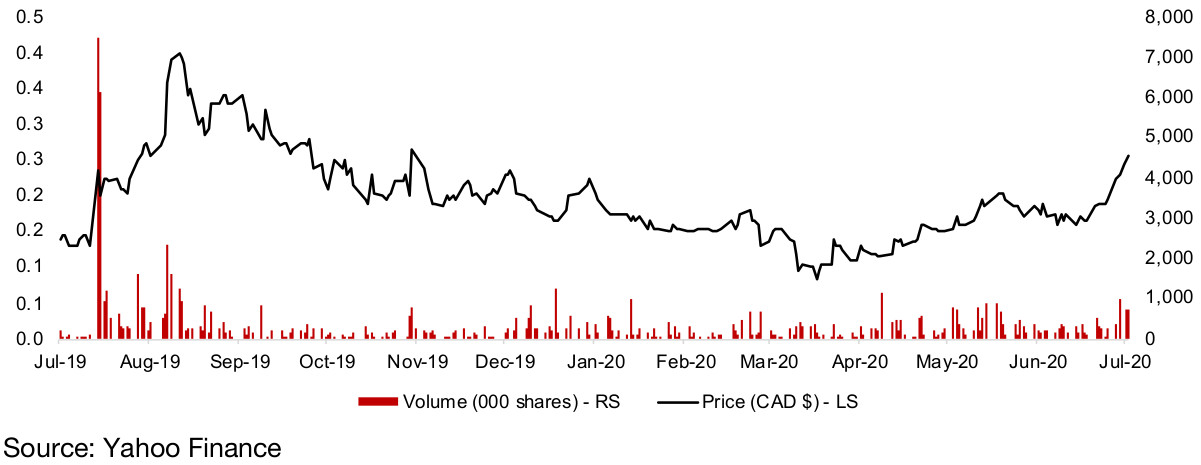
Figure 49: Brixton Metals share price and volume
Golden Triangle juniors continue to ramp
Many factors combining to drive interest in Golden Triangle juniors
Region has potential for monster find
Golden Triangle has strong mix of drivers
The Golden Triangle in British Columbia has a strong mix of drivers currently for junior gold miners, including; 1) huge potential high grade gold deposits, 2) considerable infrastructure improvements over the past decade, 3) a reasonably strong district in terms of global investment attractiveness, and 4) a surge in the gold price. These factors combined should continue to drive interest from junior miners in the region, and drive in capital to support their operations for the foreseeable future.
Gold price likely to be maintained at a high level for considerable period
Capital continues to move into junior miners
Gold likely to remain elevated
The gold price will remain crucial in driving the gold mining upcycle, and the current drivers point to a continued high gold price, with it recently reaching its highest level in nine years, over US$1,800/oz. The gold price is likely to be supported at levels well above US$1,600, at which level many gold mines are clearly profitable, given a combination of; 1) a major continued monetary expansion by the US Fed, with other major regions potentially following suit given a slowing global economy, 2) still elevated global risks related to the health crisis, and 3) alternative assets that are not as currently attractive as gold given the likelihood of lower yields compared to recent years.
Golden Triangle junior gold mining share prices surging on rising gold
Golden Triangle well positioned to see continued high interest from investors
Golden Triangle junior share prices surging
All of the share prices of Golden Triangle focused junior miners and the project generator covered in this report have surged in the past three months, between 92%-725%. With the gold price continuing to head above US$1,800/oz, and the sector heavily leveraged to the gold price, there is the potential for continued gains in the Golden Triangle junior miners this year. The rising prices could also create a feedback effect where the additional capital increases the chance for a major find, drawing in even more capital. After six lackluster years for both gold overall and the Golden Triangle, we could still be quite early in this burgeoning upcycle.
Disclaimer: This report is for informational use only and should not be used an alternative to the financial and legal advice of a qualified professional in business planning and investment. We do not represent that forecasts in this report will lead to a specific outcome or result, and are not liable in the event of any business action taken in whole or in part as a result of the contents of this report.