October 2, 2020
Gold bounces back
Author - Ben McGregor
Gold rises back to within previous range
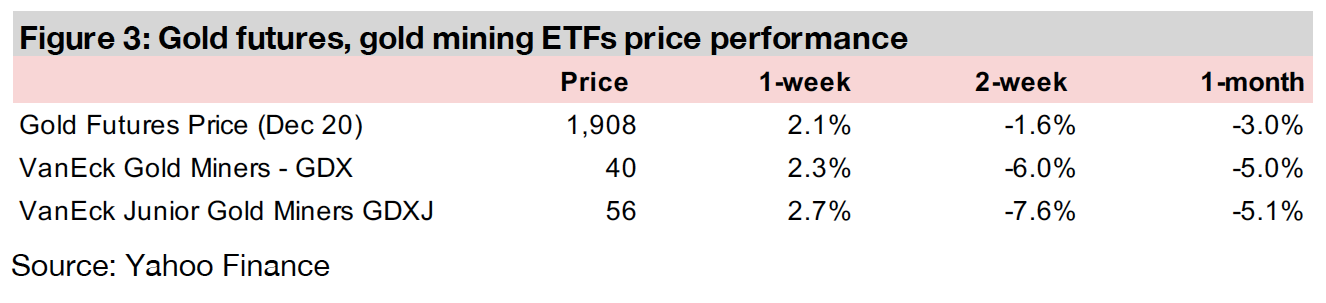
The gold price closed at US$1,908/oz this week, up 2.1%, which saw it rise back to within the trading range of around US$1,900/oz-US$2,00/oz that had held for eight weeks prior to the substantial -3.7% dip last week driven by US dollar strength.
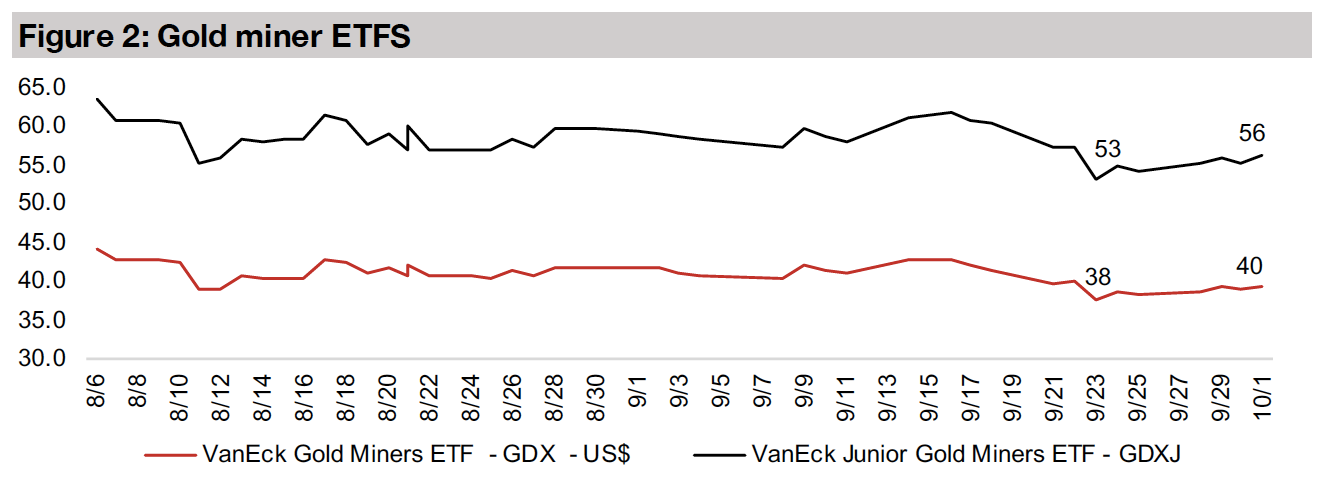
Producing gold miners rise with gold gains
The producing miners rose this week on the gains in gold, with the GDX up 2.3%, although the trend of the past month has been bearish, with the GDX down -5.0% over the past month and -6.0% over the past two weeks.
Canadian junior gold miners mostly recover
The global junior gold miners rose, with the GDXJ up 2.7%, and most Canadian junior gold stocks recovering. This week we check in on the overall performance of the internationally operating Canadian gold juniors over the past twelve months.


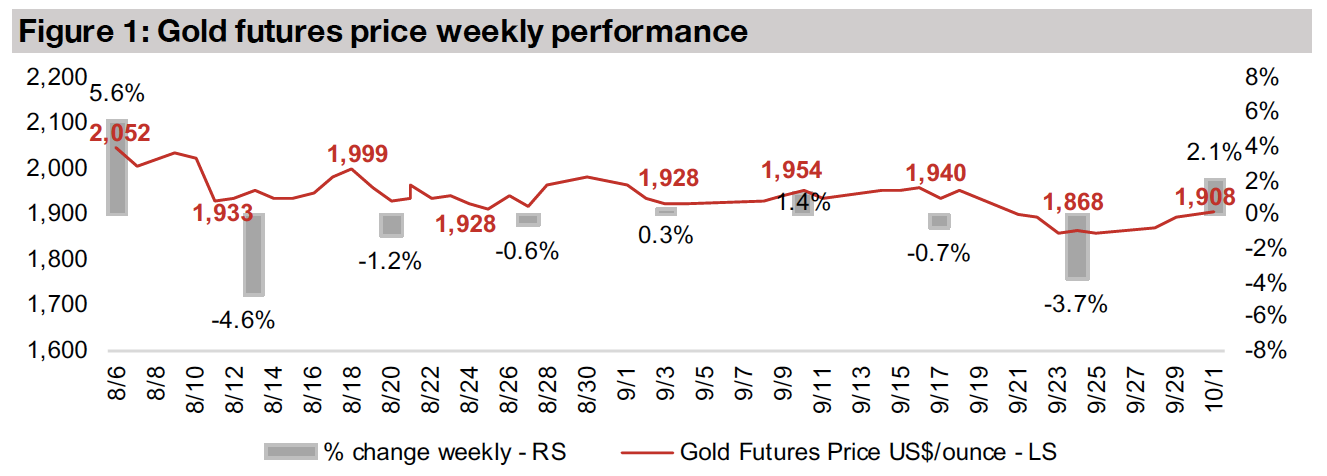
Gold drops below recent trading range
The gold futures closed at US$1,908/oz this week, up 2.7%, and bringing it back within a range of around US$1,900/oz-US$2,000/oz that had held for two months prior to last week's substantial -3.7% decline on a strengthening US dollar. While there have have been some attempts by bears over the past two months to push gold below US$1,900/oz, last week's push was probably the most decisive, although it didn't hold. We still see the results of the US election, given its strong effect on the outlook for the US dollar and global economy, as being the next big fundamental catalyst to potentially shift gold out of its current range.
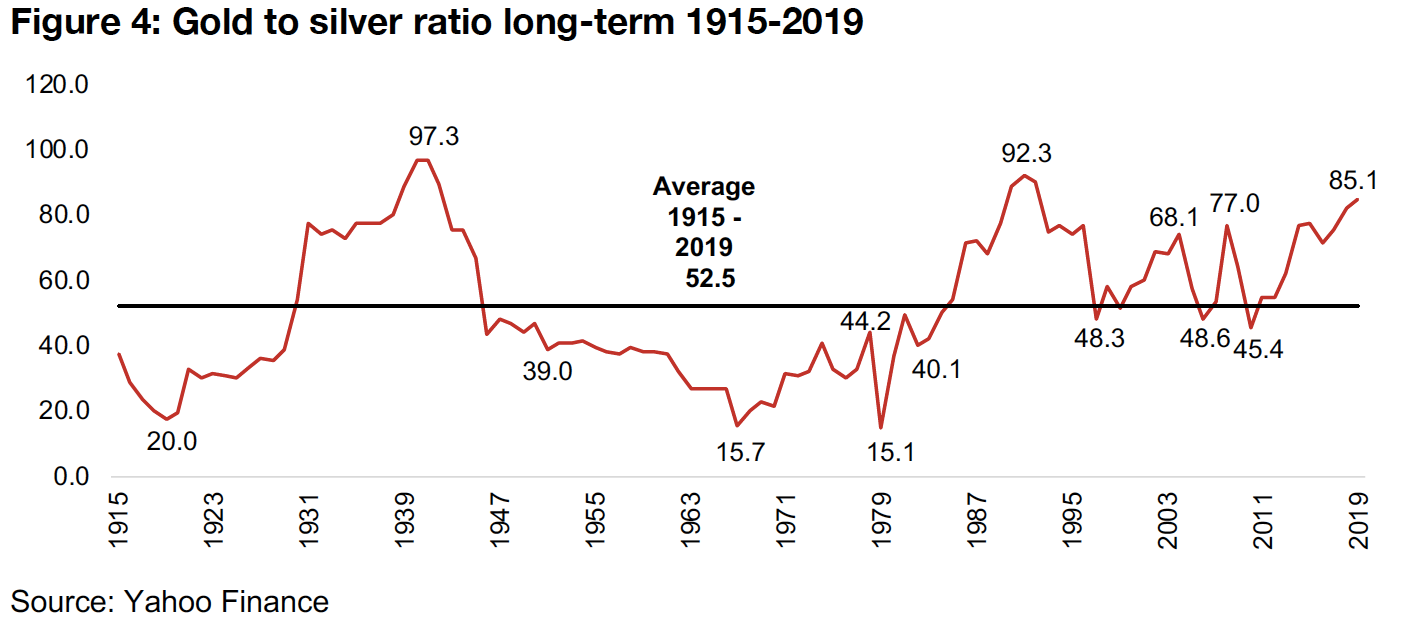
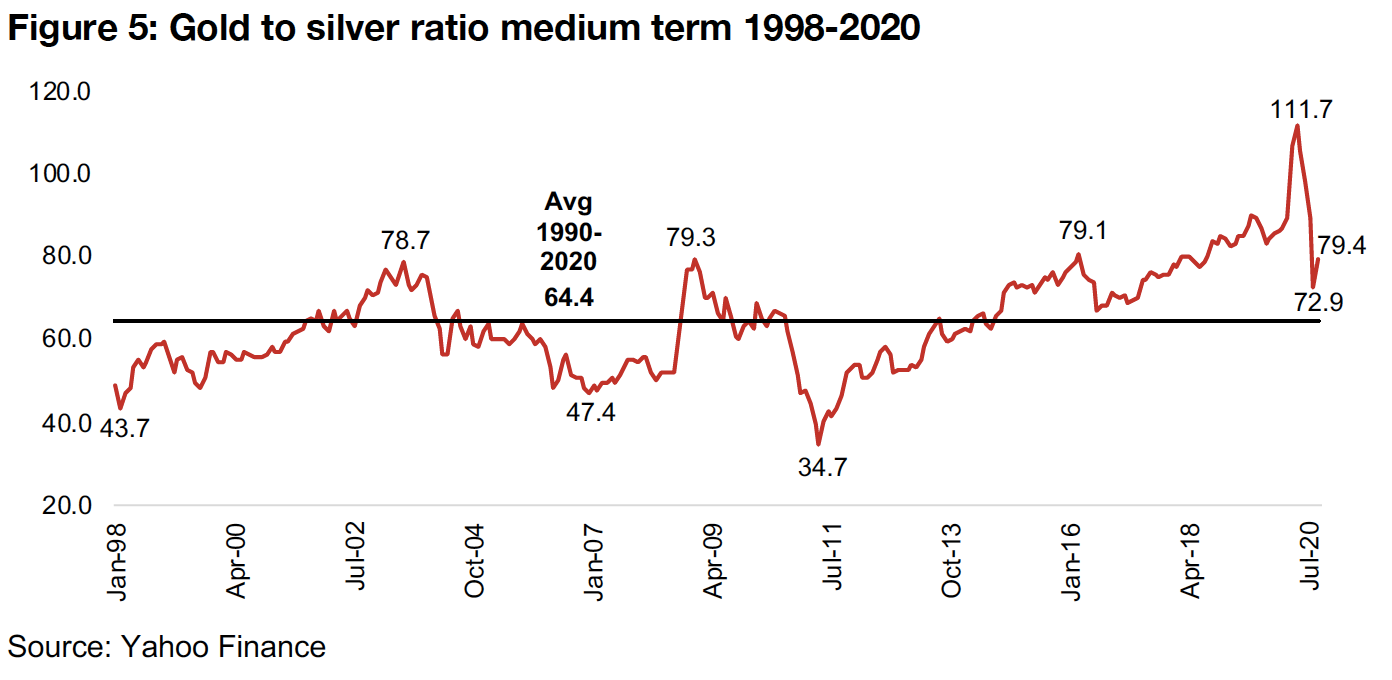
A look at the gold to silver ratio, both long and medium-term
In keeping with our recent look at silver stocks, this week we examine the history of the gold to silver ratio, which is considered a key indicator of the relative valuation of the two metals by the market. Data for the ratio go back as far as 1915, with the ratio averaging 52.5 from 1915-2019, with a peak at 97.3 in 1941 and a trough at 15.1 in 1979 (Figure 4). Taking a more recent look at the ratio from 1998 until the present, we see that the average has been higher, at 64.4, and that gold's spike in H1/20 sent the ratio to its highest ratio ever, at 111.7 in April 2020. We could have expected therefore at that point, that either a drop in gold, or a rise in silver was certainly to be expected, and in the ensuing months, especially July 2020, there was a major spike in silver, bringing the gold to silver ratio down to levels not seen since H1/17. With the gold to silver ratio still above the average since 1998, and a high gold price still fundamentally supported given a continued major monetary expansion, low yields on alternative assets and generally high global macro risks, we see a higher chance for an increase in the silver price to bring this ratio in balance, rather than a decline in the gold price.
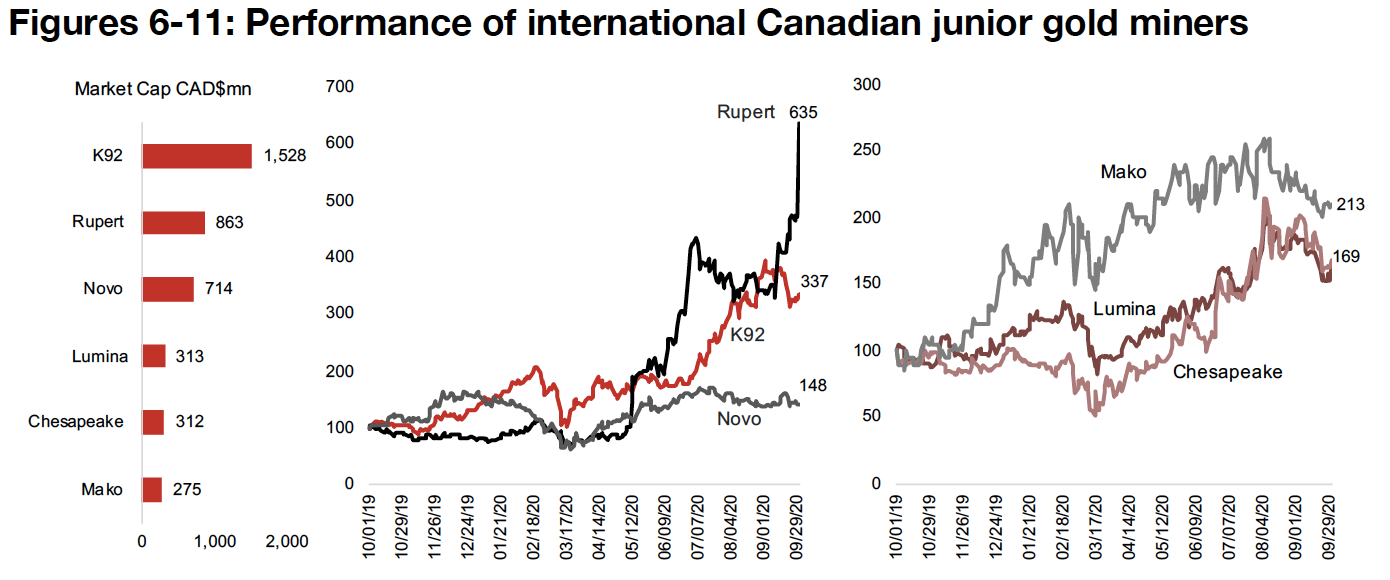
A look at the internationally operating Canadian junior gold miners
This week we look at the 12-month performance of the internationally operating Canadian junior gold miners, to help put the recent slide in the gold price and its effects on these juniors, in context, as well as differentiate the strong performers from the extremely strong performers, in a sector where most of the stocks have done well this year. Starting with the larger cap stocks (Figure 7), Rupert Resources (Mkt Cap: CAD$863mn) is by far the stand-out of the group, up 535% over the past year. While the company is not as advanced as many of the other names in the group, and has not even reached the PEA stage, results from its exploration at the large Pahtavaara project in Finland, have been very encouraging. The company saw a major jump especially with the announcement on May 12, 2020 of very strong results from its new Ikkari target at Pahtavaara, and it has spiked again this week on Ikkari results.
Prior to Rupert's recent gains, the largest miner of the group, K92 Mining (Mkt Cap: CAD$1,528mn) had been the strongest performer, and is still up 237% over the past year. K92 operates the Kainantu Gold Mine in Papua New Guinea, and is differentiated from the peer group as the only company with a mine in production, starting in 2018. So while it is continuing exploration activities, it is now more of an intermediate miner than a pure junior. The third of the larger cap stocks, Novo Resources (Mkt Cap: CAD$714mn) is up 48%, a strong absolute performance, although it obviously pales in relative terms to Rupert and K92. The company operates three projects in Northwest Australia's Pilbara Craton, with Beaton Creek the company's most advanced project, with an initial resource estimate having been released and the company considering a path to production. Novo has strong shareholder backing, with Kirkland Lake, Eric Sprott, the Creasy Group and Newmont all holding material stakes.
Of the mid-cap stocks, Mako Mining (Mkt Cap: CAD$275mn) has performed the best, up 113% (Figure 8). The company operates in Nicaragua, with its San Albino project having advanced to the PEA stage, with an after-tax NPV of CAD$173.9mn, and is currently undertaking delineation of a maiden resource at its Las Conchitas project, which is highly mineralized, and three times the size of San Albino. Both Lumina Gold (Mkt Cap: CAD$313mn) and Chesapeake Gold (Mkt Cap: $CAD312mn) have similar market caps and performances over the past twelve months, up 65% and 69% respectively. Lumina has a strong history, selling seven projects and a portfolio of royalties since 2006, and is currently developing the Cangrejos project in Ecuador, with a PEA with an NPV of $1.6bn. Chesapeake is mainly focussed on Mexico, with its Metates in Durango State the most advanced project, have reached the pre-feasibility study.
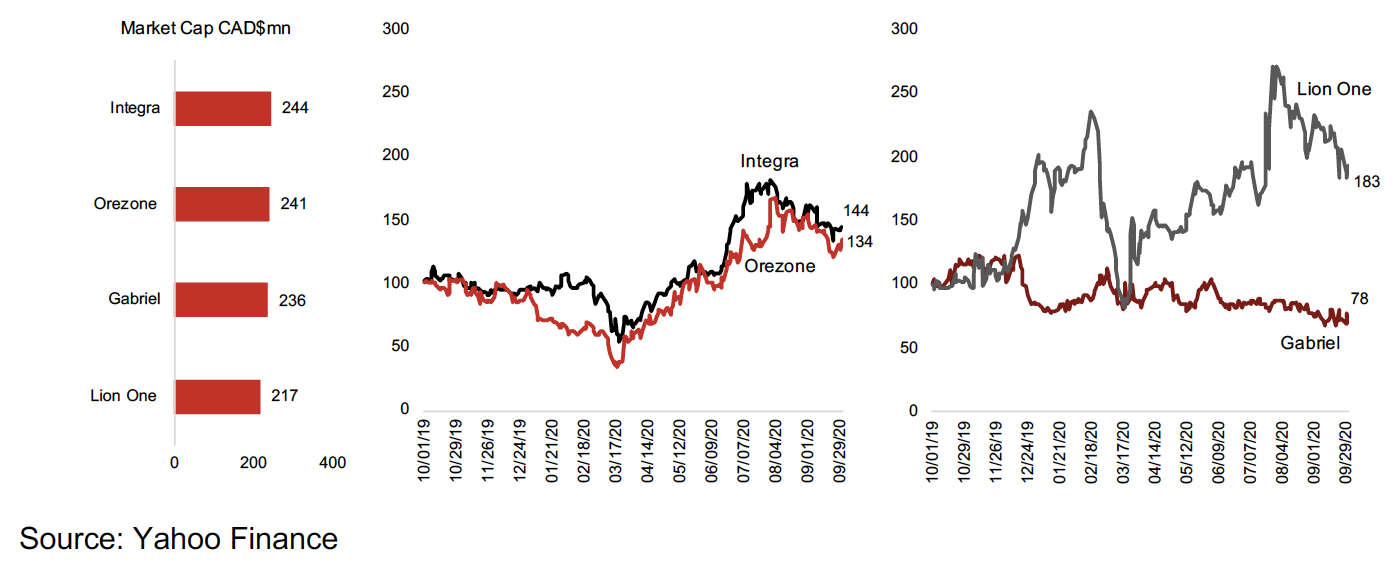
Of the smaller-cap stocks Integra Resources (Mkt Cap: CAD$244mn) has seen the strongest performance, up 44%. The company operates in Idaho, U.S., with its Delamar project at the PEA phase with an NPV of CAD$357.6mn, while its Florida Mountain project has released an initial resource and is the focus of the current drilling program (Figure 10). Orezone Gold (Mkt Cap: CAD$241mn) is up 34%, with its Bombore project in Burkina Faso having completed it feasibility study, with a PEA estimating a $361.0mn NPV at US$1,300/oz gold. The only stock in the group that has declined over the past month is Gabriel Resources (Mkt Cap: CAD$236mn), down 18% this year, as its advanced project Rosia Montana in Romania has been on hold because of major political issues related to the designation of the project area as a potential UNESCO World Heritage Site (Figure 11). Lion One (Mkt Cap: CAD$217mn) is up 83%, with an updated PEA for its Tuvatu Gold project in Fiji having been recently released, with an NPV of $155.8mn.
Producing gold miners rebound
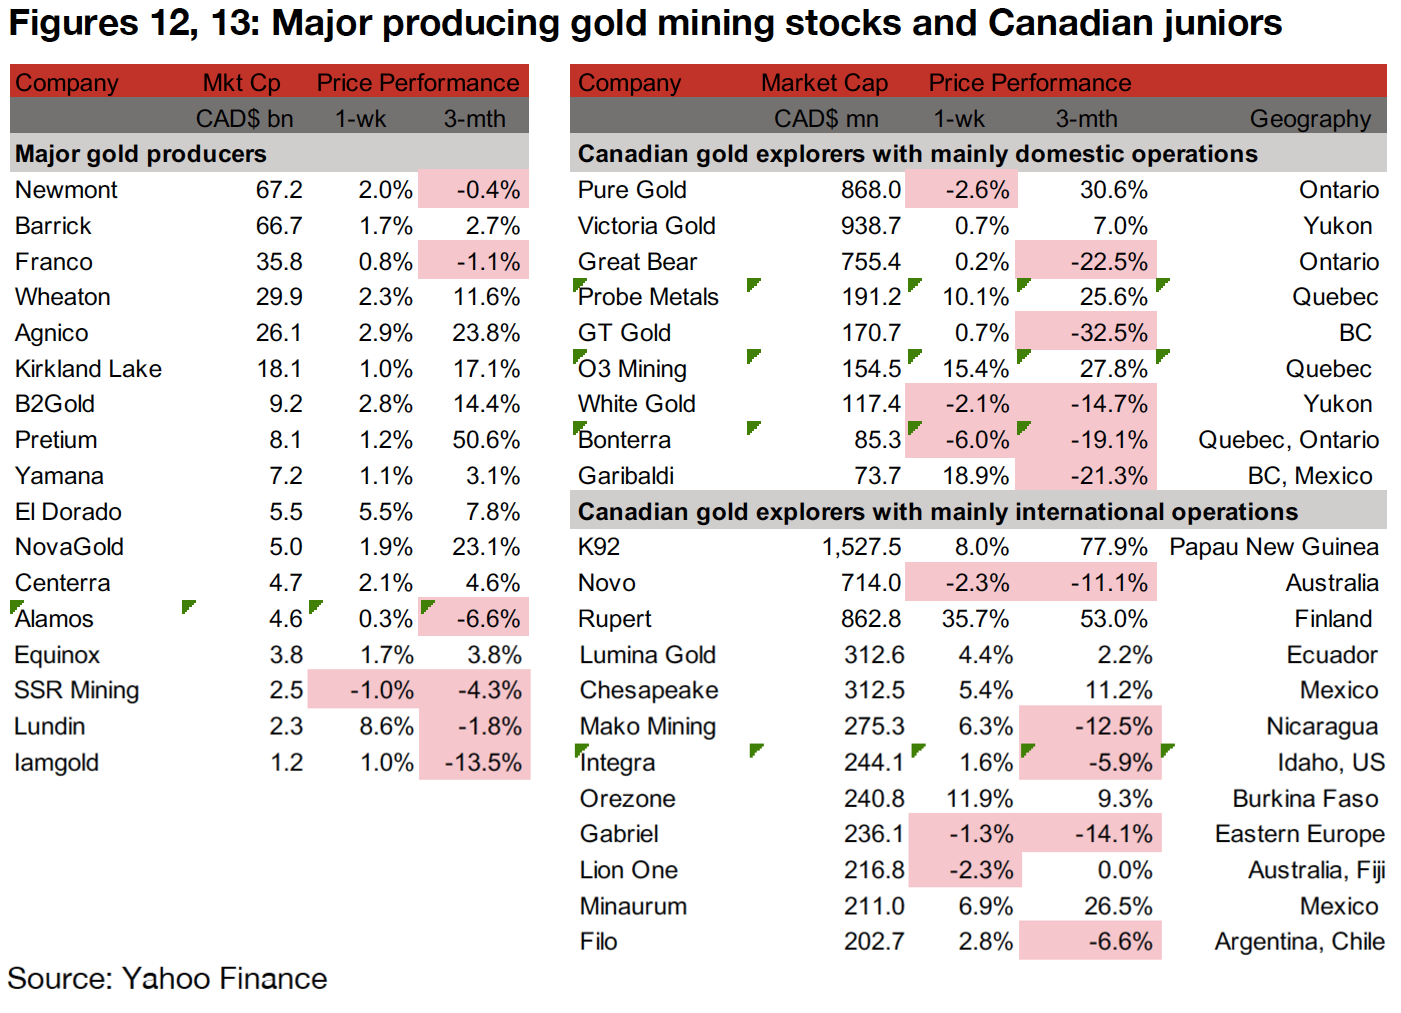
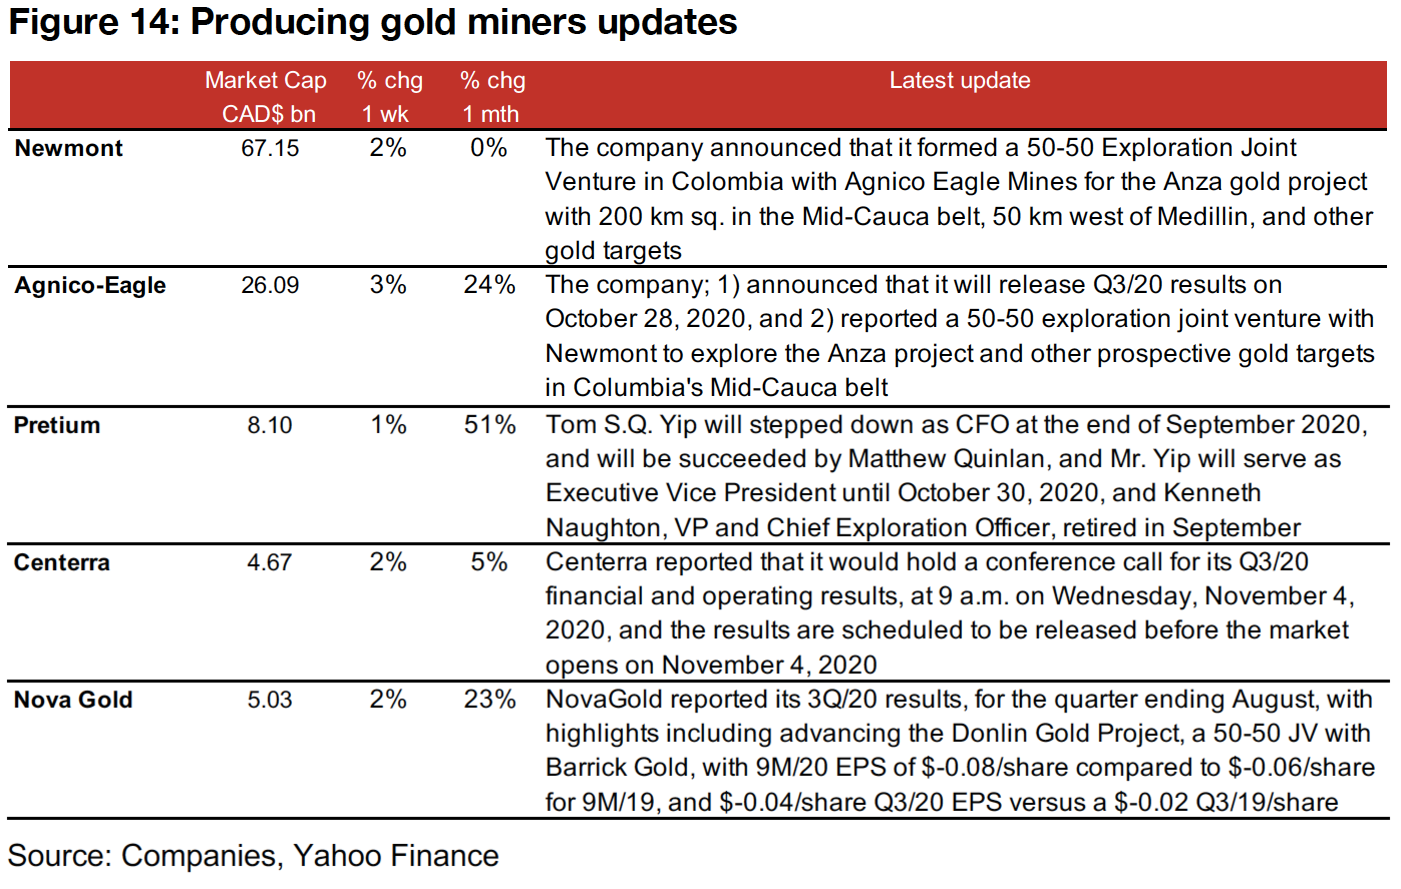
The producing miners rebounded this week as the gold price recovered from last week's dip, with most seeing gains in the low single digits (Figure 12). News flow included Newmont and Agnico-Eagle forming of a joint venture for exploration in Columbia in the Mid-Cauca Belt, while Pretium highlighted management changes, Centerra released its Q3/30 results conference call details and NovaGold reported Q3/20 results (Figure 14). Other companies reported exploration updates, with B2Gold extending mineralization at Cardinal and Mambo, Alamos extending mineralization at its Island Gold Mine and Equinox completing the construction of Phase 1 of its Castle Mountain Gold Mine.
Canadian gold juniors operating domestically mostly make gains
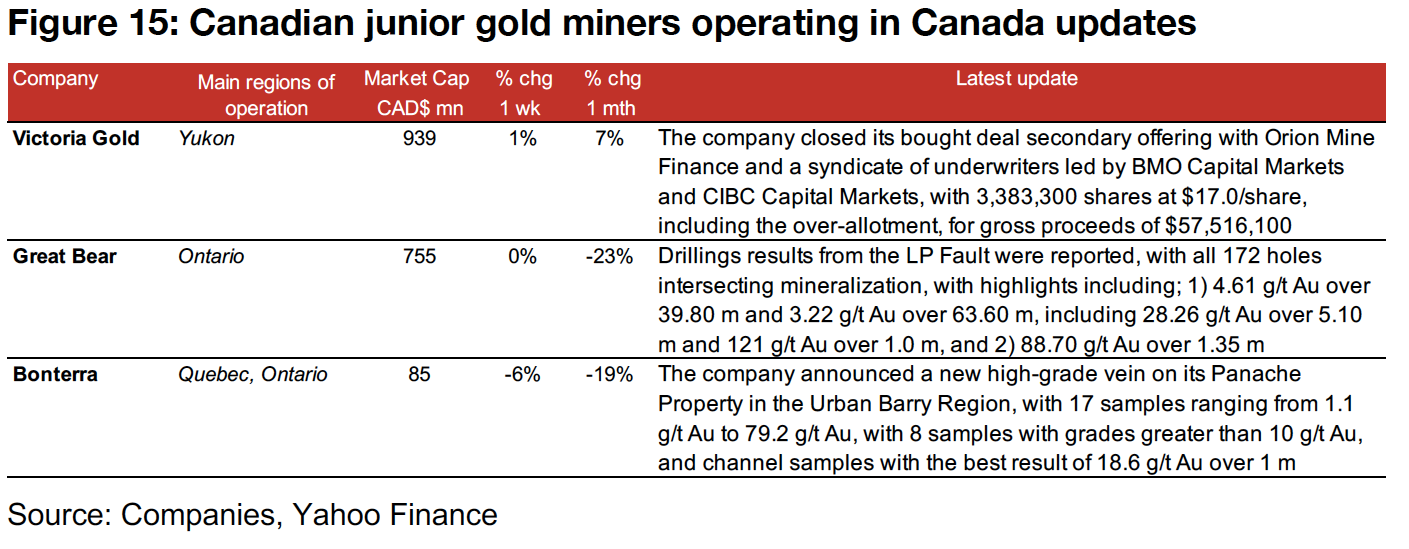
The Canadian juniors operating domestically mostly gained this week, although three out of nine were up under a percent for the week and three declined (Figure 13). News flow included Victoria's closing of its bought deal secondary offering, Great Bear's reporting drilling results from the LP Fault at its Dixie Project, and Bonterra announcing a new high-grade vein on its Panache Property in the Urban Barry region (Figure 15).
Canadian gold juniors operating internationally mainly rise
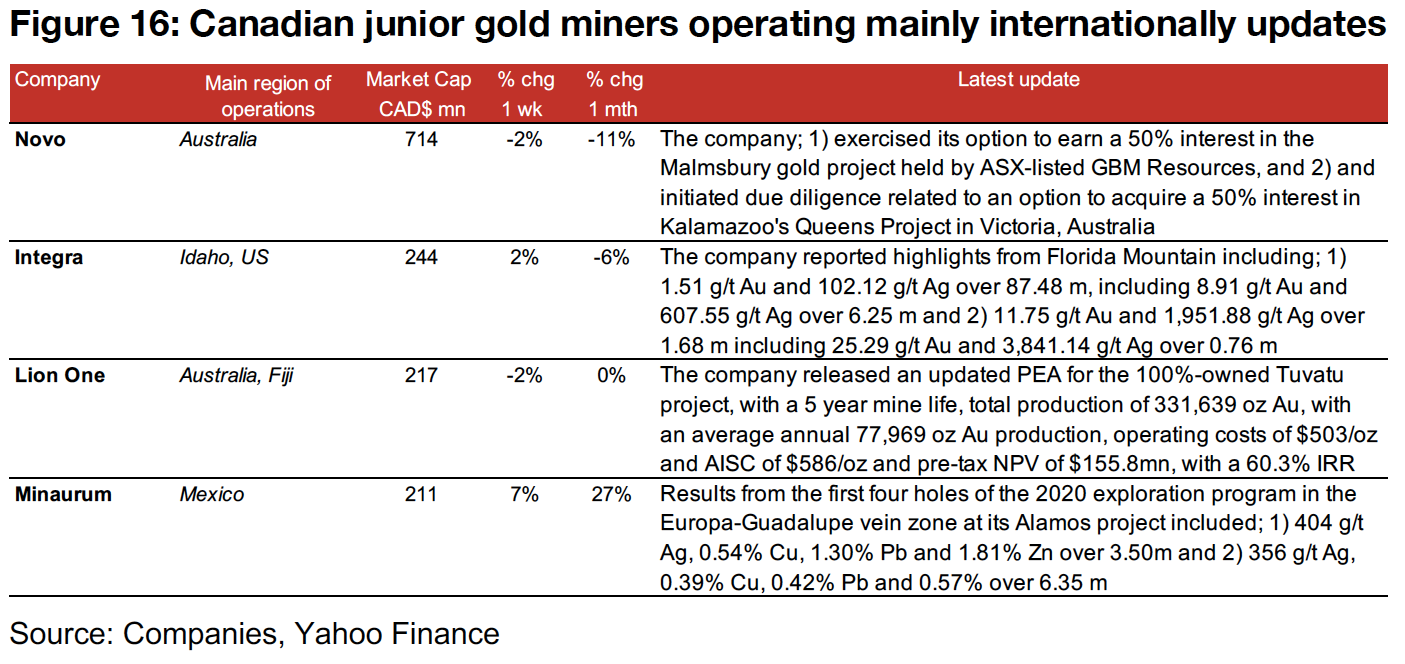
The Canadian juniors operating internationally almost all rose this week, with standouts including Rupert Resources, up 35% for the week after reporting strong drilling results from the new Ikkari target at its Pahtavaara project in Finland (Figure 13). Other news flows included Novo's plans to exercise an option for a 50% stake in ASX-listed GDM Resources' Malmsbury project, Integra reporting drilling results from Florida Mountain, Lion One releasing an updated PEA for its Tuvatu project, and Minaurum reporting results from the first four drill holes from the Europa-Guadalupe vein zone at Alamos (Figure 16).
Disclaimer: This report is for informational use only and should not be used an alternative to the financial and legal advice of a qualified professional in business planning and investment. We do not represent that forecasts in this report will lead to a specific outcome or result, and are not liable in the event of any business action taken in whole or in part as a result of the contents of this report.