
March 18, 2024
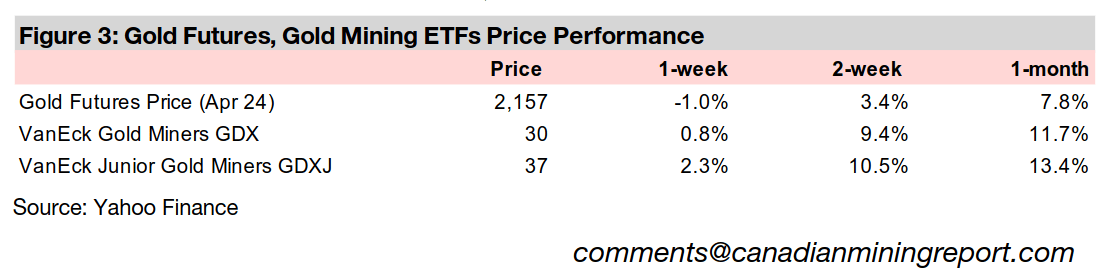
Gold dipped -1.0% to US$2,157/oz, consolidating after a major move which saw the metal gain 8.2% in three weeks, as quite strong US inflation data led markets to expect that major global central banks would maintain relatively hawkish stances.
The gain in gold stocks this week was interesting as it was not supported by either a rise in the metal or the equity markets, with the S&P near flat, up just 0.1%, the Nasdaq down -0.5% and small cap Russell 2000 index declining -1.8%.


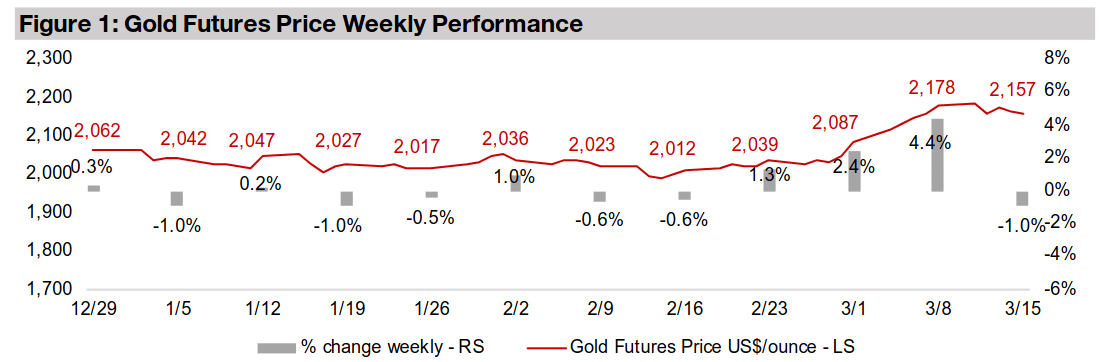
Gold declined -1.0% to US$2,157/oz, consolidating after an 8.2% gain over the prior
three weeks. This was driven by both higher than expected US CPI and wholesale
inflation, which boosted market fears that the Fed could hold rates higher for longer.
The probability of a rate cut at the Fed meeting this week is just 1.0%, for May 2024
10.8%, and only just above 50% for the June 2024 meeting. The higher than expected
inflation drove up both US bond yields and the US$ Index, which in turn pressured
the gold price, as these two tend to move inversely with the metal.
The news also hit US equity markets, with the S&P 500 near flat, up 0.1%, Nasdaq
down -0.5% and the Russell 2000 declining -1.8%. One very interesting move this
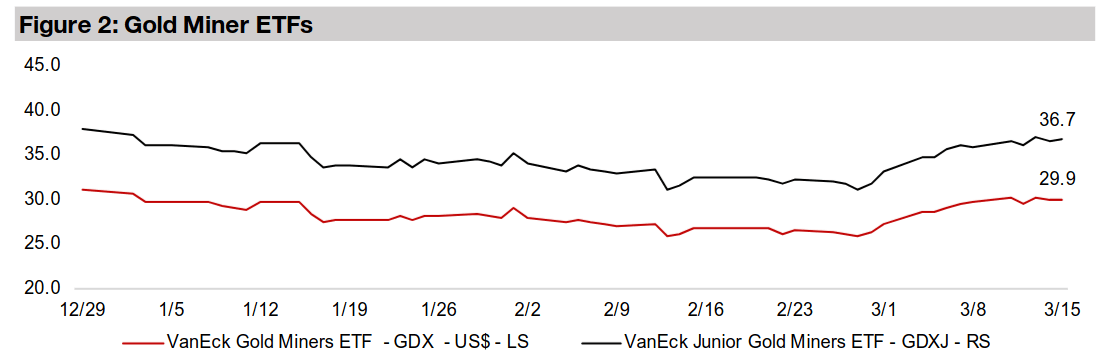
week was a rise in gold stocks, occurring without the support of either a gain in the
metal or equity markets. While the GDX ETF of gold producers rose 0.8%, the 2.2%
rise in the GDXJ ETF of gold juniors was especially surprising given the broader slump
in small caps. It suggests the market may finally be rotating away from a growth focus
centered on Big Tech, as that sector’s euphoria fades, and turning more towards
value, and finding it in the subdued valuations of junior gold miners and other sectors.
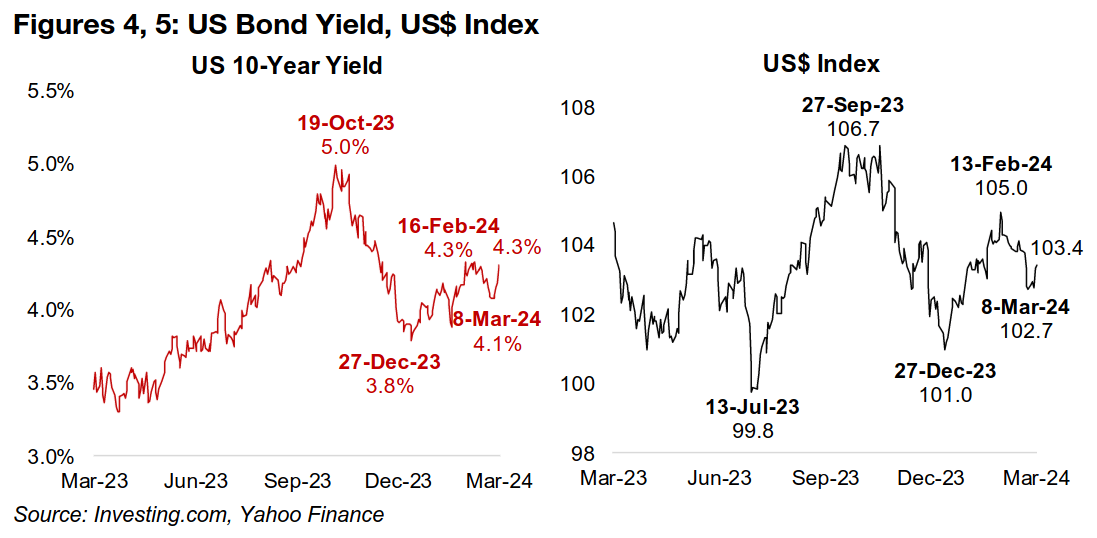
The US 10-year bond yield rose back to 4.3%, after it pulled back over three weeks
from 4.3% in mid-February 2024 to 4.1% in early March (Figure 4). While the US yield
dropped about 1.0% in the last quarter of 2023, it has trended up year to date, rising
almost half a percent from 3.9% in late December 2023. The US Index has seen
similar movement, rebounding to 103.4 from a low of 102.7 in early March 2024. While
off a peak of 105.0, the US$ has trended up overall so far this year, from a low of
101.0 in December 2023 (Figure 5). Overall the metrics do not seem to indicate a
faltering economy, bringing into the question the need for major rate cuts soon.
The outlook for both US yields and US$ Index will depend to some degree on the
policies of the other major global central banks, especially in Europe and Japan. A
more rapid shift to easier monetary policy by either could drive further fund flows into
the US, pushing up rates and the currency. However, currently, the European Central
Bank (ECB) and Bank of Japan (BoJ) maintain moderately hawkish tones, similar to
the Fed. This indicates a balance between the three, which could be maintained if
they make rate cuts roughly in tandem.
The ECB held rates flat this week, and have hinted at cuts by June 2024, similar to
the Fed. Interestingly, the historically dovish BoJ is currently the most hawkish of the
three. It is planning its first rate hike in seventeen years and will finally exit negative
rates in response to rising prices, driven especially by increased wages. However,
with Japan’s money supply relatively small, the potential disruption is less than would
be a big divergence between US and European rates. China has the largest global
money supply, and the central bank there is the only one of the big four to have cut
rates aggressively over the past year two years, driving a decline in its currency.
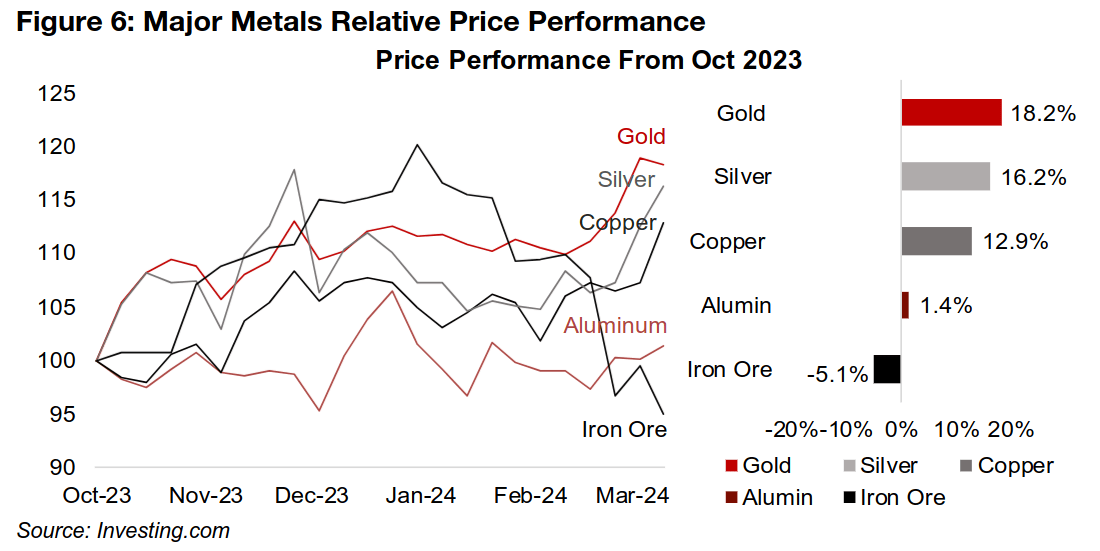
Gold’s recent big run has seen it outpace all the other major metals, with an 18.2% gain over the last six months, with silver, another risk hedge, not far behind, up 16.2% (Figure 6). However, it has not been just these monetary metals seeing strong gains, as industrially-driven copper has jumped 12.9%. While this ostensibly could indicate an improvement in global economic demand, for which the copper price is a key barometer, the other two major industrial metals, aluminum and iron ore, are sending less bullish signals, with the former up just 1.4% and the latter plunging -5.1%
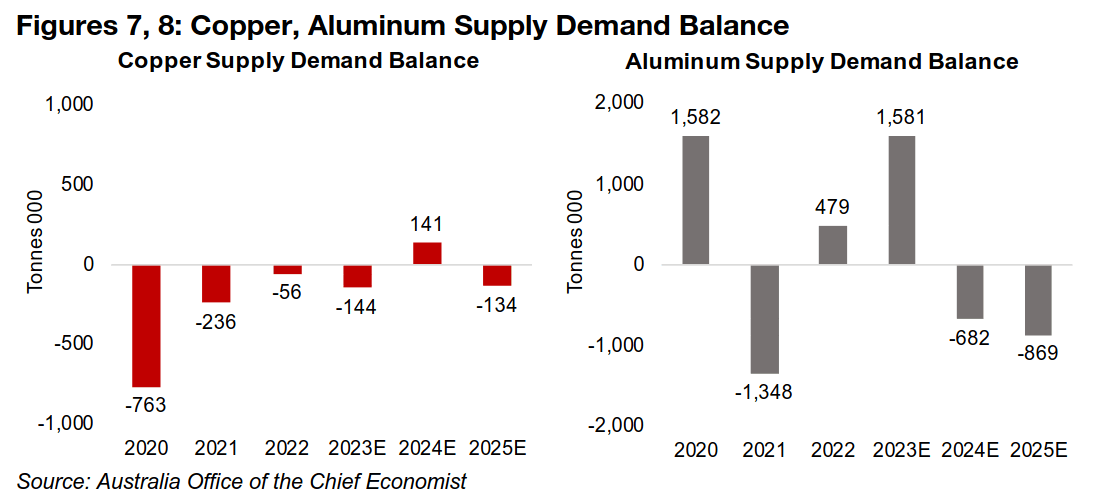
The rise in copper has been less because of a major rise in demand and more from
supply side problems, with expected slowing output of both raw mine production and
refined metal from China. The copper market had been expected to post a surplus of
141k tonnes in 2024, according to the most recent estimates by Australia’s Office of
the Chief Economist (AOCE) released in December 2023 (Figure 7). While this
expected deficit had kept the metal’s price quite flat for several months, these new
supply declines could see this surplus reduced or the market even move into deficit.
For aluminum, there was a major 1,581k tonnes surplus in 2023 which led to a muted
1.0% gain in the price last year (Figure 8). While the AOCE is forecasting a deficit for
both 2024 and 2025, these have likely already been largely priced in by the market,
with the continued flat price suggesting roughly balanced supply and demand factors.
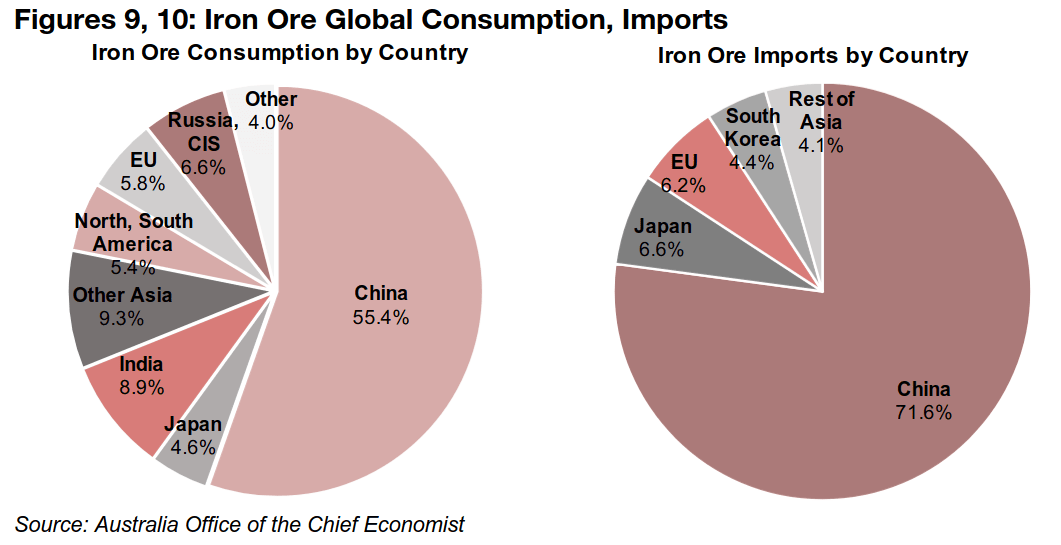
While the rise in copper price has been mainly because of supply issues, the slump
in the iron ore price this year comes more from the demand side, especially from
China, the leader for both world consumption and imports of iron ore (Figures 9, 10).
The massive economy has had huge demand for iron ore for steel production to
support its infrastructure and real estate building spree of the past thirty years.
Rebounding Chinese demand had been a strong driver of the iron ore price in the
second half of last year. Iron ore rose 33% from August to 2023 to a peak in
December 2023, as China’s economy got back into full swing and the supply chain
distortions from the global health crisis finally subsided. However, the rise in steel
and therefore iron ore demand has slowed in recent months as demand in China has
cooled, as demonstrated by slowing growth of iron ore imports and rising inventories
of the metal.
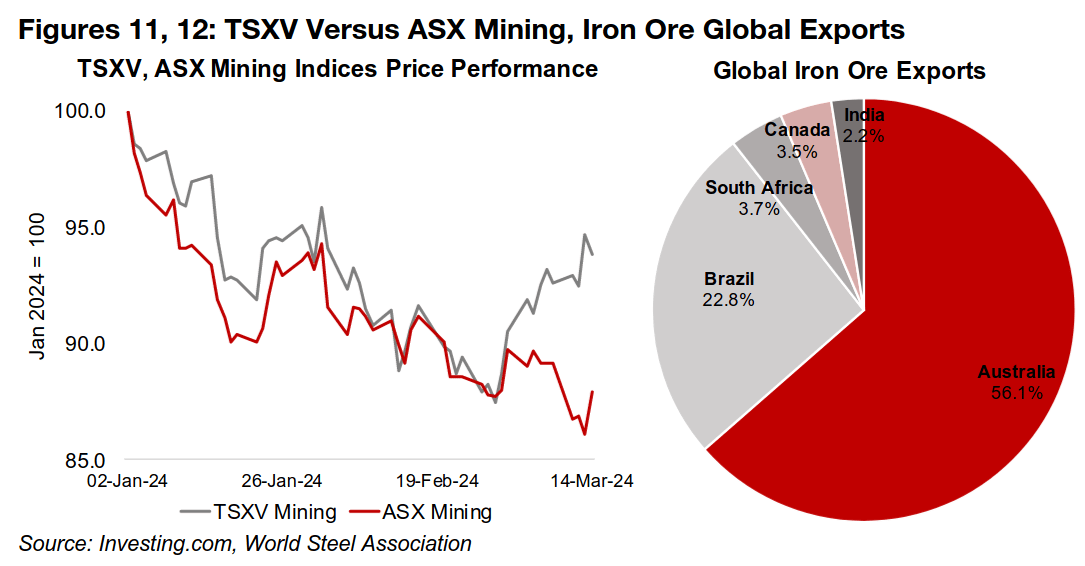
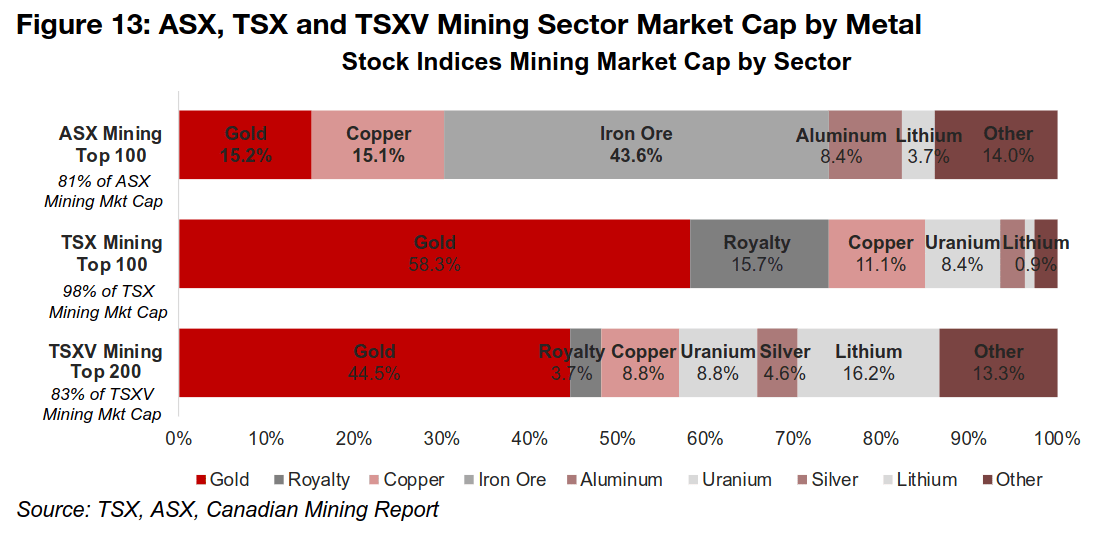
The decline in iron ore is much more of an issue for Australia than for Canada, as can be seen in the divergence between Australia’s ASX Mining and Canada’s TSXV Mining indices over the past month (Figure 11). The former has continued a trend of decline for the year, but the latter reversed it, after moving in tandem for the first two months of 2024. Australia is heavily leveraged to iron ore, being by far the largest exporter of the metal globally, at 56.1% of the total (Figure 12). The outsized effect of iron ore on the ASX can be seen in the proportion of the mining sector market caps by metal, with the ASX having nearly a 50% exposure to iron ore, and the TSX and TSXV much more ‘gold-heavy,’ with limited iron ore exposure (Figure 13).
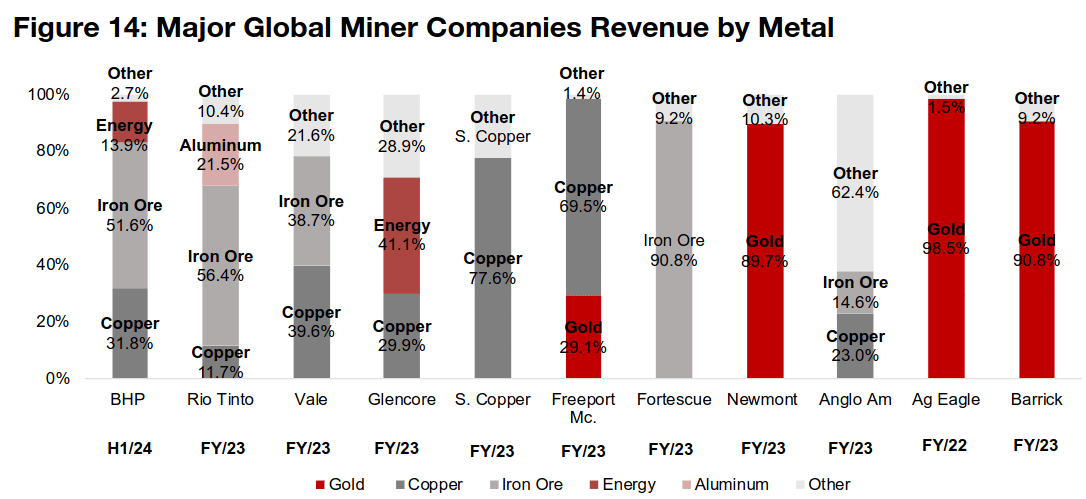
This heavy ASX Mining iron ore exposure comes mainly from two listings, BHP and Rio Tinto, by far the largest market cap mining stocks in Australia, with over 50% of their revenue from iron ore (Figure 14). The other large global mining stocks weighted heavily towards the metal are Brazil’s Vale, with iron ore at nearly 40% of total revenue, and another Australian company, Fortescue, with iron ore over 90% of revenue.
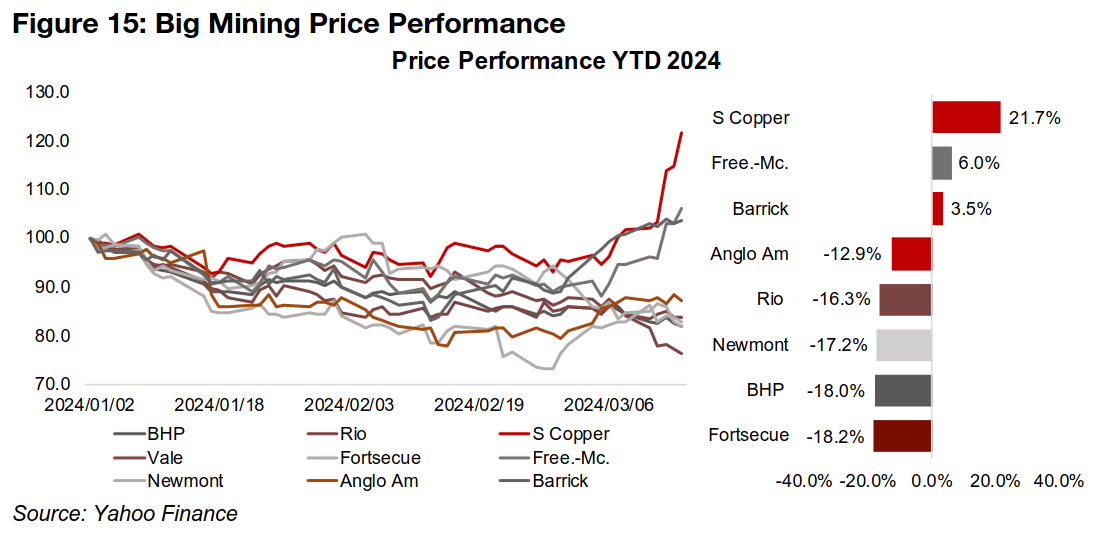
The large exposure to iron ore has been the main driver of the share price declines of
BHP and Rio Tinto this year, and their huge market caps versus the sector will have
in turn put pressure on the broader global mining index (Figure 15). However, the
large miners with no iron ore exposure and producing more copper and gold have
performed better, rebounding after struggling in the first two months of the year.
Southern Copper has seen the biggest gain YTD, with nearly 80% of its revenue from
copper, while Freeport McMoran, with a roughly 70% to 30% copper to gold revenue
split, has gained moderately. The gold producers Newmont and Barrick, with almost
all their revenue from gold, have also performed relatively well over the past month.
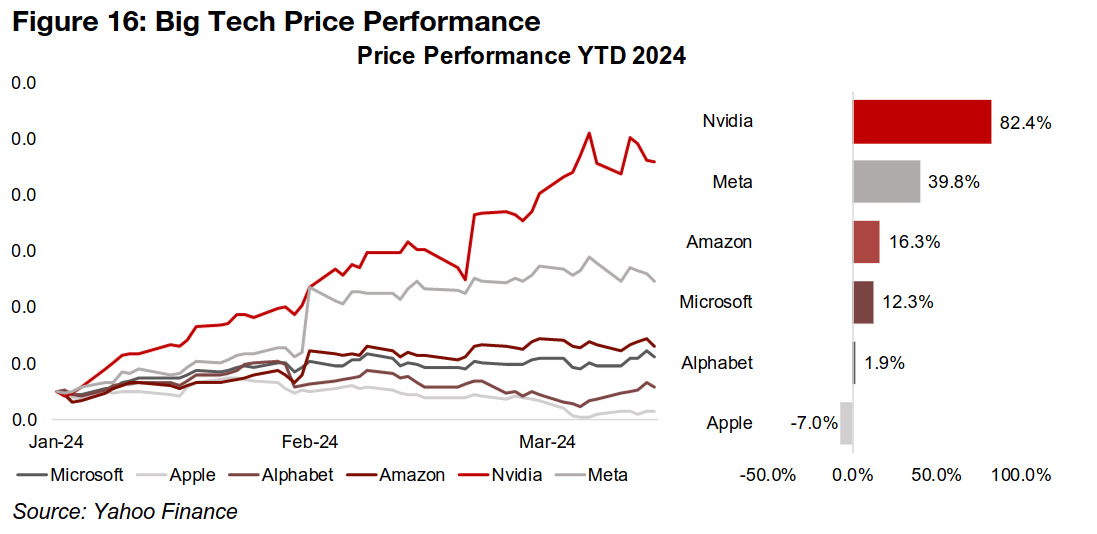
We have focussed much this year on the increasingly unsustainable looking divergence between the overloved Big Tech sector and underloved Big Mining. The past two weeks have shown signs this is starting to correct, with a pickup in mining stocks, while tech prices have started to slow, if not roll over (Figure 16). Most of the larger tech stocks, including Apple, Microsoft, Alphabet and Amazon have flattened for nearly two months, and even the ‘unstoppable’ Nvidia has pulled back from highs.
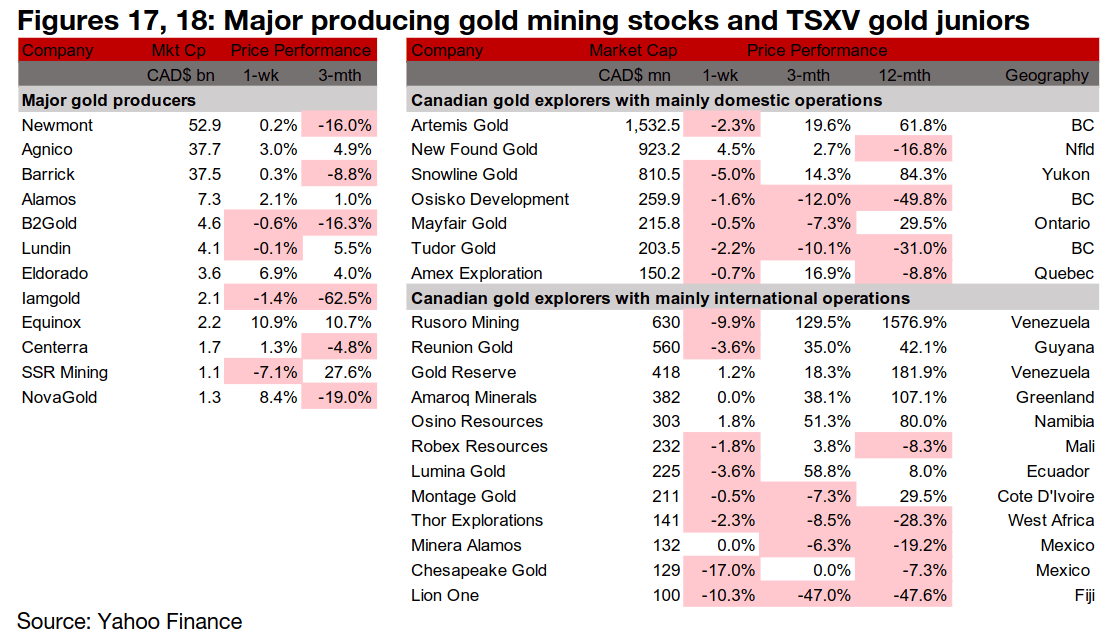
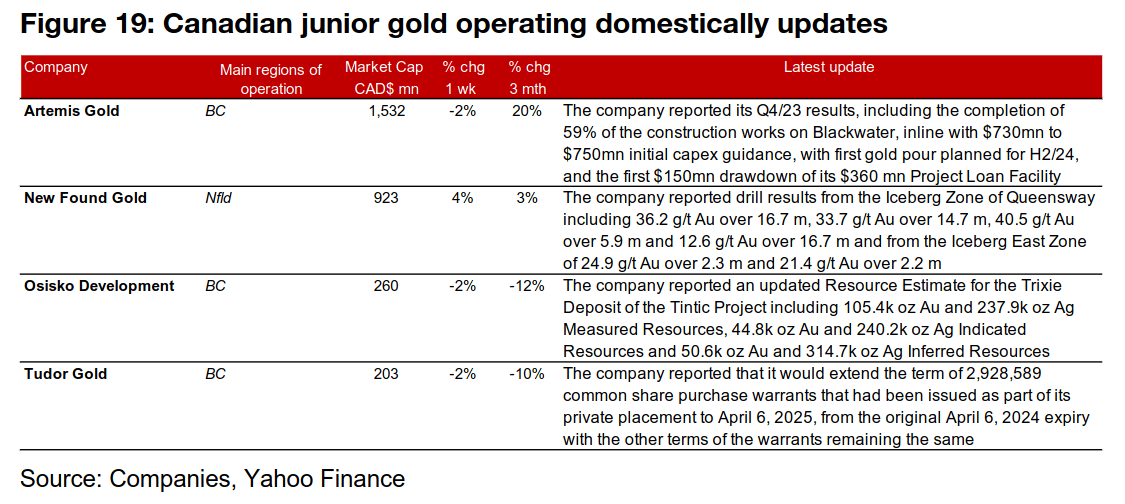
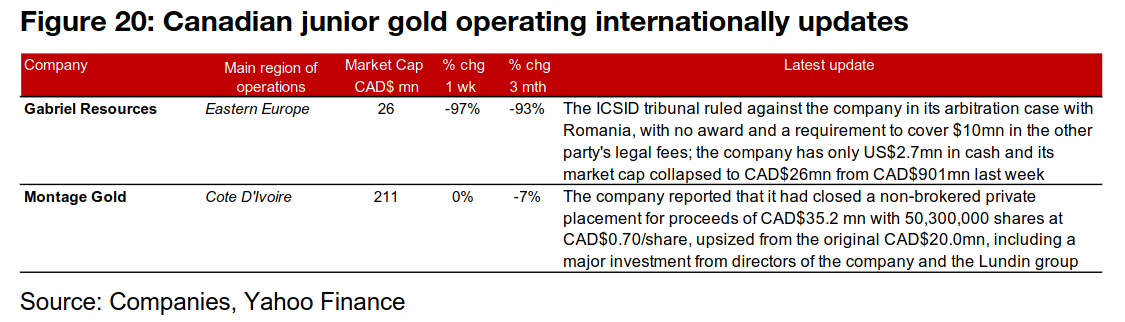
While the GDX and GDXJ gained, many large gold producers and most of the larger TSXV gold stocks declined (Figures 17, 18). For the TSXV gold companies operating domestically, Artemis Gold reported Q4/23 results, New Found Gold released drill results from the Iceberg and Iceberg East Zones of Queensway, Osisko Development reported an updated Resource estimate for the Trixie Mine and Tudor Gold extended the terms of its warrants (Figure 19). For the TSXV gold companies operating internationally, Gabriel Resources announced it received no arbitral award from ICSID, which saw its market cap collapse to CAD$26mn from CAD$901mn last week, and Montage closed its CAD$35.2mn private placement (Figure 20).
Disclaimer: This report is for informational use only and should not be used an alternative to the financial and legal advice of a qualified professional in business planning and investment. We do not represent that forecasts in this report will lead to a specific outcome or result, and are not liable in the event of any business action taken in whole or in part as a result of the contents of this report.
Author
Ben McGregor authors the Weekly Roundup at CanadianMiningReport.com, providing sharp analysis of the metals and mining sector. With a talent for spotting trends, Ben distills complex market shifts into clear, engaging insights on TSXV junior miners. His weekly updates cover gold, copper, uranium, and more, blending data-driven perspectives with a knack for identifying opportunities. A vital resource for investors, Ben’s work navigates the dynamic junior mining landscape with precision.