
March 11, 2024
Gold surged 4.8% to new all-time highs of US$2,186/oz, has gained US$174/oz in just three weeks and is finally showing strong signs of breaking out of a four-year trading range where it had persistently reverted to an average of around US$1,850/oz.
This week we look at the implications of the divergences of gold versus real yields and gold and silver stocks from their underlying metals, and the valuations of the largest global mining stocks, which have dropped just below twenty-year averages.
The gold stocks jumped on the continued strong gain in gold with the GDX and GDXJ up 8.5% and 8.1%, respectively, even as equity markets were flat with the S&P 500 down -0.1% and Russell 2000 off -0.2%, while TSXV larger gold nearly all rose.


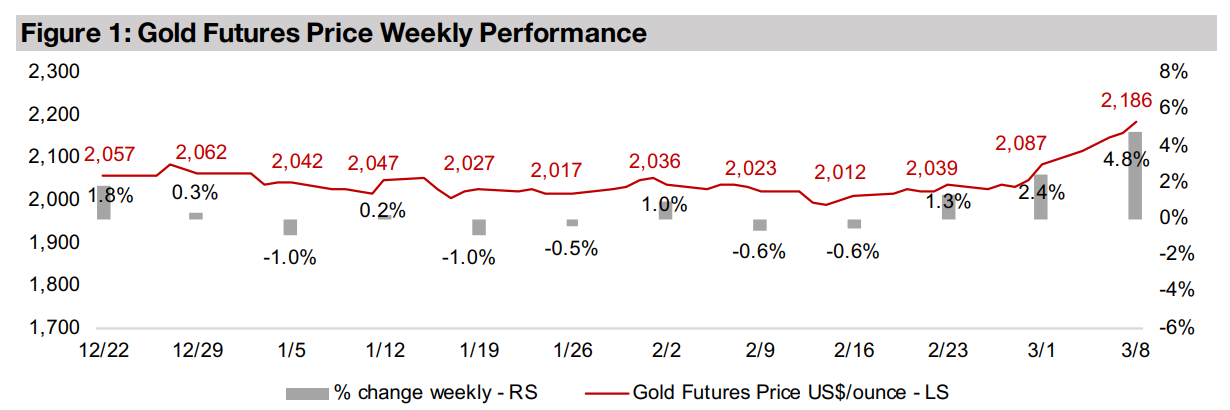
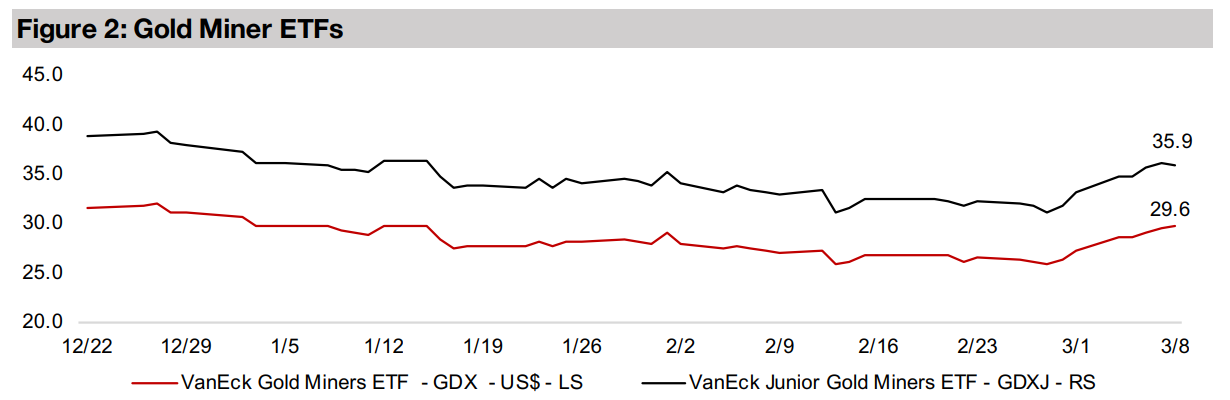
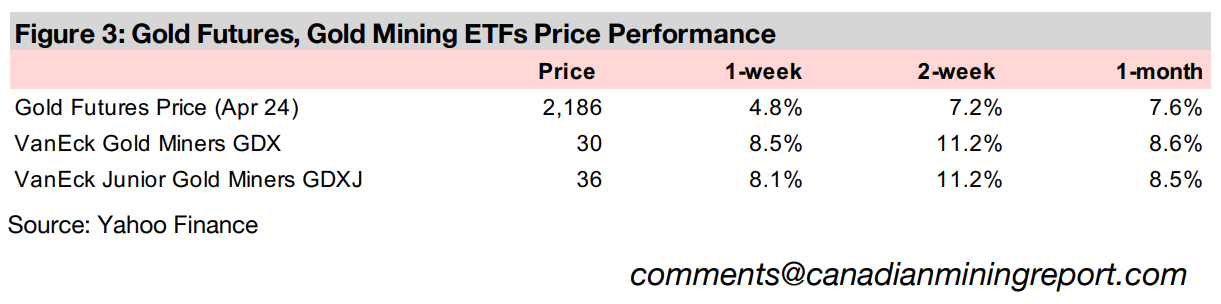
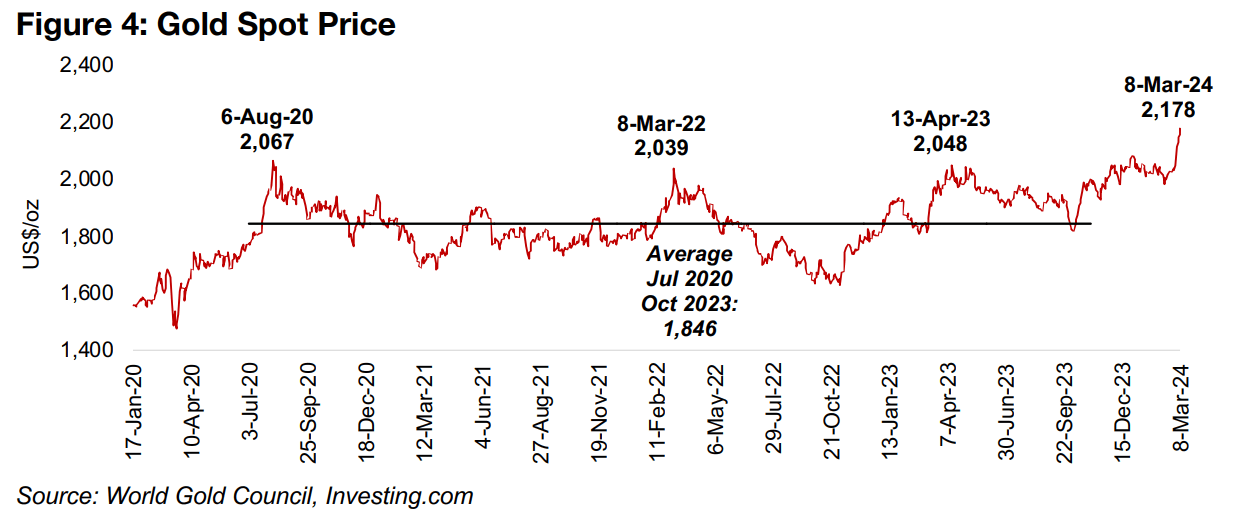
Gold continued to breakout, with the futures price rising 4.8% to US$2,186/oz, and has gained US$174/oz in just three weeks. This also sent gold stocks surging, with the GDX ETF of producers up 8.5% and the GDXJ ETF of juniors up 8.1%, well ahead of the -0.1% decline in the S&P 500 and -0.2% drop in the Russell 2000. The spot price reached US$1,178/oz on March 8, 2024, a new all-time high, and finally breached the US$2,100/oz level. Three previous run ups in gold over the past four years stalled at around the US$2,050/oz level, each time driven by specific crises, with a consistent reversion towards the persistent US$1,844/oz average that held from July 2020 to October 2023. The current surge has been different because there is no one major event driving the rise, but rather a confluence of factors, suggesting that the gold price may finally be shifting up to a new trading range.
One of these key factors influencing gold is real bond yields, with the two tending to
move inversely. This is because as real yields rise, the opportunity cost of holding
gold rises, with bonds becoming more attractive, and vice versa. The relationship is
not exact, and while it tends to hold quite well during periods of relative economic
calm, the two can diverge substantially during economic turmoil. Figure 5 shows the
gold price versus the US 10-year real yield on an inverted scale from 2012 to 2024.
For most of this period, as real yields decline, the gold price rises and as real yields
rise, the gold price falls. However, since 2022, there has been a major split between
the two, with real yields surging, but the gold price also continuing to rise. The longterm history of the gold versus inverse real yield relationship shows that a breakdown
of this relationship also occurred during 2008-2009 global financial crisis, in the run
up to it, and several years following (Figure 6).
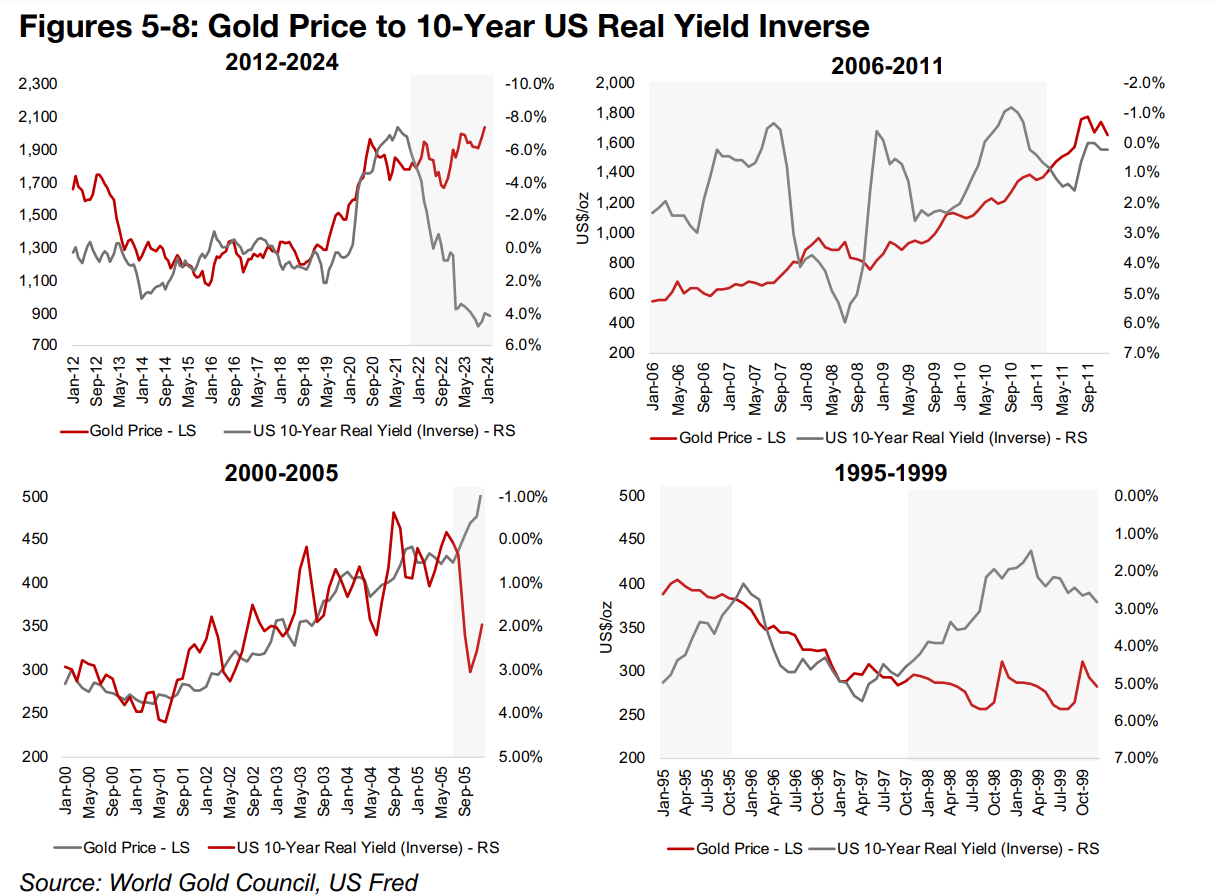
From 2000 to 2005 was another period where gold and the inverse real yield moved
in tandem, as would be theoretically expected, during the recovery from the dot.com
bust (Figure 7). The two were also correlated from 1996 to 1997 before the dot.com
bubble started to develop, which was another period of economic distortion (Figure
8). The divergence between gold and real yields could therefore be suggesting that
we are on the verge of another period of economic turbulence and a sustained split.
However, there are two scenarios which could bring them back in line with each other.
The first would be that the market is simply not expecting that real yields will be
maintained at current levels, and a major decline would see the inverse real yield in
Figure 5 rise back towards the gold price.
The other scenario would be that real yields remain high and the gold price corrects
downward to bring the two back inline. We believe that the second scenario is unlikely,
given that most major central banks have already indicated that rates have likely
already peaked, and could start to decline this year. Adding to this is the very high
current levels of both economic political risk, which is prompting the broader market
to continue to add gold as a hedge, something that central banks have already been
doing aggressively for several years. Overall we see the probability weighted more
towards a rise in gold than any decline.
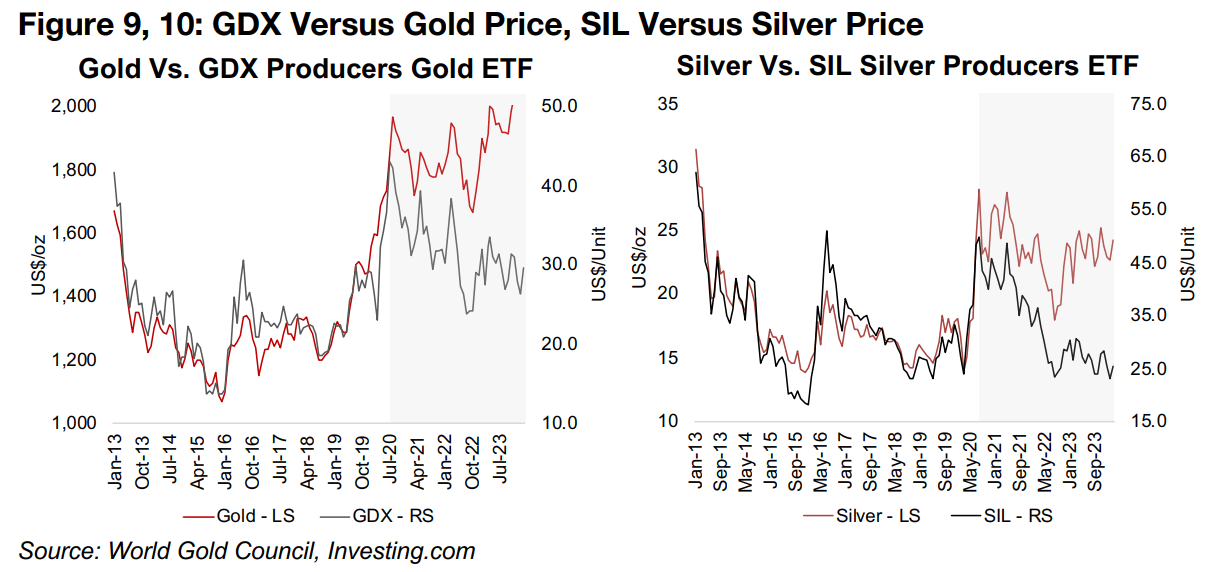
In addition to the divergence between gold and real yields, there has also been a
major split between the performances of the ETFs of the gold (GDX) and silver
producers (SIL) and their underlying metals since mid-2020. Both the gold and silver
price have held up reasonably well while the stock ETFs have struggled (Figures 9,
10). One of the main causes has been a market hyper-focussed on big tech, leading
to skyrocketing valuations, which appears to have been at the expense of almost
every other sector globally. As in previous booms, this imbalance will likely eventually
be corrected, with tech valuations getting so excessive that the market finally starts
rotating towards sectors with still reasonable growth, but more moderate valuations.
For the gold and silver stocks specifically, their underperformance implies that the
market has not been expecting these metals prices to be maintained at current levels,
let alone see significant gains. However, the jump this week in both the GDX and SIL
suggested that the market may be finally shifting its stance on this, and starting to
accept the potential that these metals prices may not revert back to the sticky
averages of the past four years this time around.
Another argument for the underperformance of these stocks would be that the
inflation will drive cost increases, and squeeze margins, offsetting the effect of higher
metals prices. While costs are rising, gold and silver prices are still high enough for
the strong profitability for most producers. Also, at current valuations, the market
does not seem to be pricing in margin-boosting further gains in the gold and silver
price this year, which we expect are highly possible. While the risk remains that a
broad market crash could drag most stocks down, this could further drive up these
metals in a flight to safety, and mining stocks could still see relative outperformance,
especially given potential support from their quite low current valuations.
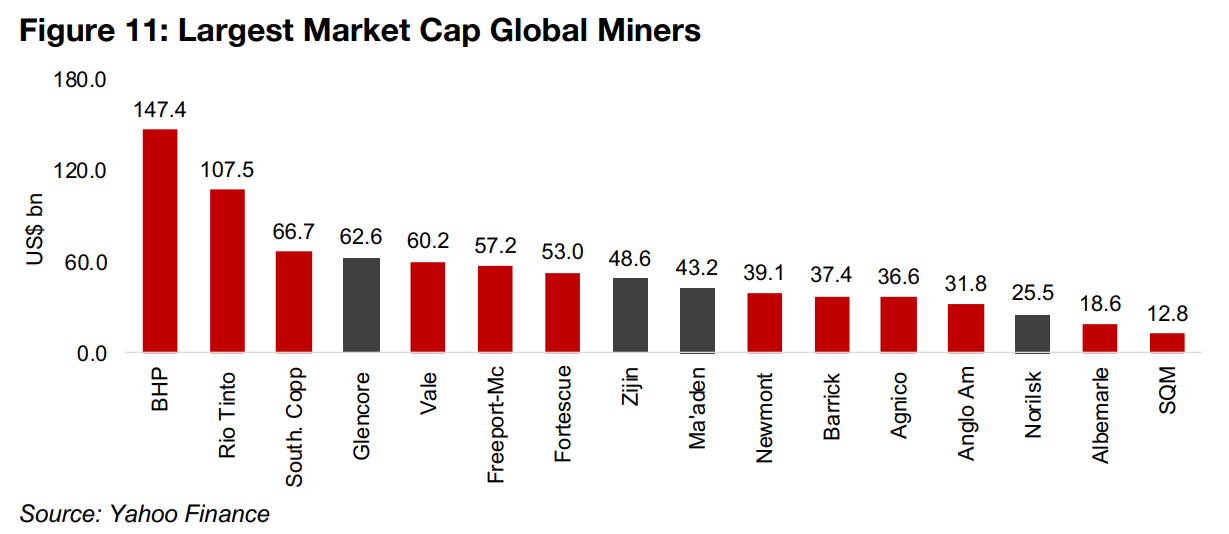
Overall analysts are forecasting a pickup in global mining earnings over the next two years, based on an aggregate of the largest market cap companies, including BHP, Rio Tinto, Southern Copper, Vale, Freeport-McMoran, Newmont, Barrick, Anglo American, Albemarle and SQM (Figure 11). Glencore has been excluded from the aggregate as it has very high revenue, but extremely low margins, and pulls down average margins well below what is typical of the industry. Zijin, Ma’aden and Norilsk are also excluded because of issues with data availability.
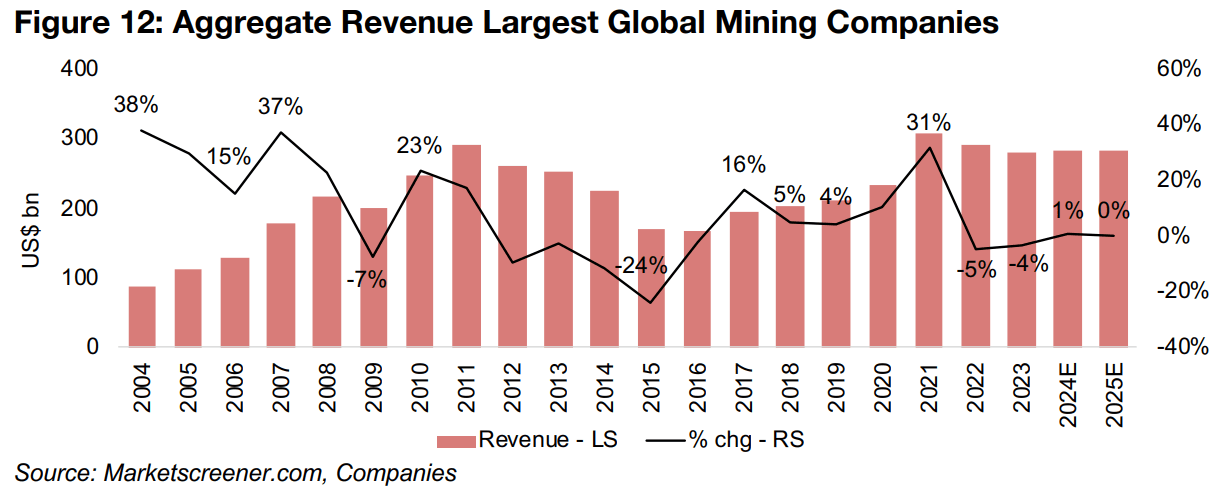
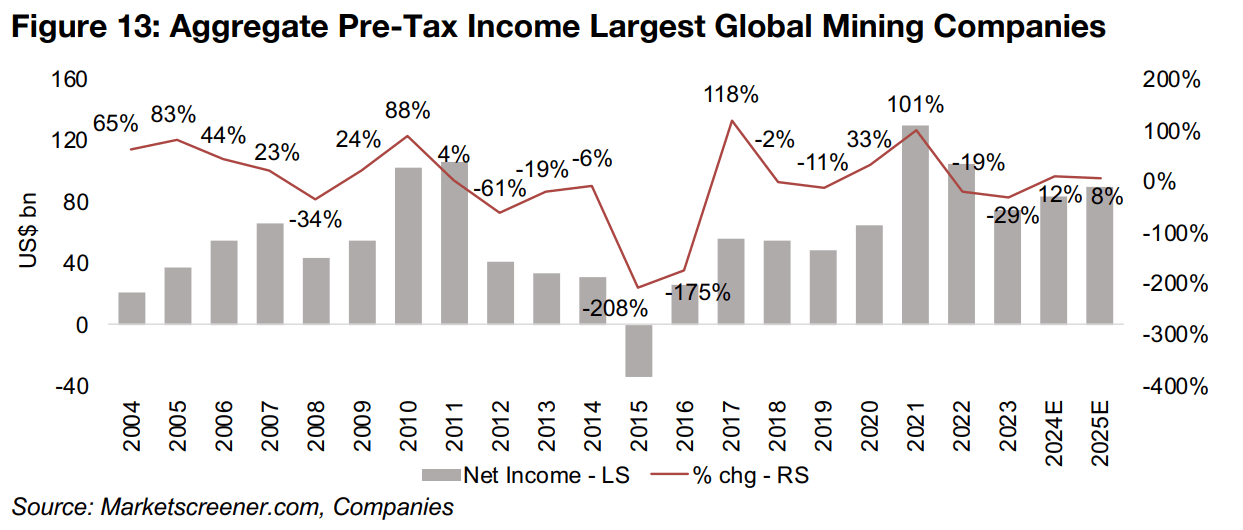
Revenue growth expectations for the industry are muted for 2024E and 2025E, at 1.0% and 0.0%, respectively, although this is an improvement on -5% and -4% declines in 2022 and 2023 (Figure 12). However, consensus targets a rise in pre-tax net income of 12% and 8% in 2024E and 2025E, a major rebound from -19% and -29% declines in 2022 and 2023 (Figure 13). While these earnings remain well off their 2021 peak, they are still more than double the average in the bear market from 2012 to 2020.
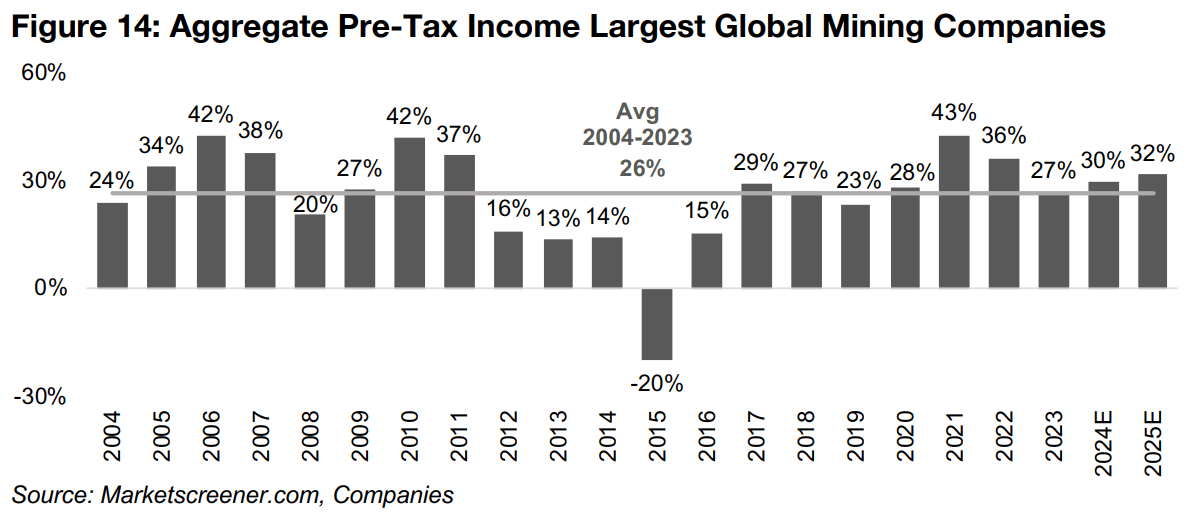
This gain in earnings even with relatively flat revenue is driven by a rise in aggregate pre-tax margins for the sector, from 27% in 2023 to 30% in 2024E and 32% in 2025E (Figure 14). This indicates that analysts expect the industry to continue to control cost inflation, the risks of which have come substantially over the past year as the aggressive interest rate hikes of the past two years have started to curb price rises.
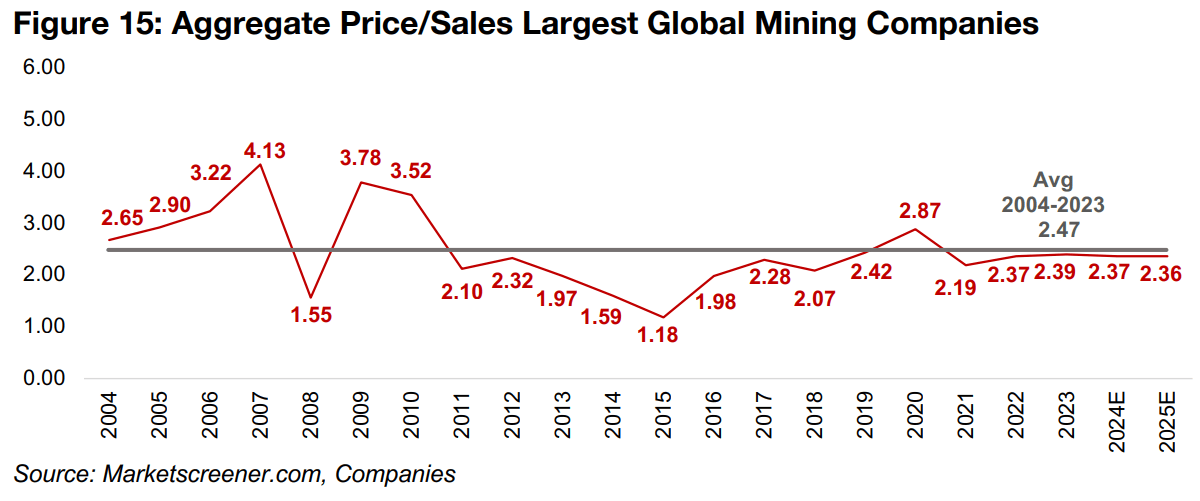
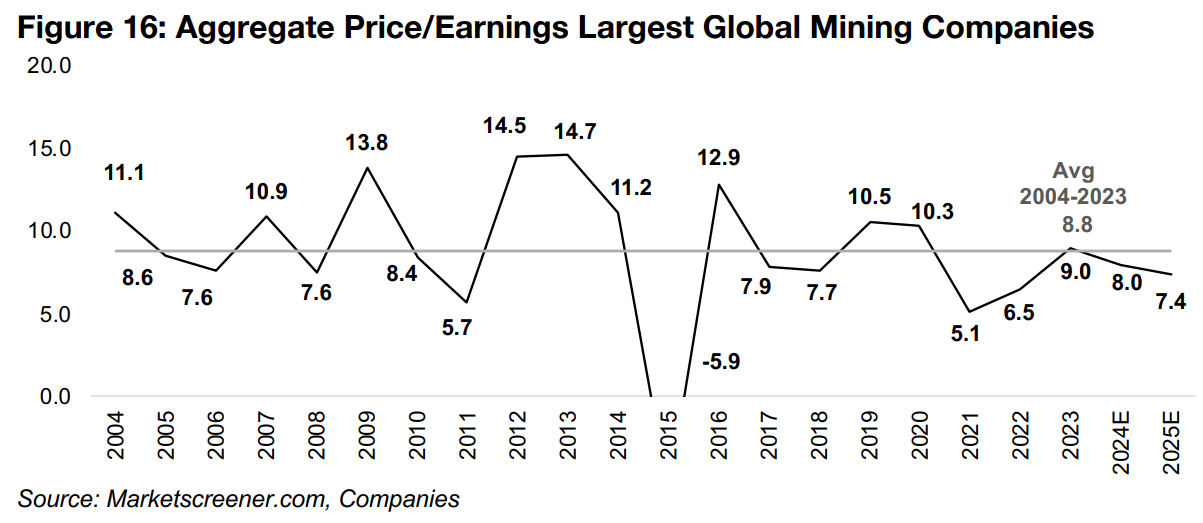
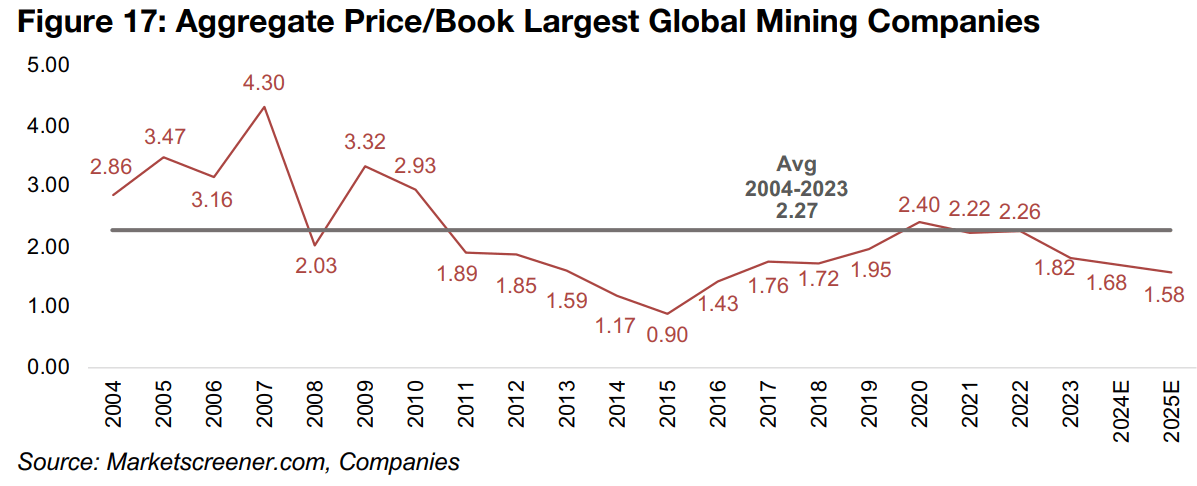
Aggregate valuations for the large cap miners have dipped just below the averages since 2004, with the sector not the extreme bargain it was in the depths of the metals bear market in 2015, but also not particularly expensive. The price to sales multiple is 2.37x for 2024E, near flat from 2.37x in 2023, and slightly below the 2.47x average from 2004-2003 (Figure 15). While the price to earnings multiple of 9.0x in 2023 nearly converged with the twenty-year average of 8.8x, it has declined to 8.0x for 2024E (Figure 16). The price to book multiple has dropped below the two-decade average of 2.27x for two years, trading at 1.82x in 2023 and 1.68x for 2024E (Figure 17).
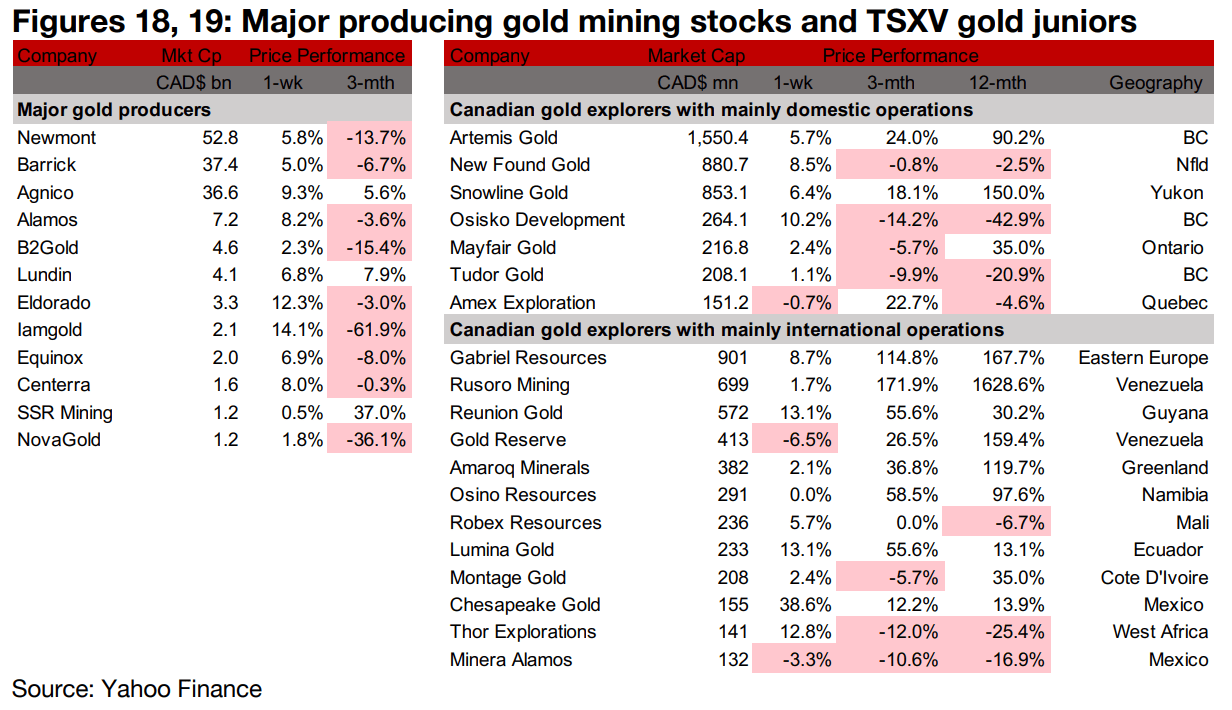
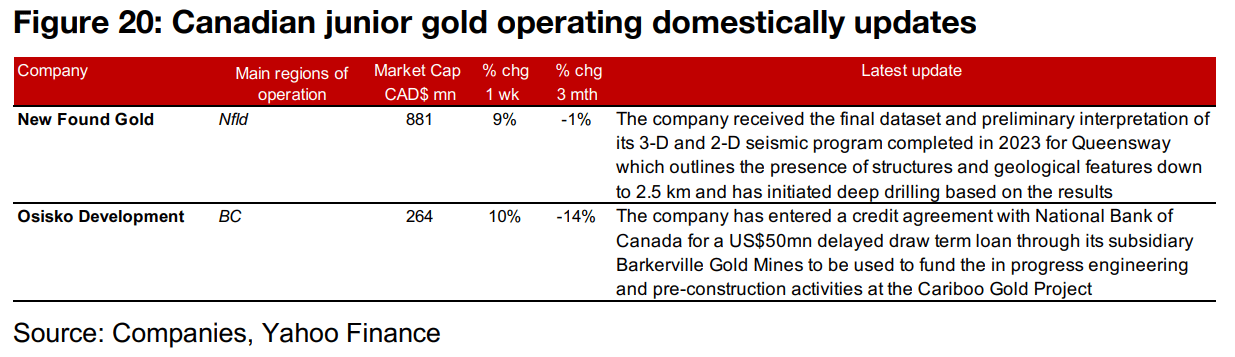
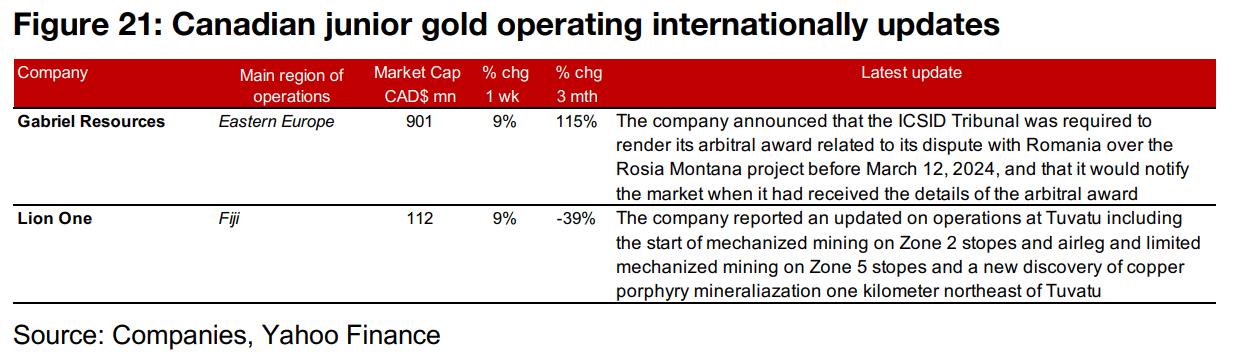
The jump in the gold price drove up all of the major producers and most of the TSXV larger gold stocks (Figures 18, 19). For the TSXV gold companies operating domestically, New Found Gold received the results of its 3-D and 2-D seismic survey for Queensway and initiated deep drilling based on the results and Osisko Development entered a US$50mn credit agreement (Figure 20). For the TSXV gold companies operating internationally, Gabriel Resources announced it would soon receive its arbitral award from the ICSID tribunal, and Lion One reported an update on operations at Tuvatu and a new copper porphyry discovery (Figure 21).
Disclaimer: This report is for informational use only and should not be used an alternative to the financial and legal advice of a qualified professional in business planning and investment. We do not represent that forecasts in this report will lead to a specific outcome or result, and are not liable in the event of any business action taken in whole or in part as a result of the contents of this report.
Author
Ben McGregor authors the Weekly Roundup at CanadianMiningReport.com, providing sharp analysis of the metals and mining sector. With a talent for spotting trends, Ben distills complex market shifts into clear, engaging insights on TSXV junior miners. His weekly updates cover gold, copper, uranium, and more, blending data-driven perspectives with a knack for identifying opportunities. A vital resource for investors, Ben’s work navigates the dynamic junior mining landscape with precision.