
May 06, 2024
Gold declined -1.5% to US$2,299/oz, pulling back for a second week as the market continued to lock in gains from the metal’s big rise this year, while weak US employment data increased hopes for rate cuts, driving up riskier equities.
This week we look at mining stock valuations versus major global markets and sectors, with mining P/B ratios overall quite flat this year but gold stock multiples jumping, and recent equity raising for Canadian mining, which remains robust.
Gold stocks dropped with the GDX down -3.2% and GDXJ declining -3.8% as a second week of decline for the metal finally saw the stocks capitulate after holding up last week, offsetting the move into riskier equities including small caps.


The gold futures price declined -1.5% to US$2,299/oz as investors locked in gains
from the metal’s big year to date rise for the second week. The key economic release
was US employment data which were weak and drove market hopes that the Fed
would have more justification for rate cuts. US nonfarm payrolls rose 175k, coming
in significantly under consensus estimates for 240k. US unemployment rose to 3.9%,
above estimates for 3.8%, although this remains very low historically and is still only
moderately above the 3.4% April 2023 bottom, the lowest level since the 1970s.
The market has still not priced in a high likelihood of rate cuts anytime soon though,
with the probability for a reduction at the June 2024 Fed meeting at just 8.4% and for
the July 2024 meeting at 34.9%. The odds of rate cuts only rise over 50% for the
September 2024 meeting, at 67.4%, and they are anticipated with high certainty only
for the November and December 2024 meetings, with 79.8% and 91.5% probabilities,
respectively. This suggests that rates will remain near multi-decade highs for the rest
of this year, increasing the likelihood that something ‘breaks’ economically under the
pressure. Such chaos could prove to be an upside driver for the gold price.
This macro backdrop drove a mixed performance for markets, with US large caps not
seeing a significant move overall as the S&P 500 only edged up 0.3%. However, the
Nasdaq added 0.9% and the Russell 2000 small cap index gained 1.5%, suggesting
there was still a move into some of the riskier areas of the market, continuing a trend
that started last week. After the gold stocks held on last week, making gains even as
the metal price pulled back, they finally capitulated to some degree this week, with
the GDX and GDXJ declining -3.2% and -3.8% respectively.

Even given this recent short-term move back into risk, the trend overall for 2024 has
been a shift more towards safety. While the jump in gold and gold stocks is evidence
of this, it is also shown by the rise in US utilities. Utilities are widely considered one
of the most defensive sectors, and are up 9.4% this year, outpacing the 7.4% gain in
the S&P 500 (Figure 4). While the FANG stocks (Facebook/Meta, Apple, Netflix,
Google/Alphabet) still lead the market, up 16.7%, the gains were mainly in January.
A major turning point for the market would be utilities outpacing the FANG stocks,
indicating an end to risk-heavy tech euphoria and an upward rerating of safer assets.
There has already been a turning point for global mining this week, with the iShares
MSCI Global Metals and Mining Producers ETF (PICK) getting above even for the
year and now up 1.0%. While the S&P/TSXV Mining Index is still down -4.2% the
overall trend is clearly upward, with support from the gain in most major metals this
year. However, there is also some downward pressure from an overall weakness in
small caps, with the Russell 2000 flat for the year, further indicating that the market
has become more risk averse overall.
Any shift away from risk and towards safety still seem to be in its infancy, however,
as shown by only a moderate rebalancing so far between major sector valuations.
With the exception of US tech, which has seen a quite substantial decline in its price
to book (P/B) multiple to 9.4x in April 2024 from 9.9x in March 2024, global market
valuations have barely moved from December 2024 to April 2024 (Figure 5).
From December 2023 to April 2024 the P/B multiples of the S&P 500, the Eurostoxx,
the Russell 2000, Global Mining and China were either flat, or moved only 0.1 points,
with the highest gain a 0.2 point increase for Japan. In this context the 0.5 point drop
in the US tech P/B seems extreme, as does its absolute multiples at well over four
times the rest of the world, which seem high even after taking into account the
sector’s superior earnings growth.

US tech valuations are also far ahead of the other US equity sectors, with the next three highest sectors at about half its price to book multiples (Figure 6). Basic Materials, which includes the mining sector, has been flat for the past two months at a P/B of 2.7x and edged down from 2.8x in December. While there have been declines in the P/Bs of three other sectors from December 2023 to April 2024 including Consumer Discretionary, Real Estate, Financials and Telecoms this has been moderate, and the multiples for Healthcare, Industrials and Energy are flat.

The recent moves in gold stocks valuations stand out considerably in the context of the stagnation of most other markets and sectors. The P/B of the GDX ETF of gold producers fell from 1.64x at end-2023 to 1.40x in February 2024, but has surged in just a month to 1.78x (Figure 7). The GDXJ ETF of gold juniors similarly slid from 1.38x in December 2023 to a low 1.14x in February, before jumping to 1.76x in April 2024, nearly even with the gold producers. The silver and copper ETF P/B multiples have had a much more muted rise in April 2024 off February 2024 lows and are still only moderately above December 2024 levels. The P/B for the lithium ETF slumped in January 2024, remained flat in February 2024, and has only edged up as of April 2024.

The shift of the market into gold stocks in recent months is also evident in statistics
for the TSXV. The TSXV Mining Top 200 is a reasonable proxy for the TSXV Mining
sector overall, as it accounts for over 80% of the market cap and has remained in a
relatively tight range from 83% to 86% since December 2023 (Figure 8). While in 2021
and even well into 2022 the lithium sector had actually challenged gold’s dominance
of the Top 200, the latter has clearly moved back into the lead this year. Gold was
just 37% of the Top 200 market cap as of end-December 2023, but rose to 45% by
February 2024 and has stayed near that level since (Figure 9).
This mainly came at the expense of the lithium sector, which was 27% of the Top 200
in December 2023 but had dropped to 16% by February 2024. While this was partly
because one major lithium stock, Patriot Battery Metals, graduated to a TSX listing,
most of the decline was from a plunge in the market cap of Sigma Lithium, by far the
biggest TSXV lithium stock and largest TSXV mining stock. The other sectors have
remained a reasonably steady proportion of the Top 200, with moderate increases in
the silver, uranium, royalty and other segments of the Top 200.

In absolute terms from December 2023 to early May 2024 the market cap of the gold sector in the Top 200 had risen from CAD$12.0bn to CAD$13.4bn, while lithium was reduced by half to CAD$8.6bn from CAD$4.3bn (Figure 10). Copper edged down from CAD$3.2bn to CAD$2.9bn, mainly driven by the shift of the larger cap NGEx to a TSX listing, while silver rose from CAD$2.0bn to CAD$2.2bn. The uranium sector has grown steadily this year from CAD$2.1bn to CAD$2.7bn while the Royalty sector has edged up from CAD$1.1bn to CAD$1.2bn.

There are also several other smaller sectors of the TSXV 200, with the biggest move in tin, rising from CAD$1.3bn in December 2023 to CAD$1.6bn in May 2024 on a gain in the metal price (Figure 11). The combined market caps of the other smaller sectors, nickel, the platinum group metals, zinc and the rare earth metals have all been relatively flat. An aggregate of the remaining stocks in the TSXV 200 picked up from December 2023 to March 2024, but has now returned to levels near the end of 2023.

While the sluggish global mining stock performance last year had increased concerns investment might weaken, this was not the case for the combined TSX and TSXV mining equity capital raising, which rose CAD$1.4bn to CAD$7.6bn in 2023 from CAD$6.2bn in 2022. (Figure 12) The gain was mainly driven by TSX investment, rising to CAD$2.1bn from to CAD$4.4bn while TSXV investment weakened for a second year, to CAD$3.3 from CAD$4.1bn in 2022, and off a CAD$6.0bn peak in 2021.


The TSX has again led mining equity investment so far in 2024, but mainly from a
single huge deal in February 2024, with the TSXV by far the majority of the smaller
absolute levels of investment in both January 2024 and March 2024 (Figure 13). TSXV
mining equity investment has been reasonably strong versus 2023 this year, at
CAD$289mn, CAD$245mn and CAD$296mn in January, February and March 2024,
respectively (Figure 14). This averages to CAD$273mn monthly, inline with the
US$276mn average of 2023, but below the US$345mn average of 2022.
The mining sector has also continued to comprise the majority of TSXV total equity
capital raised for the past two years, ranging from a low of 51% to as a high as 90%.
While the total number of financings declined from a twelve-month peak in January
2024 at 124 to 68 as of March 2024, the average value per financing rose from
CAD$2.3mn to CAD$4.4mn over the same periods (Figure 15). However, on average,
this year is similar to last year, with the average number of monthly deals at 87 in
2023 and 89 in Q1/24 and average value per deal at CAD$3.22mn and CAD$3.32 mn
over the same periods.


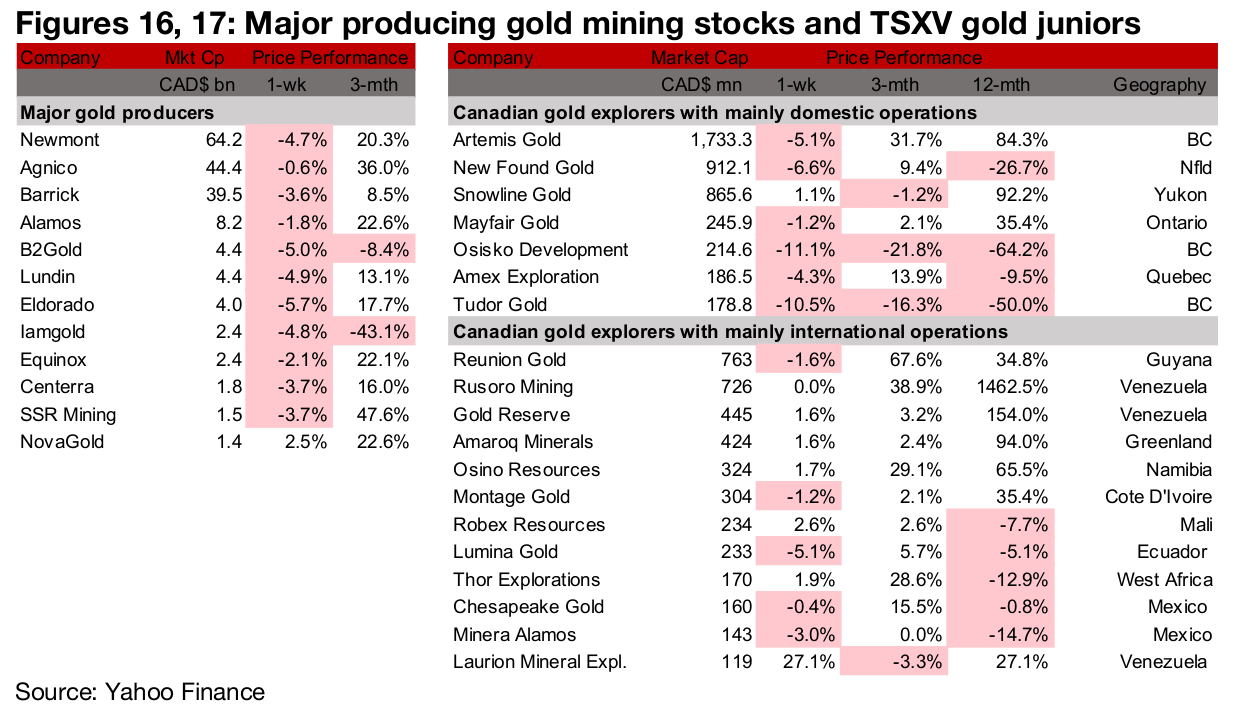
The major gold producers were almost all down and large TSXV gold was mixed as the metal price continued to pull back (Figures 16, 17). For the TSXV gold companies operating domestically, Snowline Gold discovered three new targets at the Rogue Project and one at the Cynthia Project, Tudor Gold appointed Mr. Patrick Donnelly as VP of capital markets and Laurion Mineral Exploration reported results from its 2024 drill program at Ishkoday (Figure 18). For the TSXV gold companies operating internationally, Gold Reserve appointed Mr. Paul Rivett as a director and Executive Vice-Chairman of the Board of Directors, and Minera Alamos provided an update on its Cobre 4H subsidiary including information on its copper assets (Figure 19).


Disclaimer: This report is for informational use only and should not be used an alternative to the financial and legal advice of a qualified professional in business planning and investment. We do not represent that forecasts in this report will lead to a specific outcome or result, and are not liable in the event of any business action taken in whole or in part as a result of the contents of this report.
Author
Ben McGregor authors the Weekly Roundup at CanadianMiningReport.com, providing sharp analysis of the metals and mining sector. With a talent for spotting trends, Ben distills complex market shifts into clear, engaging insights on TSXV junior miners. His weekly updates cover gold, copper, uranium, and more, blending data-driven perspectives with a knack for identifying opportunities. A vital resource for investors, Ben’s work navigates the dynamic junior mining landscape with precision.