
April 29, 2024
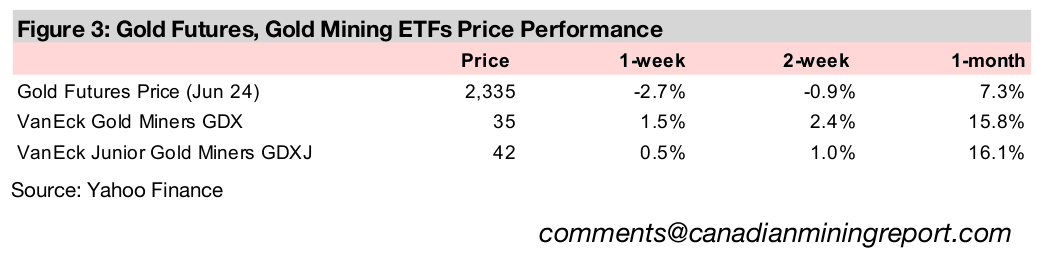
Gold pulled back -2.7% to US$2,335/oz this week as the market consolidated some gains after the metal’s huge run and there was a risk-on shift as US GDP came in below estimates, increasing rate cut hopes and offsetting a hot US PCE inflation print.
With copper outperforming all of the major metals so far this year this week we look at the forecasts for the industry which vary considerably across source and combined leave quite an opaque view for the price on both a short and long-term outlook.
Gold stocks rose with the GDX up 1.5% and GDXJ gaining 0.5% even as the metal price pulled back and markets shifted to risk-on, implying investors are still hedging their bets, with sector multiples still relatively low even after the surge in the gold.


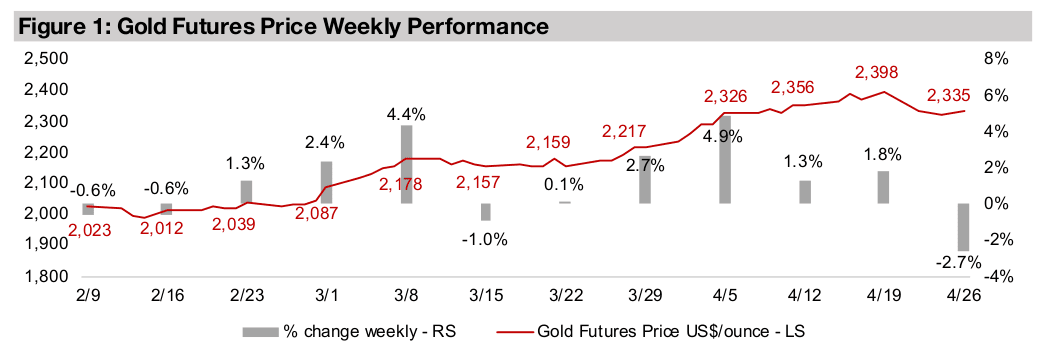

The gold price pulled back -2.7% to US$2,335/oz, with the market consolidating
some gains from the metal’s huge run over the past three months. The economic data
this week painted a mixed picture on inflation, with US GDP data coming in well below
expectations but a key price index surprising to the upside. US Q1/24 GDP
annualized grew at just 1.6%, almost a percent below market estimates, and its
lowest since Q2/22, and was viewed as deflationary. However, the US Personal
Consumption Expenditure (PCE) Price Index rebounded to 2.7% in March 2024 from
2.5% in January 2024, indicating continued inflationary pressure (Figure 4).
Overall the markets were buoyed by the data, with the S&P up 2.3% for the week,
the Nasdaq rising 3.5% and the Russell 2000 gaining 2.5%, possibly from increased
hopes that a weakening GDP could encourage the Fed to cut rates soon. However,
even with the risk-on shift and decline in the metal price, gold stocks rose, with the
GDX up 1.5% and GDXJ gaining 0.5%. While the sector was supported by some
strong Q1/24 results, especially from Newmont, the gain implies that the
attractiveness of relatively low multiples is offsetting even a decline in the gold price.
Last week we had noted that the World Bank’s (WB) gold forecasts of US$1,900/oz and US$1,700/oz for 2024 and 2025, respectively, were looking particularly low. This week they released their new commodities outlook with significant upgrades to their gold forecasts to US$2,100/oz in 2024, which is near the current average year to date, and a less severe decline to US$2,050/oz for 2025 (Figure 5).
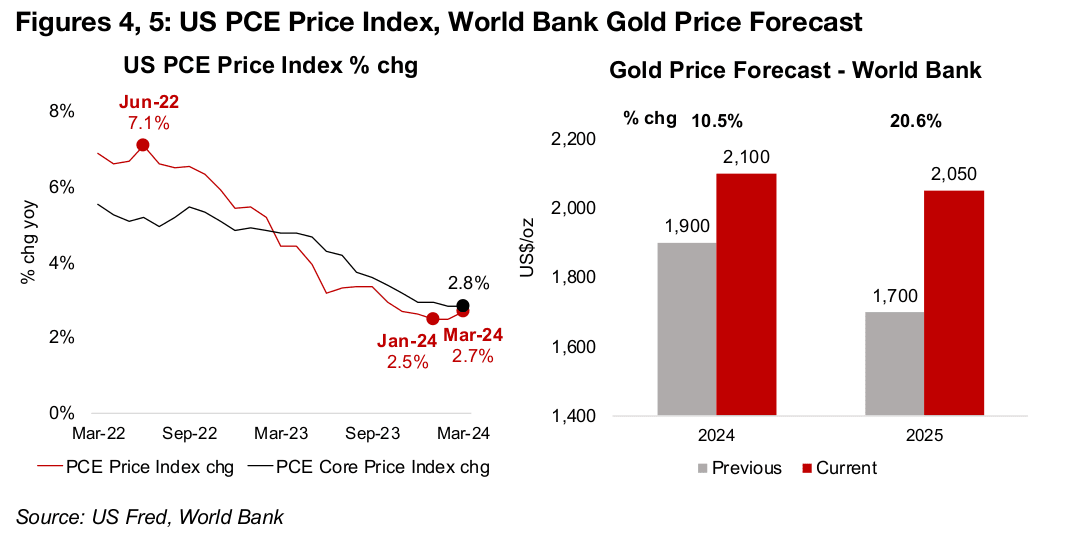
These targets seem more in tune with the current gold outlook than the previous
forecasts which were looking increasing implausible given the massive move into the
metal over the past two months. However, they still lag the estimates of several major
investment banks which range from US$2,500-US$2,700/oz for end-2024 or early
2025. Some major institutions have been playing catch up in their gold price
estimates for the past few years, and we expect that this trend could continue in 2024,
with sufficient economic and geopolitical risk to drive up the price further.
Gold does not look heavily overvalued yet on a range of relative metrics including the
other major metals, the money supply, and oil and other commodities, which imply it
has not entered obvious bubble territory yet. Gold stock multiples also still do not
look lofty as they had been particularly low versus other sectors prior to the recent
run. While we wouldn’t rule out a further pause in gold short-term given its recent
parabolic move, the fundamentals and strong upside to investment bank price targets
imply that the outlook for the metal is likely to continue to remain bullish in 2024.
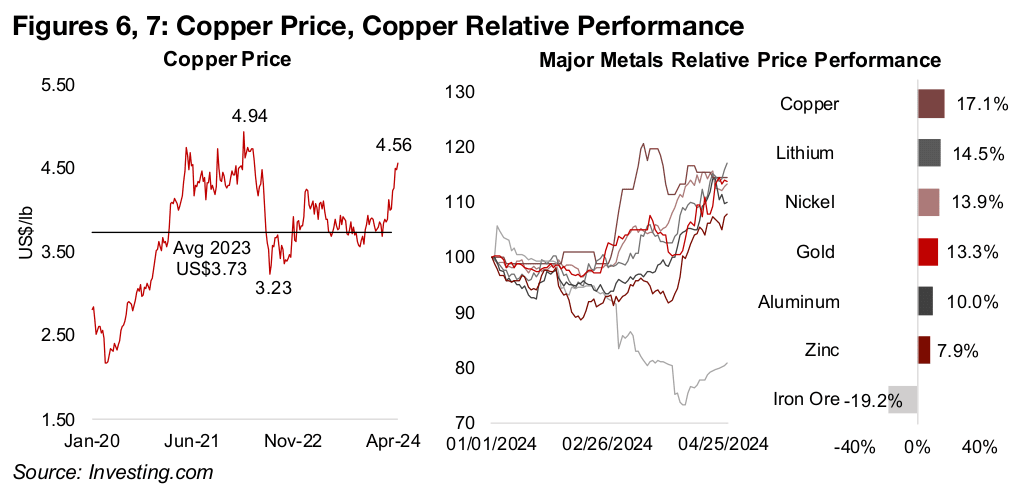
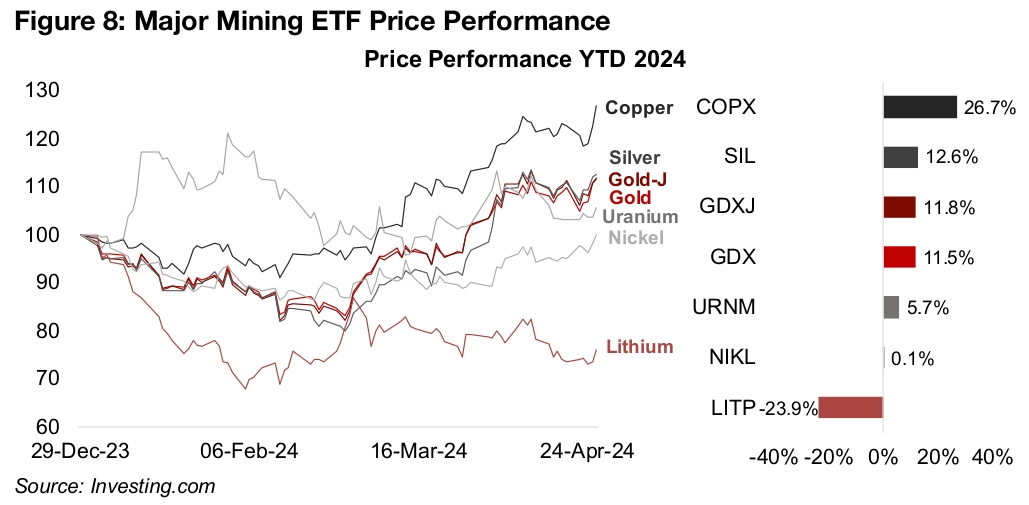
Even given gold’s very strong year so far, it has still been outpaced by copper, which has shot up to US$4.56/lb after starting 2024 near its four-year average of US$3.23/lb (Figure 6). The 17.1% gain in copper this year puts it significantly ahead of gold’s 13.3% rise and has seen it lead a wider upswing in the major industrial metals, with nickel, aluminum and zinc up 13.9%, 10.0% and 7.9%, respectively (Figure 7). Only iron ore has struggled, with the majority of its demand coming from China for use in steel production, which has cooled.
This has propelled the copper stocks, with the COPX ETF of producers gaining 26.7% this year. This has beat out even the solid gains in the precious metals ETFs, with the SIL ETF of silver producers, GDX ETF of gold producers and GDXJ ETF of gold juniors rising 12.6%, 11.8% and 11.5%, respectively (Figure 8).
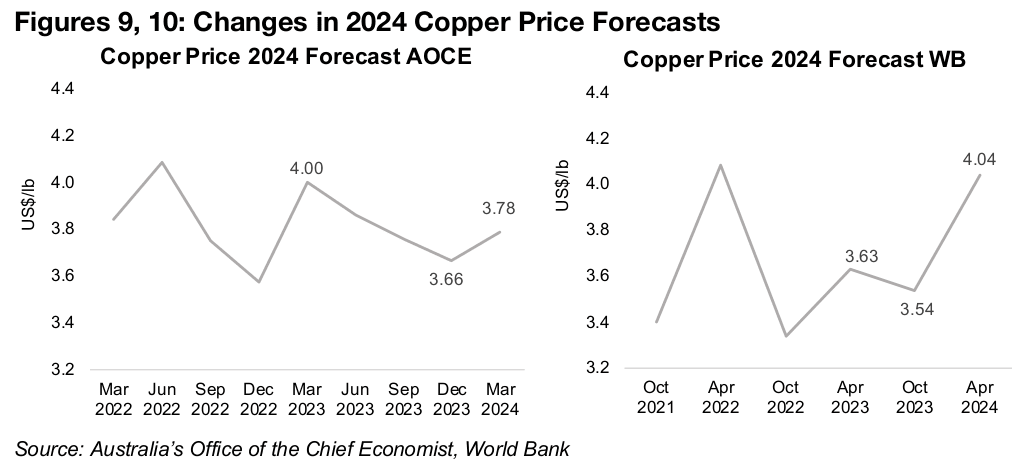
However, while the 2024 outlook for gold has consistently improved, with many forecasters chasing up the price with upgrades, copper forecasts have been more volatile. Figures 9 and 10 show the major swings in 2024E copper estimates quarterly from Australia’s Office of the Chief Economist (AOCE) and biannually from the World Bank from as low as US$3.40-US$3.50/lb to as high as US$4.00/lb. Clearly much of this was driven by the demand side, given the global health crisis and its aftermath. However, there have also been supply side issues, including most recently from the shutdown of Cobre, a major mine in Panama, over political issues. There is a quite a wide spread in the expectations of the outlook for copper across sources, with both bull and bear camps for the short and long-term outlook.
These major differences in forecasts, and even some historical data, for the sector
can be illustrated by the most readily available public sources for copper forecasts,
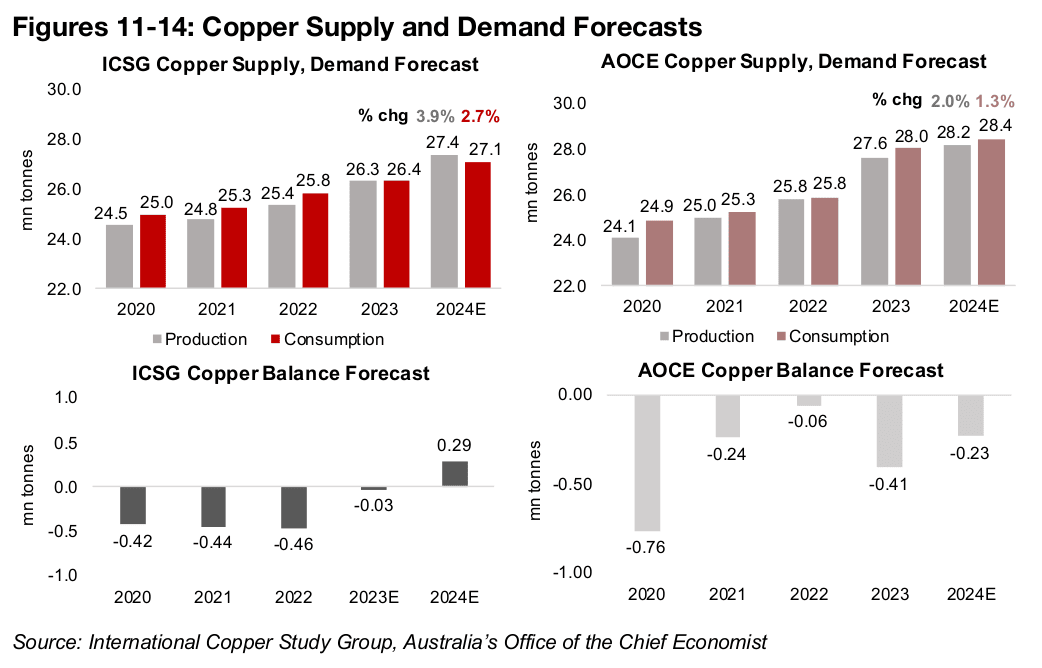
the International Copper Study Group (ICSG) and AOCE. While the consumption
figure for 2022 is the same across the sources, at 25.8 mn tonnes, ICSG’s production
estimate is 24.5 mn tonnes and the AOCE’s is 25.8 mn tonnes (Figures 11, 13). Even
this small difference in production drives a substantial change in the deficit for 2022,
with the ICSG at -460k tonnes and the AOCE at -60k tonnes.
There are even greater differences for 2023 as the figures are still ‘preliminary’ and
data still needs to be confirmed, with the AOCE far higher than the ICSG for both
production and consumption. This is turn affects the 2024 figures, with the ICSG’s
production and consumption growth of 3.9% and 2.7% well ahead of the 2.0% and
1.3% growth from the AOCE, but off a much lower base from 2023. An upward
revision of the 2023 preliminary ICSG data could conceivably bring the 2024 growth
figures closer to the AOCE.
These differences in production and consumption estimates lead to major differences
in the supply demand balance for the industry in 2024, with the ICSG at a 290k
surplus and AOCE at a -230k tonne deficit. These obviously have quite contrary
implications for the copper price, with the former implying some downward pressure,
and the latter more likely to indicate potential gains.
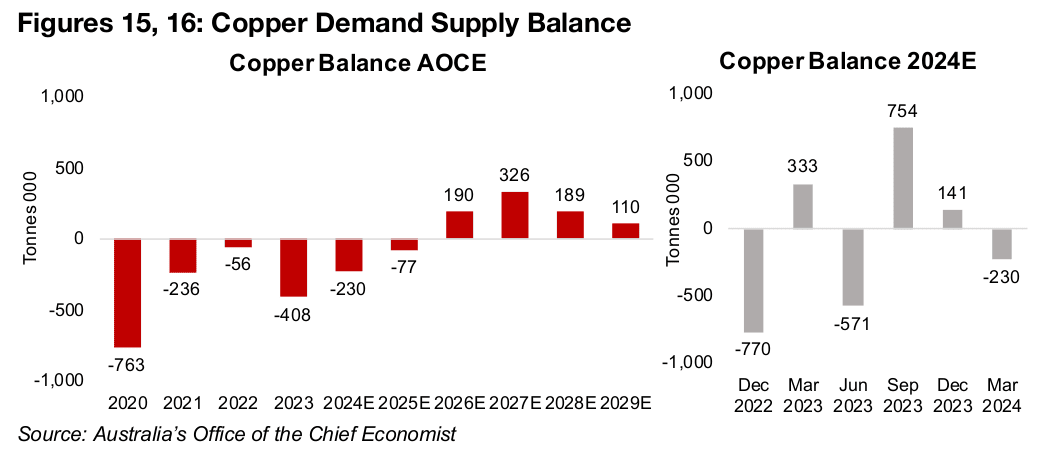
The AOCE has recently extended their copper forecasts to 2029, from only a few
years of estimates previously, while the ICSG only provides estimates for a single
forward year. The AOCE forecasts the 2024 surplus to contract in 2025 to -77k tonnes
and then move into a surplus from 2026 to 2029 (Figure 15). This would have negative
implications for the metal which is shown by the AOCE’s expectations for a broadly
flat copper price for the next seven years.
However, there is still a large debate between sources over the medium-term outlook
for copper. AOCE’s forecast surplus implies that average copper supply growth will
considerably outpace demand growth for the next several years. Other sources
believe that either this large rise in production will not come through or that demand
will be particularly strong, leading to considerable deficits for the industry.
The AOCE forecasts for the 2024E industry balance shows how volatile the copper
outlook can be, with extreme swings every quarter since December 2022 (Figure 16).
While these moves were exacerbated by a period of severe of economic uncertainty,
even in less turbulent periods the copper deficit or surplus is likely to prove difficult
to forecast, even for institutions with access to a massive amount of sector data.
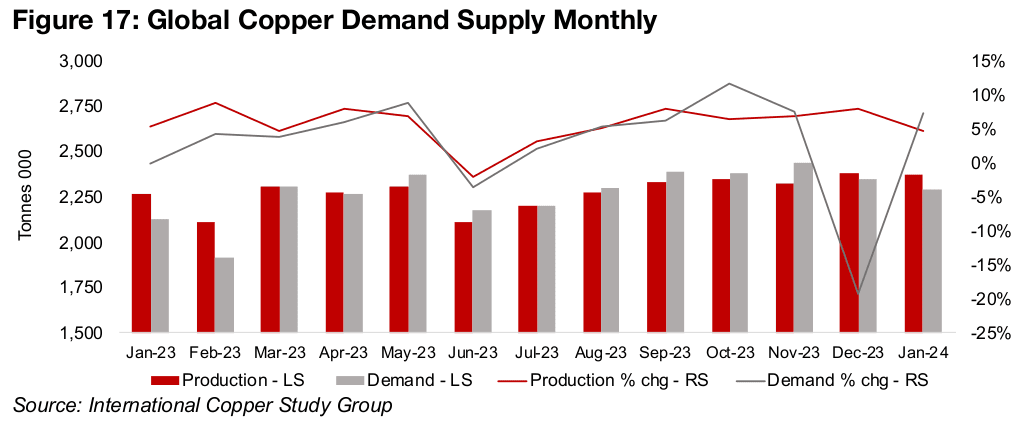
Relatively recent data on copper is available from the ICSG monthly release, although it still has a three-month lag, with the newest report in January 2024. However, like the other ICSG data, it could differ from other sources and is subject to revision. The report shows a slump in demand in December 2023 that does correlate with a decline in the copper price (Figure 17). There is then a significant rebound in demand in January 2024 with growth rising above supply, which corresponds to a rise in the price of the metal that month.
Growth in all the main segments of copper demand dropped in 2020 and rebounded in 2021, but was more mixed in 2022 as the global economy started to return to normal (Figure 18). The main drivers of copper demand over the next decade are expected to be electricity infrastructure, electric vehicles, and industrial demand especially from the manufacturing and IT segments. These three drivers correspond to the demand segments of infrastructure, equipment manufacturing and industrial applications, which have growth at 4.2%, 3.1% and 2.4% respectively from 2013- 2022 (Figure 18). These will likely be the main sources of growth, with construction potentially continuing to lag other sectors after growing only 0.6% from 2013-2022.

Estimates for overall the rate of copper demand growth differ considerably across source. At the high end, some forecasters expect 10mn tonnes of new demand over the next decade, or 1.0mn tonnes per year, which could drive considerable copper deficits. This contrasts with the AOCE, with demand rising to 31.9mn tonnes in 2029 from 28.0 mn tonnes in 2023. This is a 3.8mn tonne increase, or just 0.6mn tonnes per year and explains the copper surpluses forecast by the institution. The big medium-term risk for demand is a global recession, which could drag down growth across all the major segments as in 2020 and drive major copper surpluses.
Overall we would expect copper supply to be more stable than demand, especially
short-term, given up to a decade or more lead-time to bring a mine into production
and the predictable output of most major mines. However, major supply shocks can
also occur from natural or political events reducing capacity. The most recent such
even was political, with the government of Panama shutting down First Quantum’s
Cobre mine after protests in the country, which produced 350k tonnes in 2022.
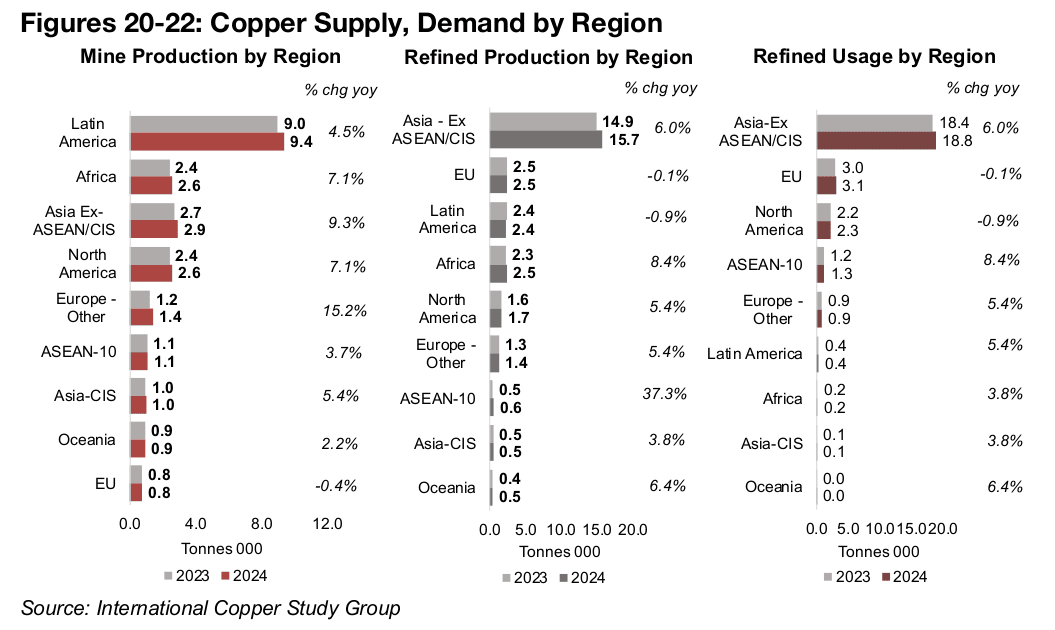
Copper mine supply is heavily reliant on Latin America, especially Chile and Peru,
Africa, mainly from the Congo, China, which comprises most of the ‘Asia Ex-
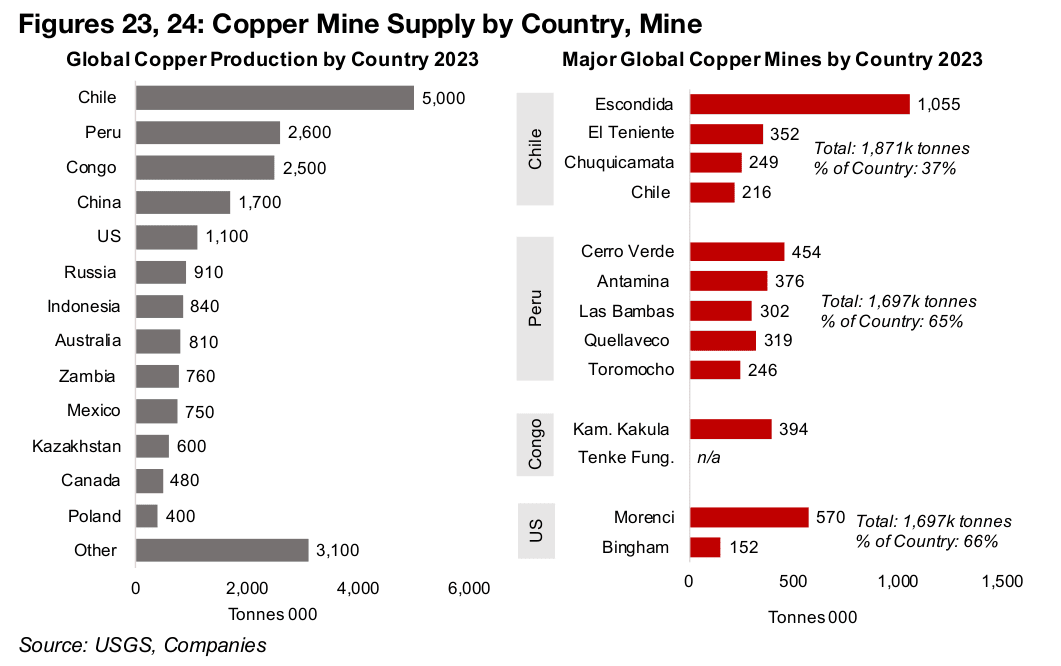
ASEAN/CIS’ in Figures 20-22, and the US. However, with even a 500k tonne change
in supply enough to shift the industry from surplus to deficit, many other regions can
also have a critical effect on supply, including Russia, Indonesia, Zambia and Mexico,
which have most of their output from a single major mine (Figure 23).
Output from Chile, Peru, the Congo and US are also concentrated mainly in a few
major mines which each alone could be a major swing factor in the balance of world
copper output. China has a more fragmented industry, with a large overall output of
1.7mn tonnes, but from many smaller mines (Figure 24). Refined production is heavily
concentrated in China, which again comprises the large majority of Asia ex-
ASEAN/CIS output (Figure 21). Demand also looks highly concentrated in Asia ex-
ASEAN/CIS, with North America and Europe much lower (Figure 22). However, much
of this copper demand is for manufacturing exported products, with much of the final
demand in Western countries.
We see the outlook for copper as more opaque than for gold, which overall looks to
be still supported by a range of drivers this year. There is a risk to copper demand if
growth in the electric vehicle industry and related electricity infrastructure come in
below some more aggressive estimates. More broadly there is the risk of a global
recession that could see a sharp short-term drop in demand which could set back
some more aggressive ten-year demand forecasts. While there is likely more clarity
on the supply-side term medium-term and potentially less risk to estimates there,
another shock the Cobre shutdown by Panama can’t be ruled out. Problems at just
a handful of major mines could have a big effect on the industry deficit or surplus,
and therefore a significant effect on the copper price.
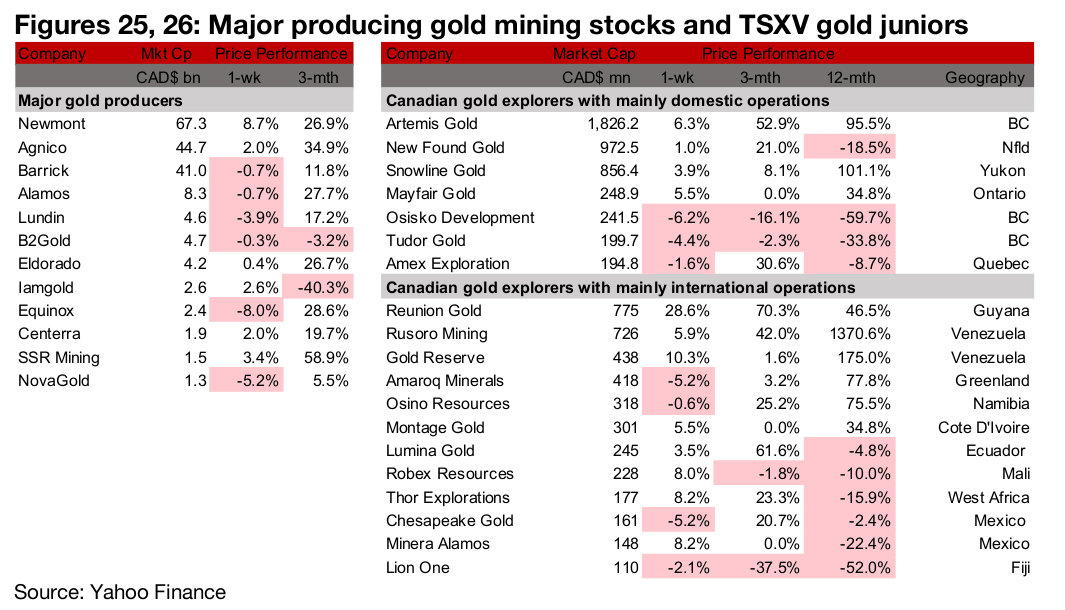
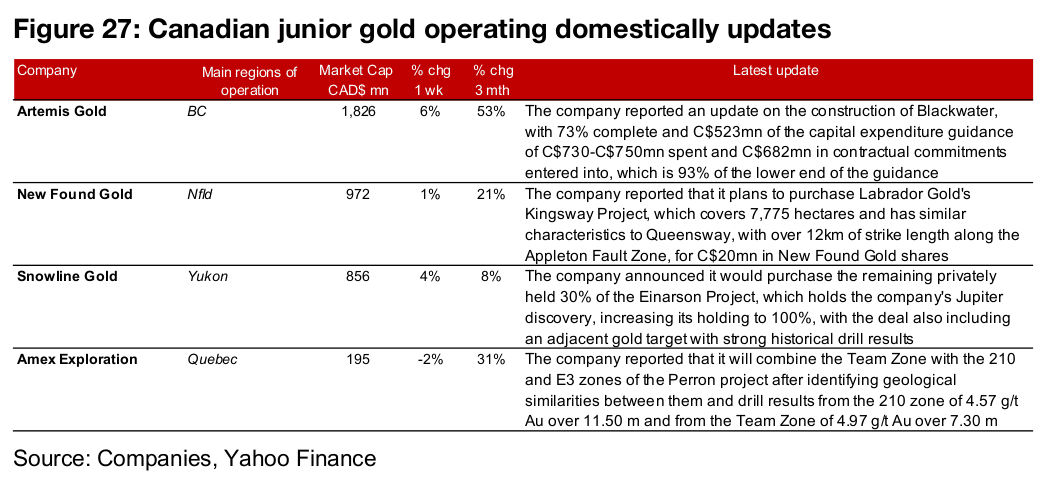
The large producers and TSXV gold companies were mixed as gold declined but equities rose (Figures 25, 26). For the TSXV gold companies operating domestically, Artemis Gold reported a construction update on Blackwater, New Found Gold announced the acquisition of Labrador Gold’s Kingsway project, Snowline Gold increased its holding of Einarson to 100% and Amex will combine the Team Zone with the 210 and E3 zones of Perron (Figure 27). For the TSXV gold companies operating internationally, Reunion Gold reported that it would combine with G Mining Ventures, Minera Gold’s subsidiary Cobre 4H will merge with Minera Gold Copper and Lumina gold reported drill results from Zone 2 of Tuvatu (Figure 28).

Disclaimer: This report is for informational use only and should not be used an alternative to the financial and legal advice of a qualified professional in business planning and investment. We do not represent that forecasts in this report will lead to a specific outcome or result, and are not liable in the event of any business action taken in whole or in part as a result of the contents of this report.
Author
Ben McGregor authors the Weekly Roundup at CanadianMiningReport.com, providing sharp analysis of the metals and mining sector. With a talent for spotting trends, Ben distills complex market shifts into clear, engaging insights on TSXV junior miners. His weekly updates cover gold, copper, uranium, and more, blending data-driven perspectives with a knack for identifying opportunities. A vital resource for investors, Ben’s work navigates the dynamic junior mining landscape with precision.