
July 3, 2020
The gold futures price closed above US$1,800/oz for one day this week, and while it retreated after to end the week nearly flat at US$1,773, this was a key level for the market, and marked a new seven and a half year high.
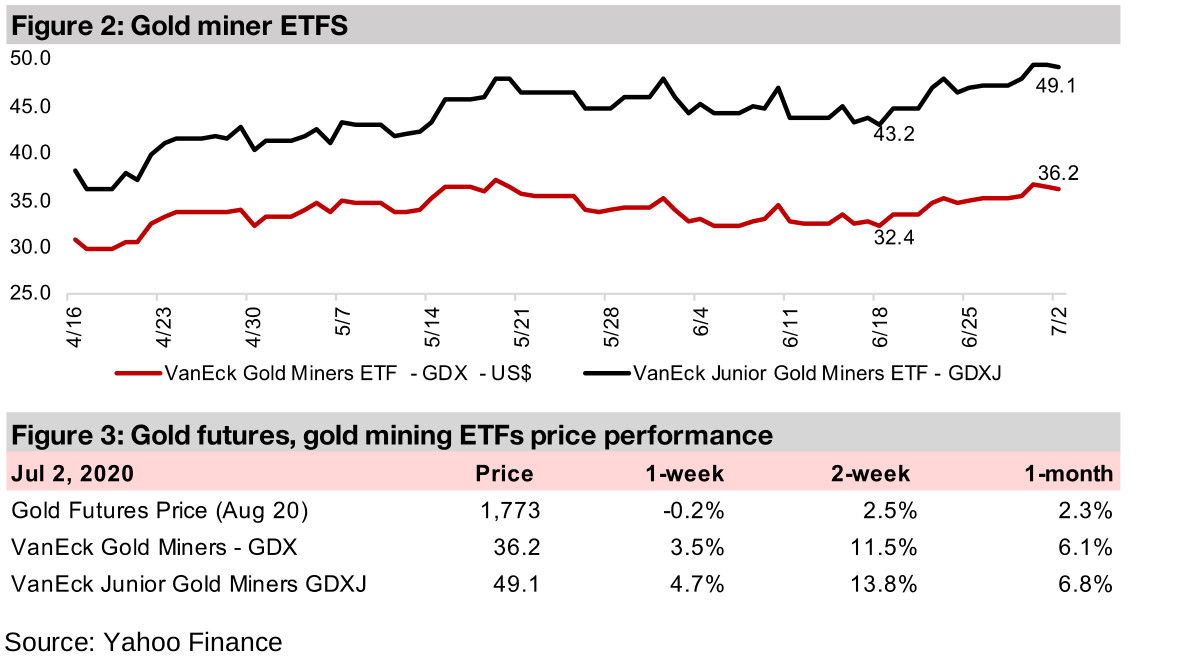
The producing miners rose this week, with GDX up 3.5%, with nearly all the major gold miners gaining, and the GDX has risen 11.5% over the past two weeks as the market may be starting to see gold above US$1,700 as more than temporary.
The junior gold miners also gained, with the GDXJ up 4.7% this week, with the Canadian junior gold miners seeing particularly strong gains, with many surging over 20%, including a 34.1% gain in Yukon-focused White Gold, In Focus this week.


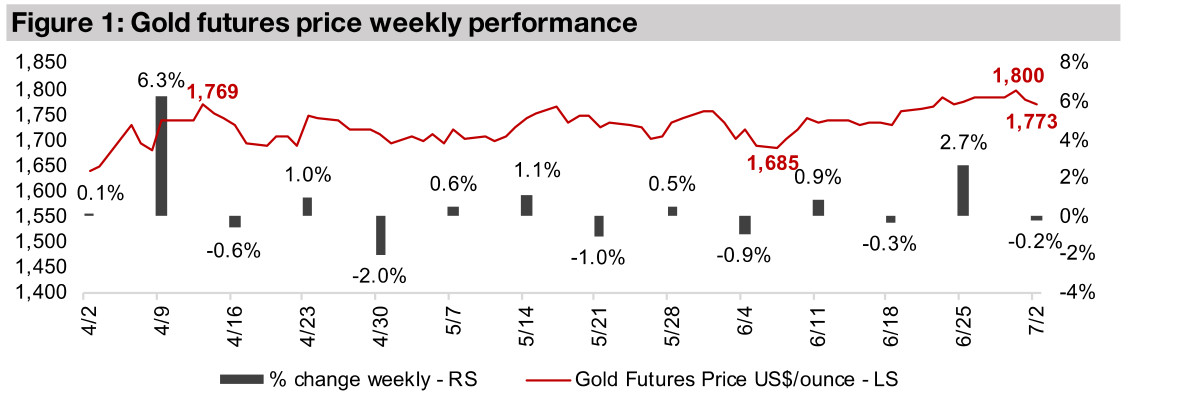
The gold futures price briefly surpassed the key US$1,800/oz level this week, holding the level for one day, but saw a subsequent moderate retreat to end the week nearly flat, ticking down -0.2% to US$1,773/oz. This was still well above the key resistance level of about US$1,760/oz, which had held for over two months from April 2020, before the run up of the past two weeks. The gold spot price reached seven and half year highs of over US$1,787/oz, and has continued to be buoyed by a massive US Fed monetary expansion, negative global interest rates and continued concerns about the immediate risks and long-term economic effects of the global health crisis.
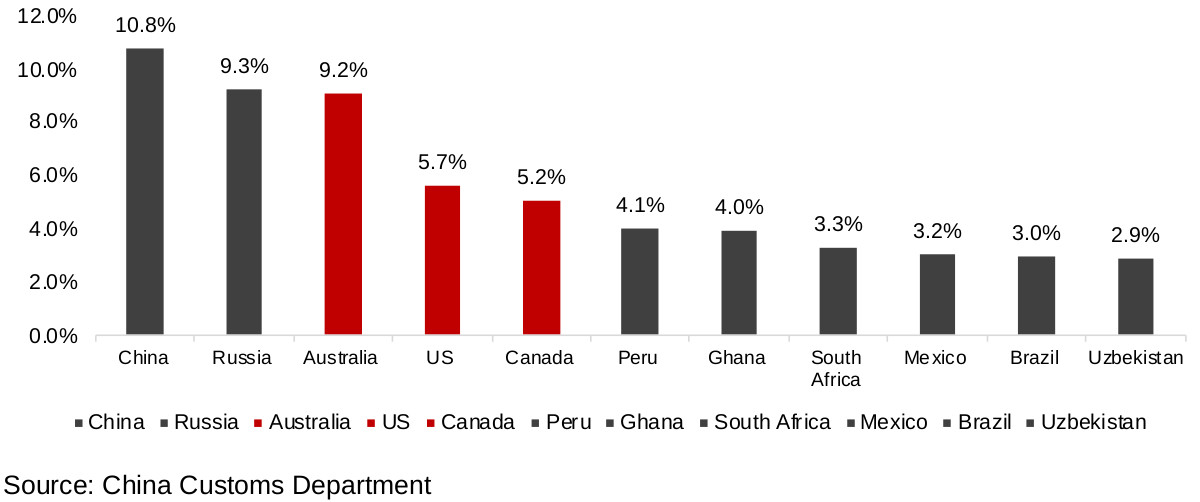
Last week we looked at most the most recently reported gold demand data series; this week we consider supply. Of the largest global gold producing countries, the most recent data series related to global gold supply are reported by Australia, the US and Canada, with Russia and China supply data more limited and reported with a time lag (Figure 4). For the third highest contributor, Australia, there is mineral exploration data, which is especially relevant for gold juniors, for the US, there are two series, a gold and silver ore mining index and recent monthly gold production, and for Canada, there is monthly gold production.
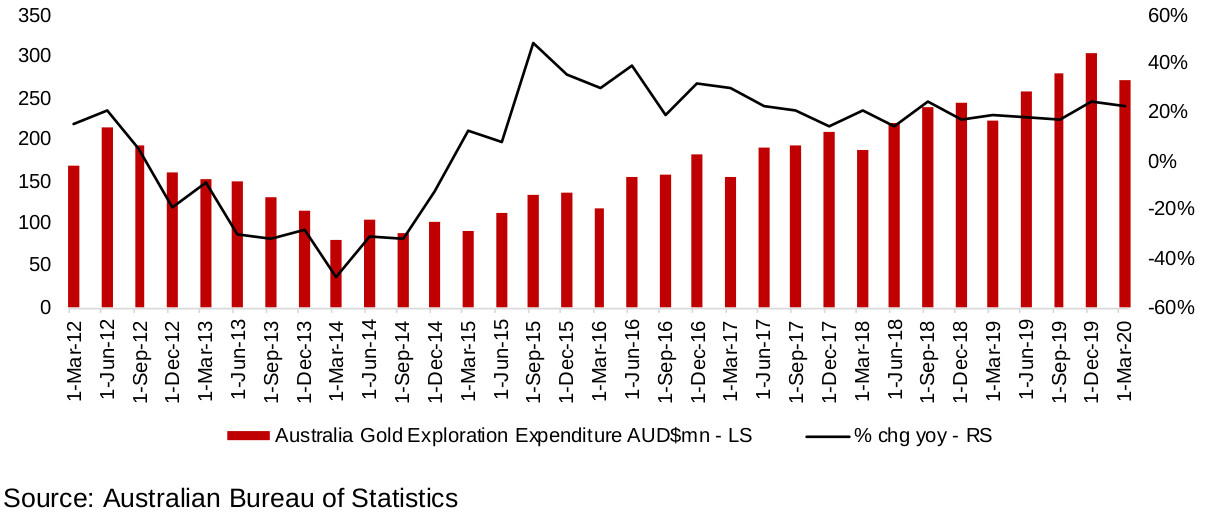
The most up to date series on gold from Australia is not production, but rather gold exploration expenditure by quarter, with the most recent data from March 2020. This series shows that gold exploration in expenditure in Australia reached a trough around 2014, and has rebounded ever since, well before the rise in the gold price that started in 2019 (Figure 5). Gold exploration expenditure growth has steadied over the past ten quarters, averaging a strong 19.2% yoy.
The dip in Q1/20 would have partially included the effect of the global health crisis, and it is likely that Q2/20 will also see similar pressure. However, with the gold price continuing to rise, and now at seven year highs, and with global mining resuming, it is possible that the absolute level of mineral exploration could rebound back to the Q4/19 peak, or higher, in Q3/20, as gold exploration is becoming far more attractive given the promise of widening margins because of the rising gold price.
While this is series is an indicator of potential growth in gold mine production, as a major increase in exploration expenditure can eventually be expected to result in new finds and production, there is a major time lag in this, of between five years to even a decade, so the jump in gold exploration outlined by this series from 2017 to the present, may not translate to an increase in gold production until well into the mid-2020s.
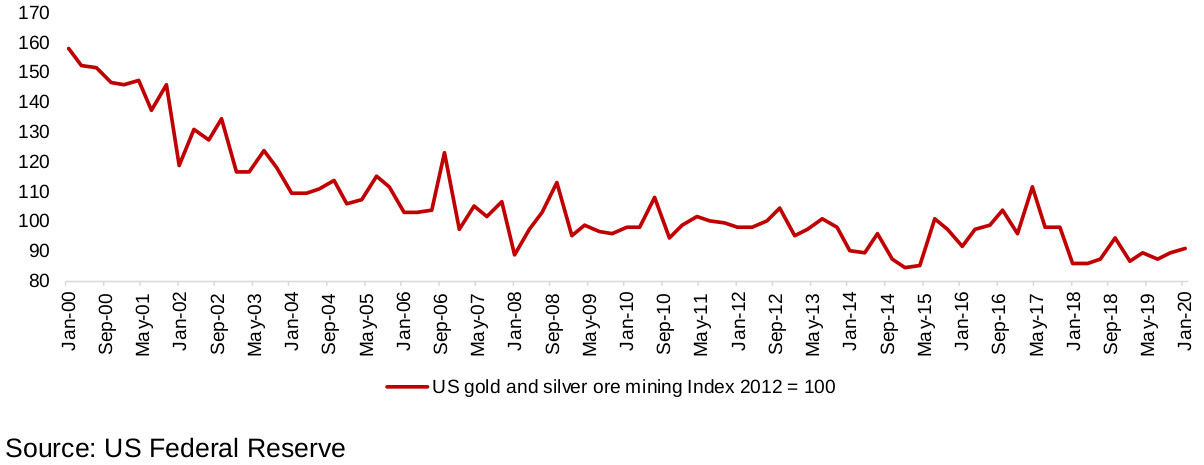
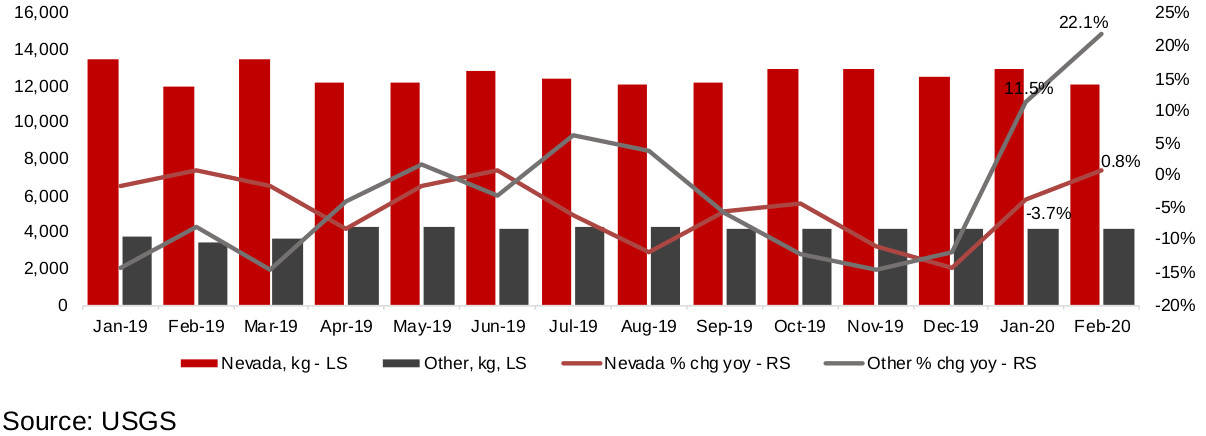
US gold production remains relatively weak. The longer-term series available is the US gold and silver ore mineral index, which has declined from levels above 160 in 2000, to an average of 95.8 from 2008 to the present, and as of the most recently reported May 2020 data, the index was just 90.8 (Figure 6). The USGS also reports monthly US gold production up to February 2020, at which point the global health crisis was not yet curbing production. For the past year, gold production has been weak, inline with what we see in the gold and silver ore index. The country's biggest contributor is Nevada, for which gold growth output fell -1.6% yoy in the first two months of 2020, and could remain negative in March and April because of the global health crisis (Figure 7). Growth from other contributors rose 16.5% yoy over 2M/20, with about 35% from Alaska, which has seen strong 22.3% growth in production. Overall, Nevada production would need to pick up for strong growth in US production.
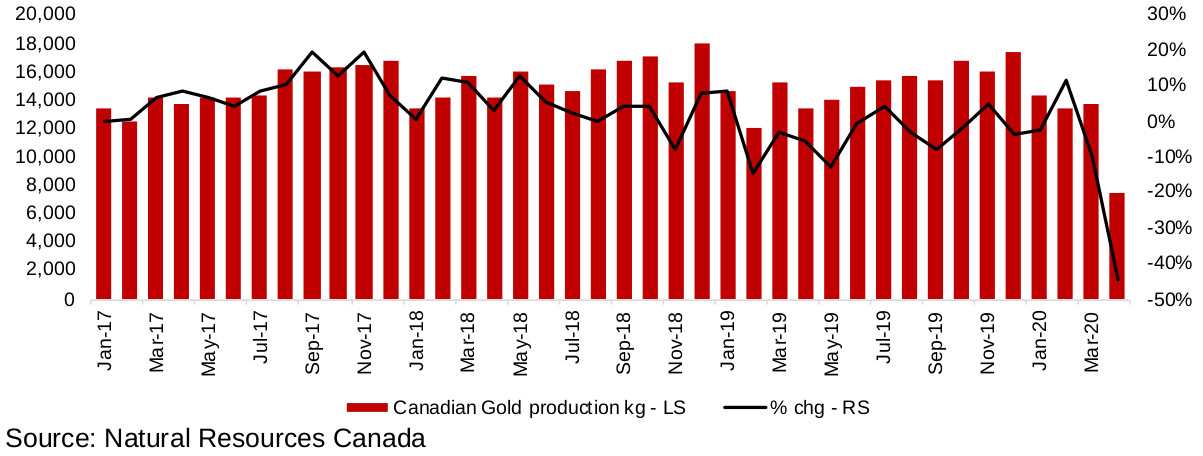
Canadian gold production growth plummeted in April 2020 -44.2% to 7,537 kg, which was to be expected given closures related to the global health crisis. With many mines coming back into production from June 2020, we are likely to see another month of weak data in May 2020, and then a rebound, and a return to pre-crisis levels is possible by July 2020. Pre-crisis levels of production growth, however, were already relatively weak, increasing 2.7% on average for 2019, and declining -11.1% for Q1/20.
Global estimates for global gold mining production are looking for about 2.0% growth at the high end on average for the next several years, and flat to slightly negative growth at the low end. It appears that with the global crisis, the lower end of the forecast range is possible this year. The four series we look at here, while pointing to rising exploration expenditure for Australia, will not mean an immediate boost to gold production, and the other series show relatively flat gold production growth for the US and Canada, two other substantial gold producers. China and Russia production will have also been affected by the global crisis, and in any case, even coming out of the crisis, could need to make up for weakness from these other suppliers just to keep growth flat. For the gold price, this weak supply could be good news, as demand for gold as a hedge against monetary and economic risks is clearly surging, even as supply growth will be marginal at best this year.
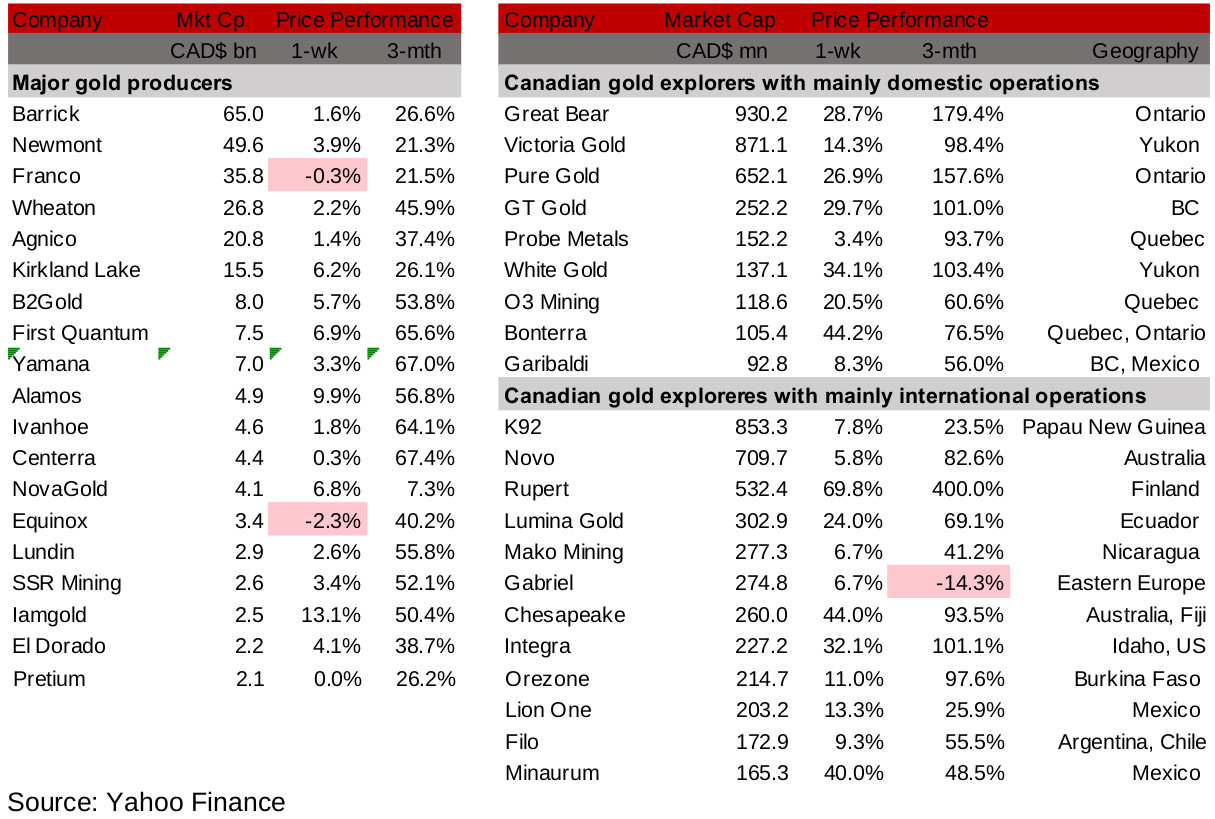
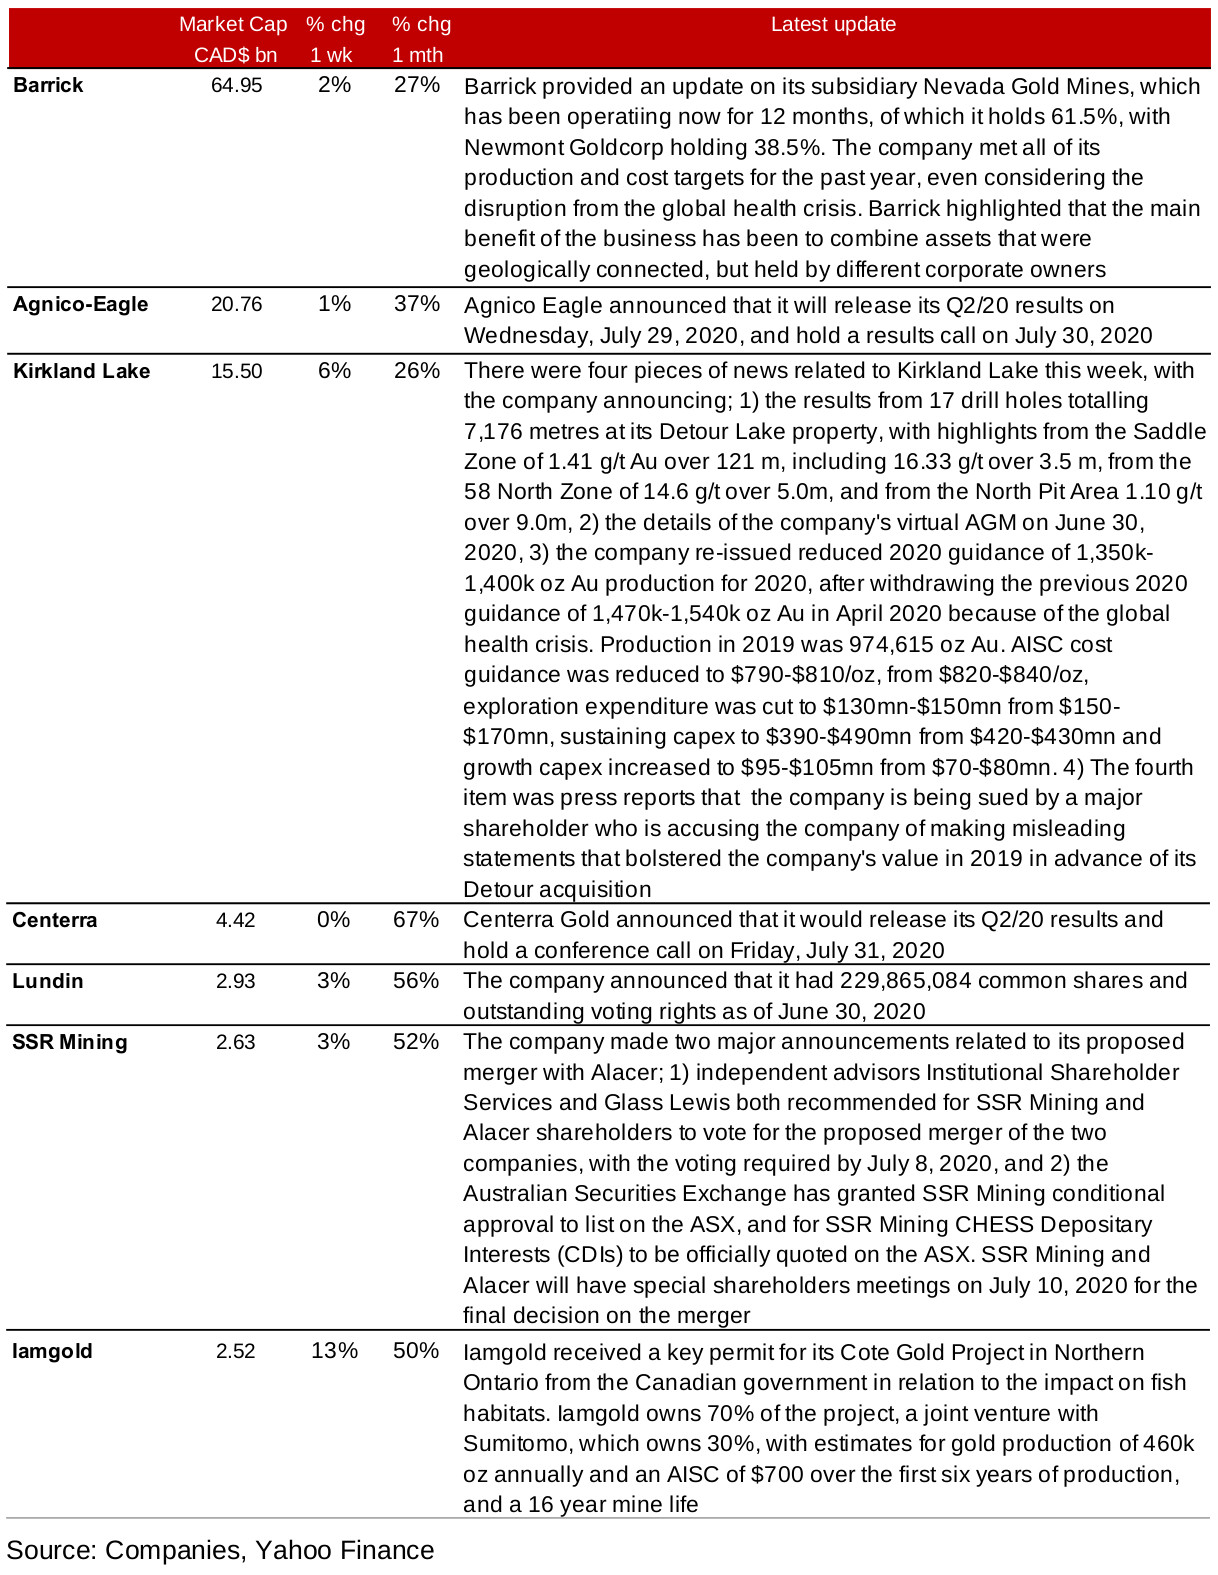
Most of the major producing miners saw increases this week, mainly by single digits (Figure 9). Major press releases included SSR Mining's and Alacer Gold's independent advisors recommending that shareholders approve their proposed merger of equals, with the final decision to take place at special shareholders meeting by both companies on July 10, 2020 (Figure 11). The combined market cap of the two would be $5.3bn, placing it between First Quantum Minerals and Alamos Gold in size. The Australian Securities Exchange has also approved a listing of SSR Mining, which is currently listed in Canada, with Alacer listed in Australia. There were several items of material news flow about Kirkland Lake Gold this week, with the company announcing recent drilling results, details of its upcoming AGM, re-issuing 2020 guidance, while there were press reports that the company was being sued by a major shareholder claiming misleading estimates were released by the company in the run up to the Detour Gold acquisition. Iamgold received a major fisheries-related environmental approval for its Cote project by the Canadian government, and Barrick gave an update on its first twelve months of operations from its 61.5%-owned Nevada Gold Mines joint venture. Agnico Eagle and Centerra released AGM details and Lundin a share number and voting rights update.
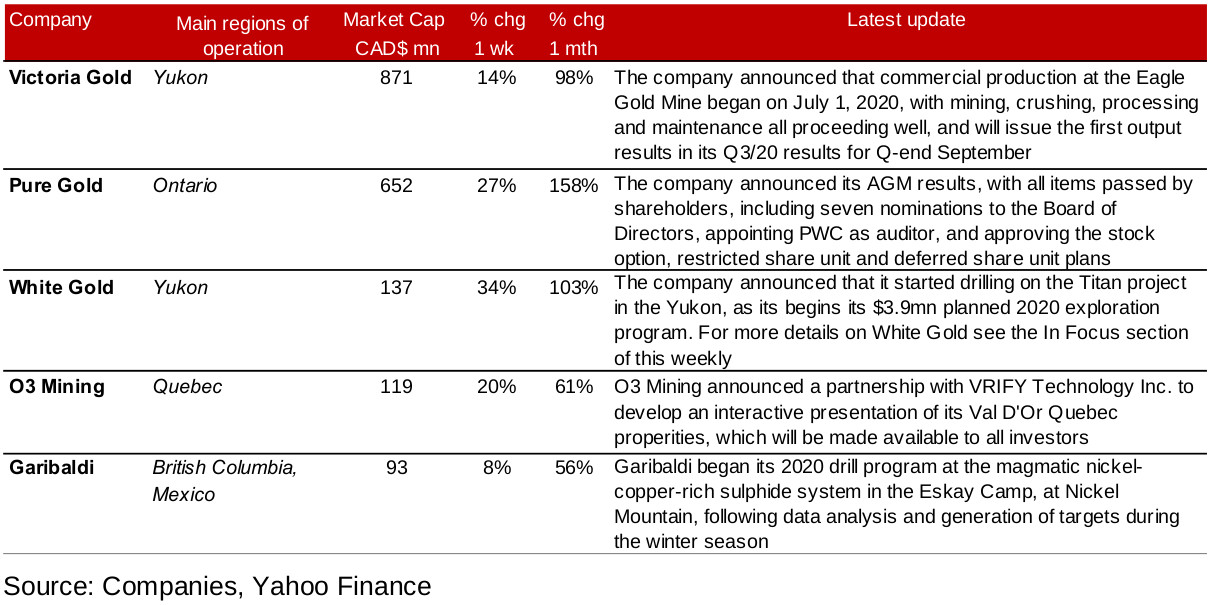
The Canadian operating juniors surged this week, with the entire group of nine rising, and six up 20% or more (Figure 10). White Gold saw the biggest surge this week, up 41%, after announcing the start of its new exploration season in the Yukon, focusing on its Titan project; see our In Focus section for more on this stock. Victoria Gold was up 20% as it began commercial production at its Eagle Gold Mine, and Garibaldi up 10% as it began its 2020 drill program (Figure 12). Two other stocks saw big rises even with relatively neutral press releases, with Pure Gold up 26%, and announcing only as expected AGM results, and O3 Mining up 23% after announcing a new interactive presentation of its Val D'Or Quebec properties.
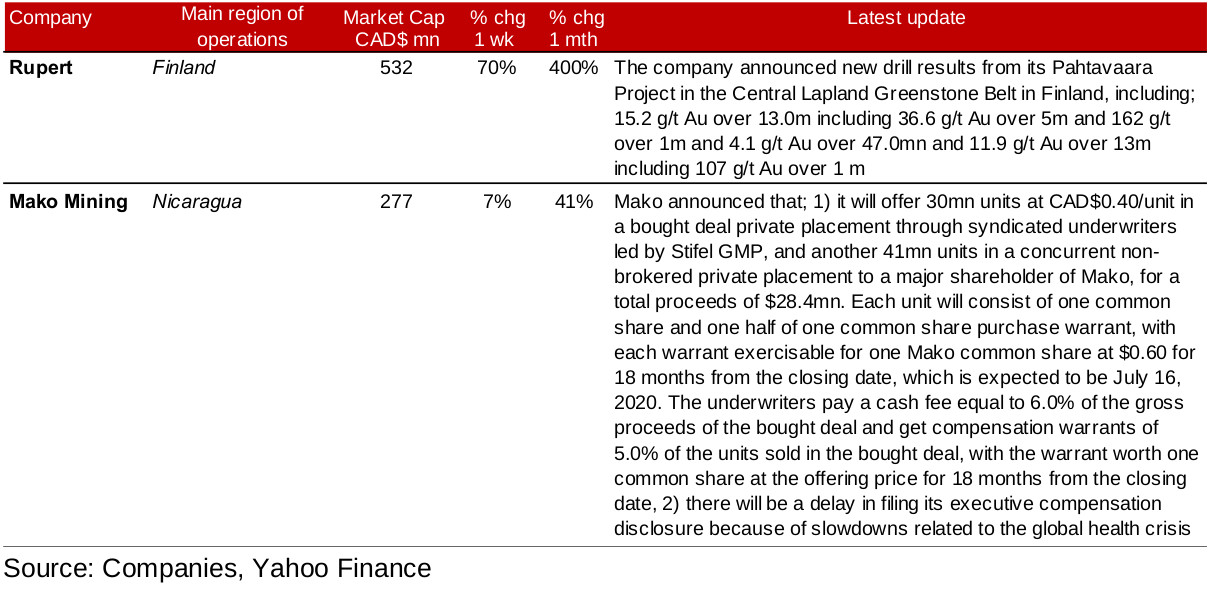
The Canadian operating junior gold mining stocks all rose this week, with five out of twelve seeing over 20% gains (Figure 10). This was accompanied by only two press releases, however, one rom Rupert Resources, which announced drilling results from the ongoing exploration at Pahtavaara in Finland and another from Mako Mining announcing the details of its planned bought deal private placement (Figure 13).
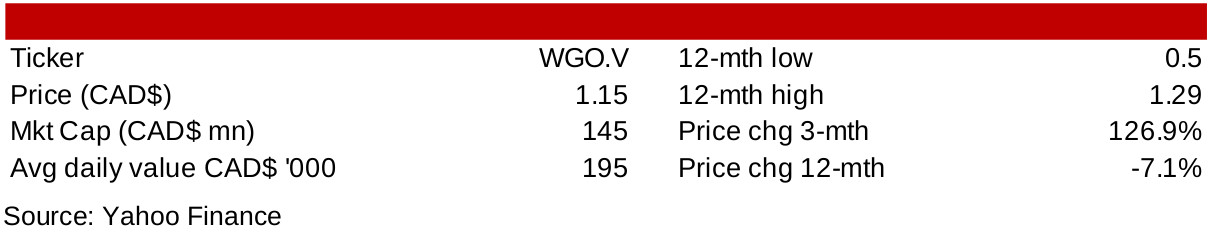
White Gold operates nearly 40 projects over a 420,000 h.a. property package in Canada's Yukon Territory, with three at an advanced stage, six at the discovery stage, and around 30 early stage projects. The company's most advanced projects, for which mineral resource estimates have been released are Golden Saddle, with 1,021,900 oz Au Indicated and 314,300 oz Au Inferred resources, and Arc, with 17,700 oz Au Indicated, and 194,500 oz Au Inferred resources. The company's exploration for 2020 will be focused on four projects, with a total $3.98mn budget planned, with 1) $1.20mn for 3,000m drilling program, $0.60mn for 1,500m at Ryan's Surprise and $0.60mn for 1,500m at Titan, with 2) $0.575mn for rapid single hole RC/RAB drilling, $0.20mn Ryan's Surprise, $0.175mn at Titan, and $0.20mn JP Ross, 3) $0.515mn on other exploration at these three targets, and 4) $1.38mn in soil, GT Probe and other early stage exploration at other areas of its properties.
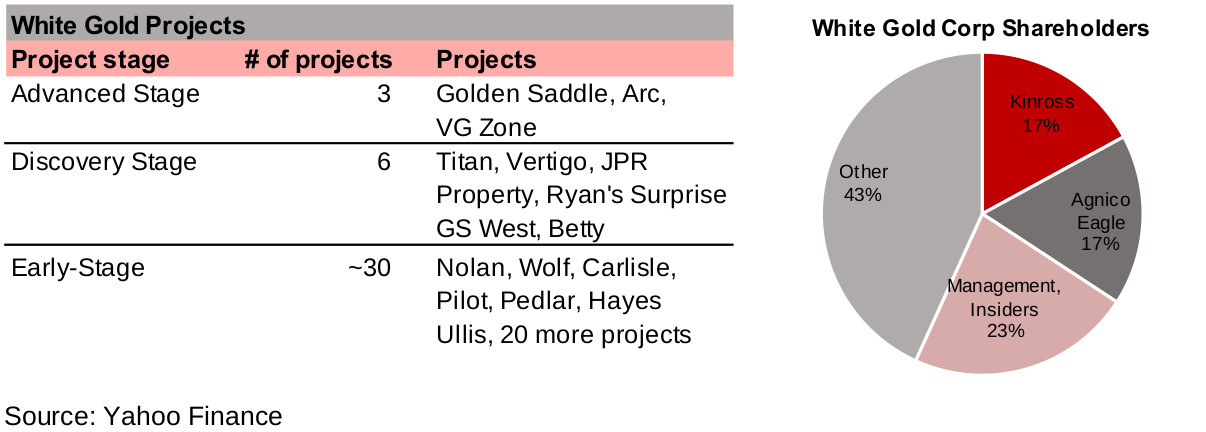
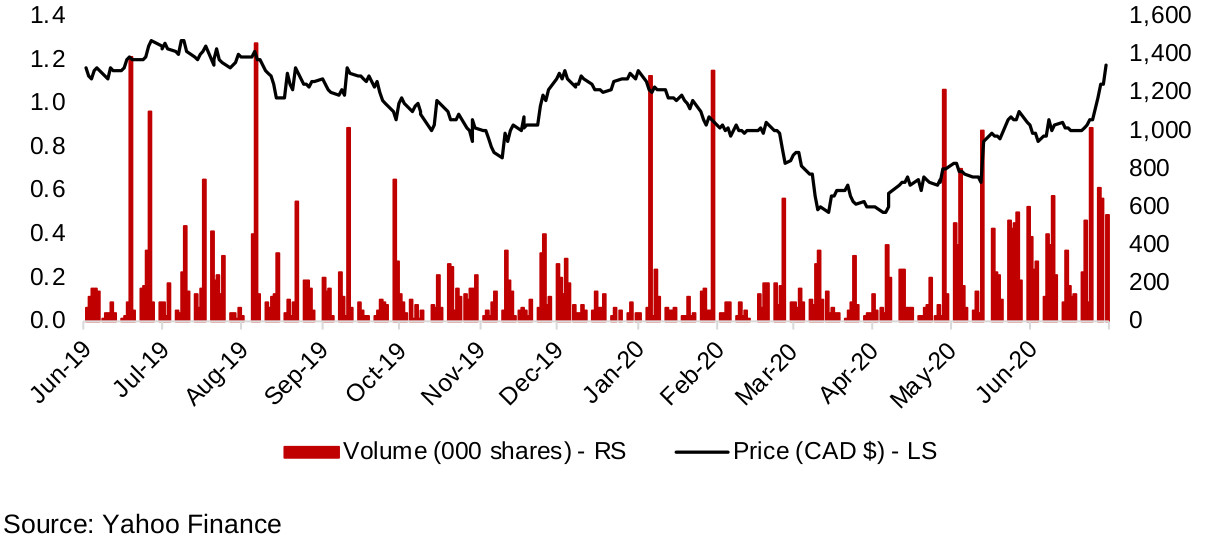
The company is fully funded for this exploration program, with a $6mn private placement announced on May 15, 2020 and the press release of the closing on June 10, 2020, for 6.6mn flow through shares at C$0.90/share. The company's two major strategic shareholders, Kinross and Agnico Eagle, which each hold 17.1% of the company, participated in the placement to maintain their stake (Figure 16), and other major buyers included Eric Sprott, funds managed by Sprott Management and company insiders. This sent the shares up 29.7% on the day, with the next major recent boost to the share price on June 29, 2020, when the company announced that it was beginning its 2020 exploration program on the Titan Project in the White Gold district. The share price was relatively weak in January to February 2020, prior the broader market crash, as announcements of drilling results had failed to buoy the market. However, with the new financing, new exploration plan and the rising gold price driving overall investor sentiment regarding junior gold miners, the stock has now returned to its most recent high in December 2019 of CAD$1.15/share.
Disclaimer: This report is for informational use only and should not be used an alternative to the financial and legal advice of a qualified professional in business planning and investment. We do not represent that forecasts in this report will lead to a specific outcome or result, and are not liable in the event of any business action taken in whole or in part as a result of the contents of this report.
Author
Ben McGregor authors the Weekly Roundup at CanadianMiningReport.com, providing sharp analysis of the metals and mining sector. With a talent for spotting trends, Ben distills complex market shifts into clear, engaging insights on TSXV junior miners. His weekly updates cover gold, copper, uranium, and more, blending data-driven perspectives with a knack for identifying opportunities. A vital resource for investors, Ben’s work navigates the dynamic junior mining landscape with precision.