
May 19, 2025
Gold declined -4.6% to US$3,182/oz, slipping just below the US$3,200/oz- US$3,400/oz range of the past four weeks, as the risk on move in markets continued on a US-China trade deal, declining inflation and a rise in the US$ and bond yields.
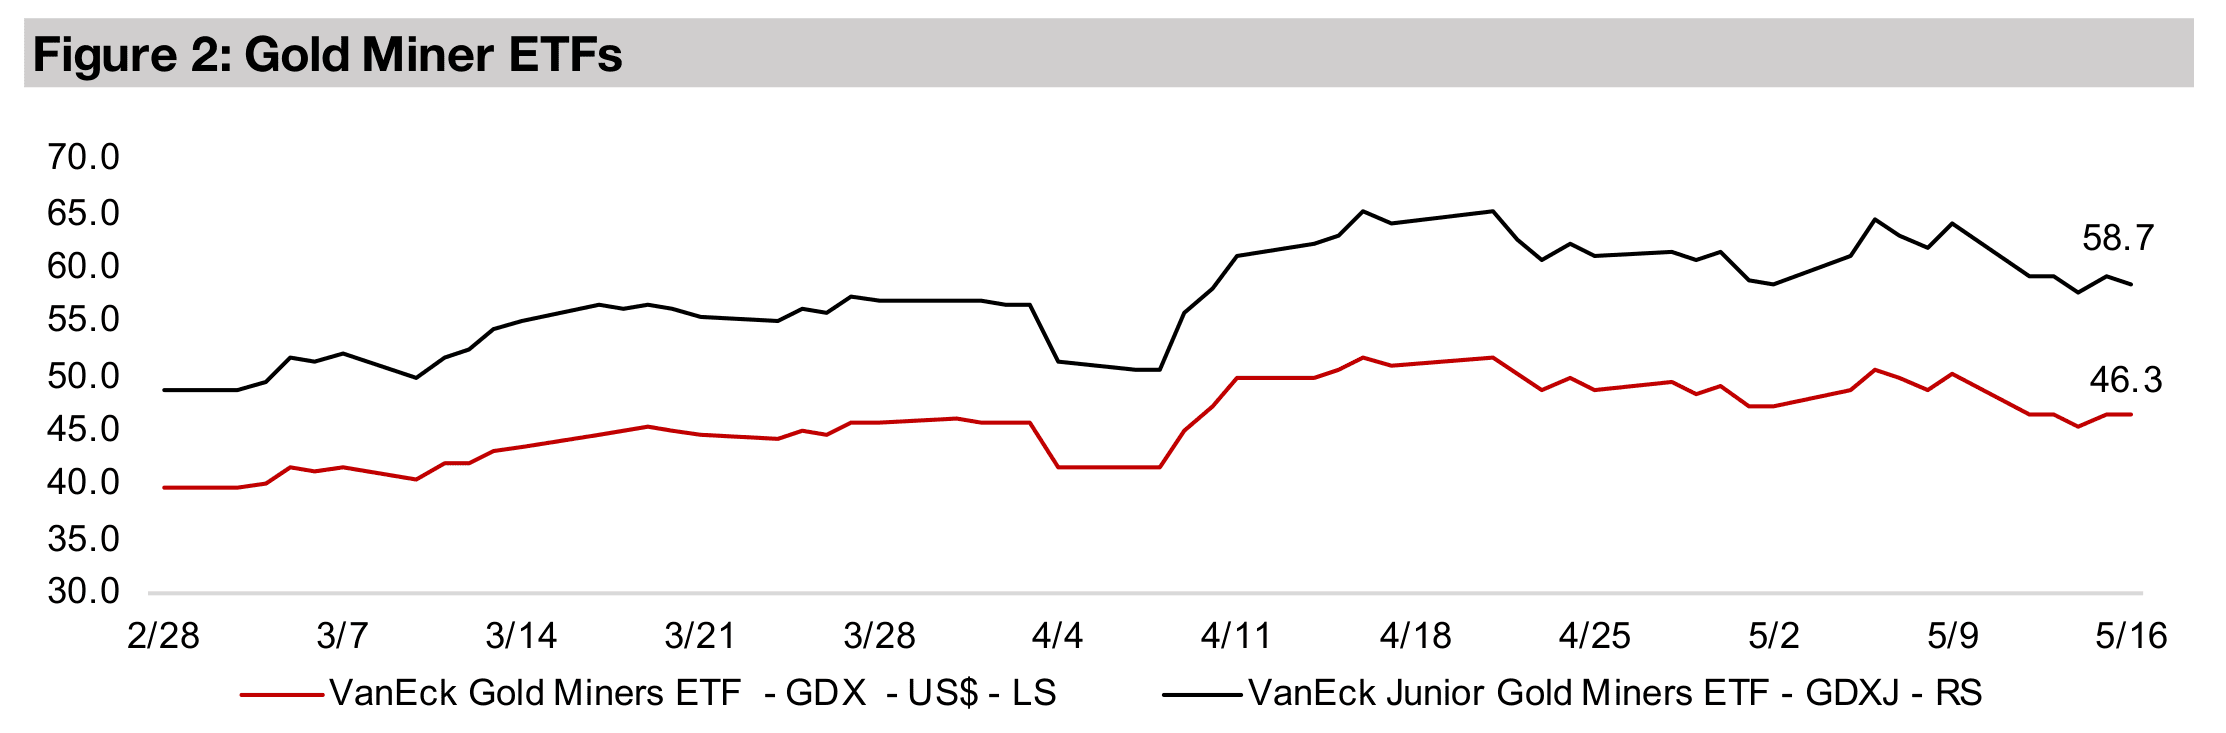
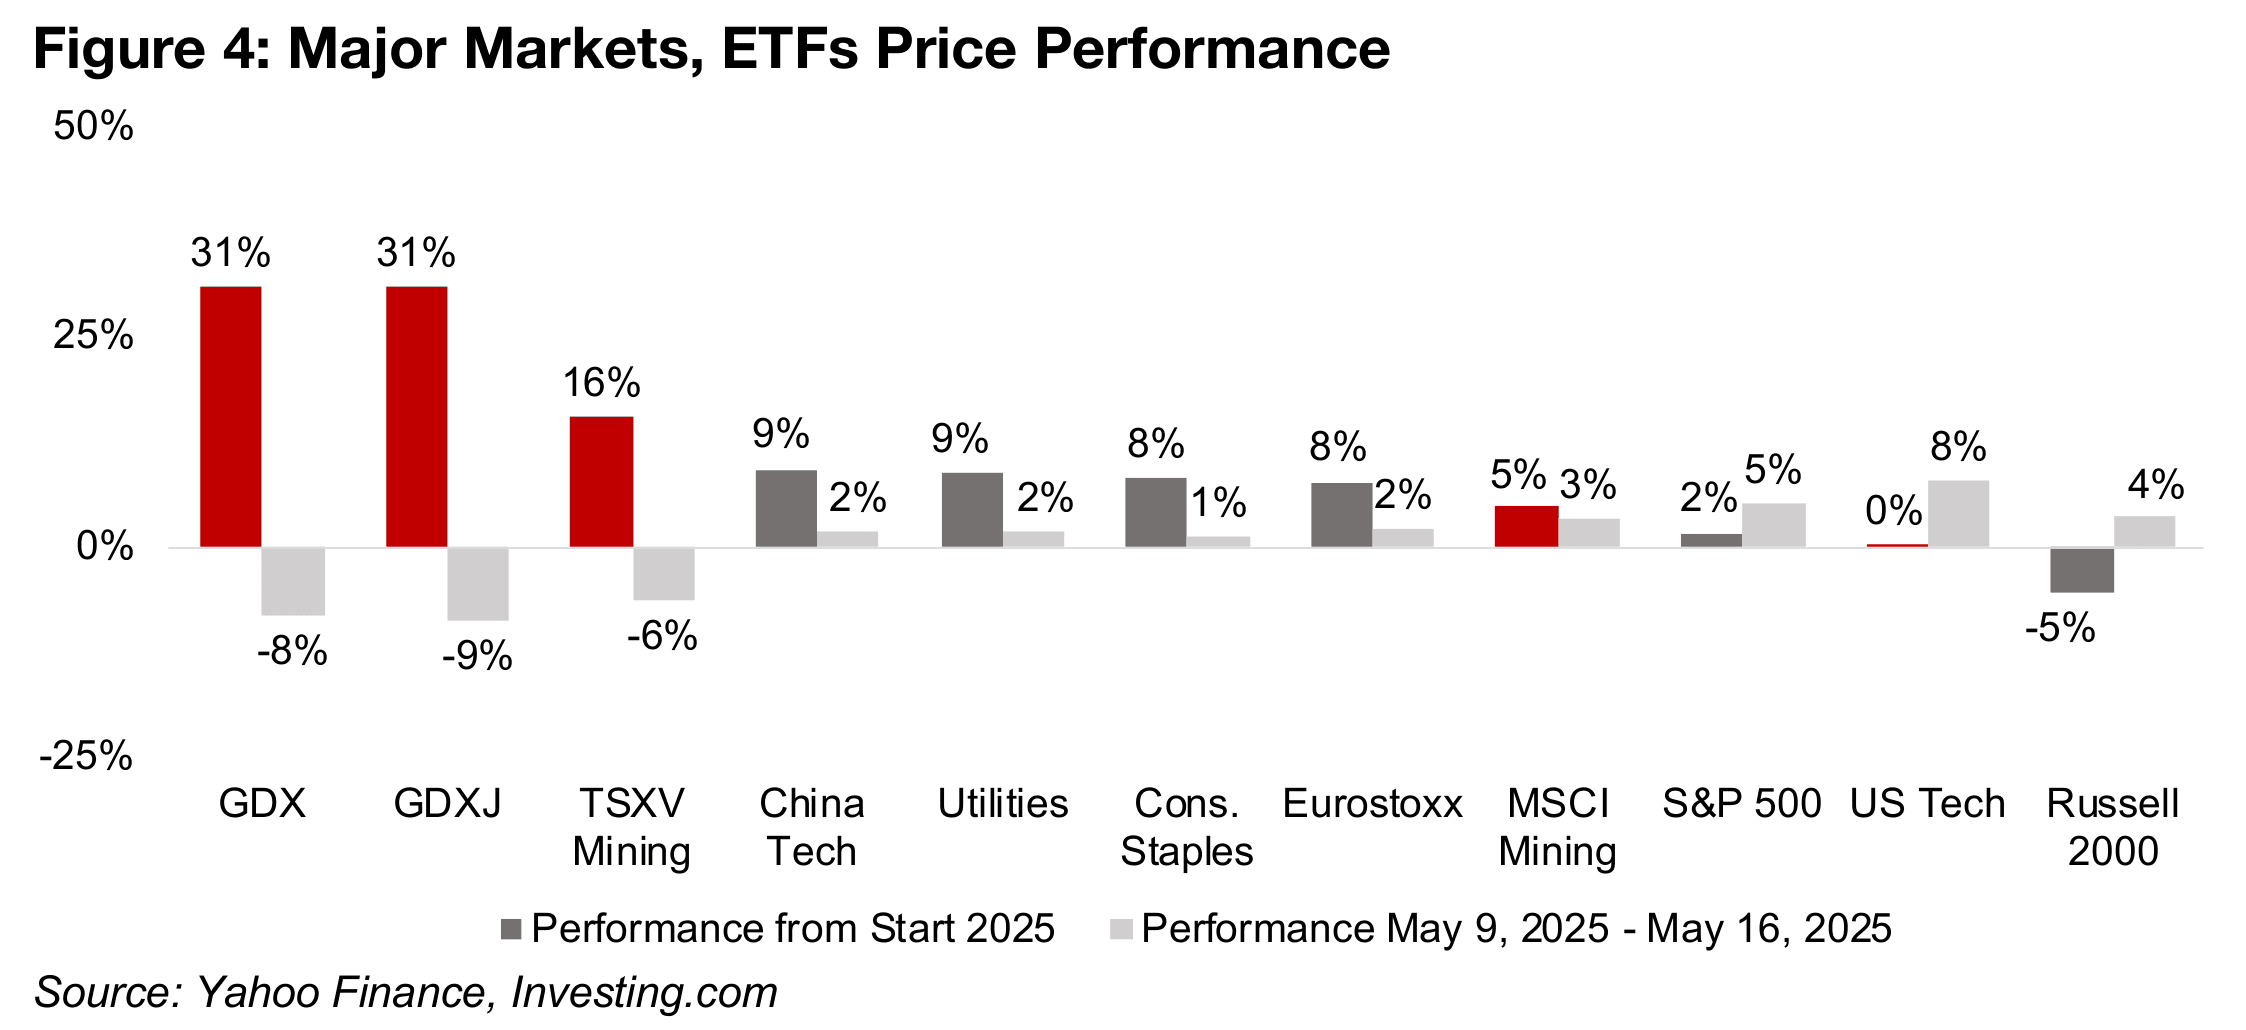
The gold stocks slumped on the metal drop, while a rise in equities resumed after a pause last week, with safe havens less in focus and the GDX and GDXJ down -8.0% and -8.7% but the S&P 500, Nasdaq and Russell 2000 up 2.6%, 2.9% and 1.3%.


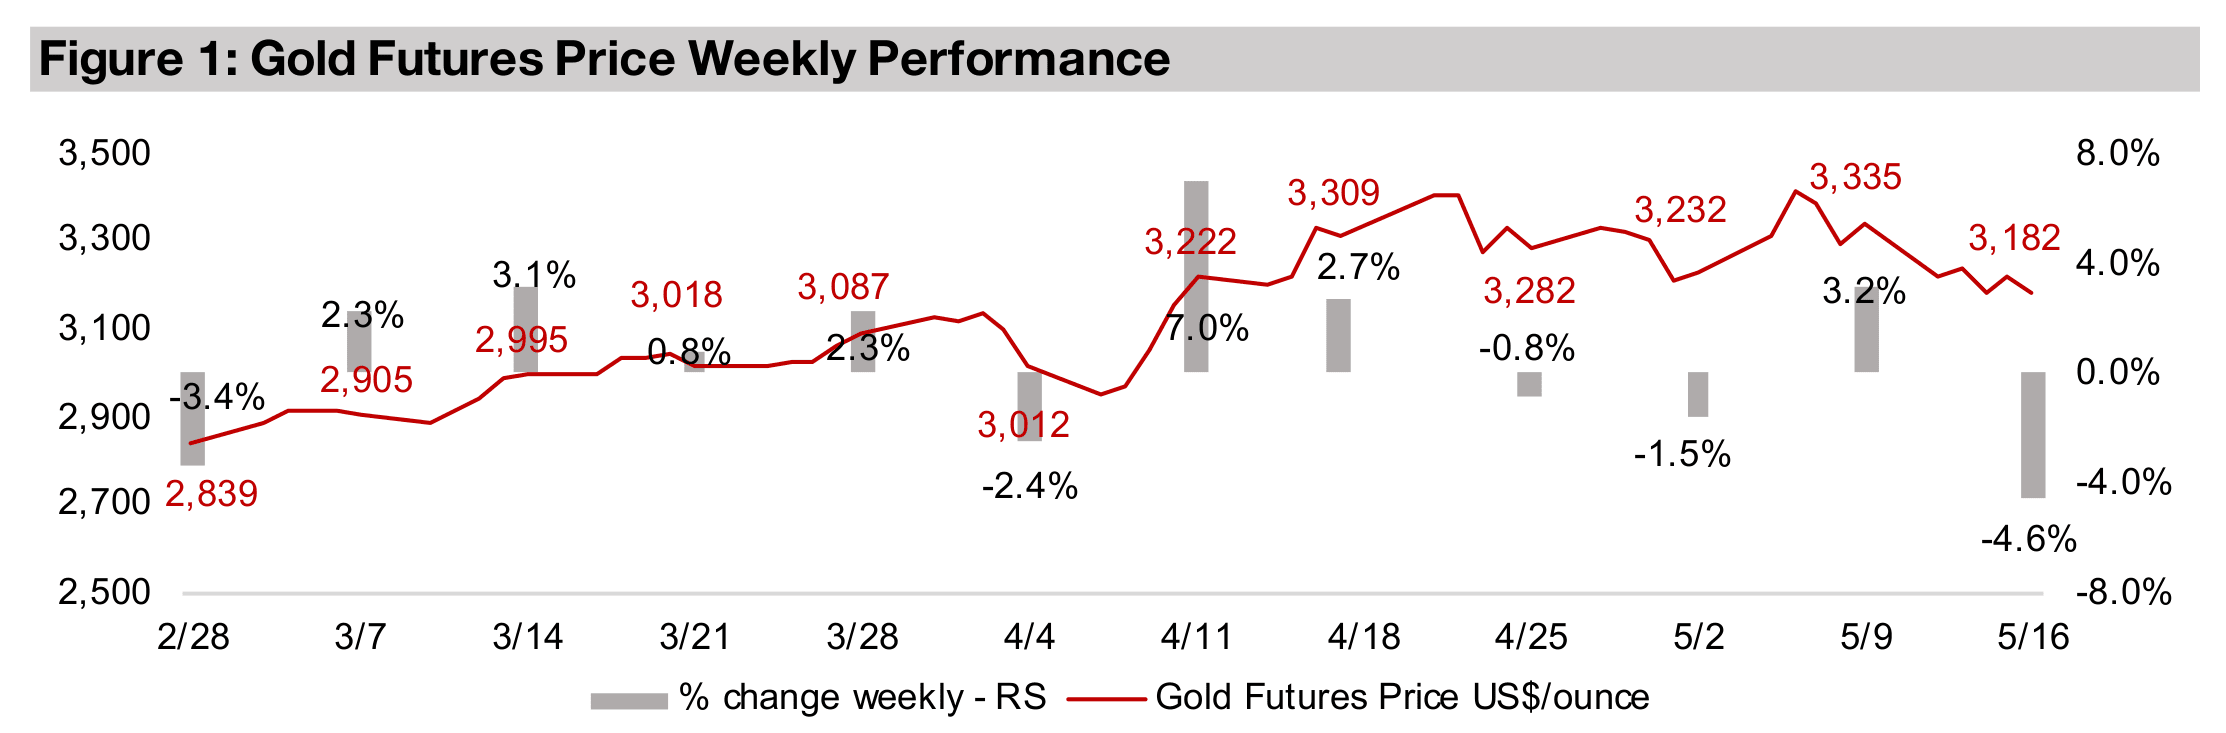
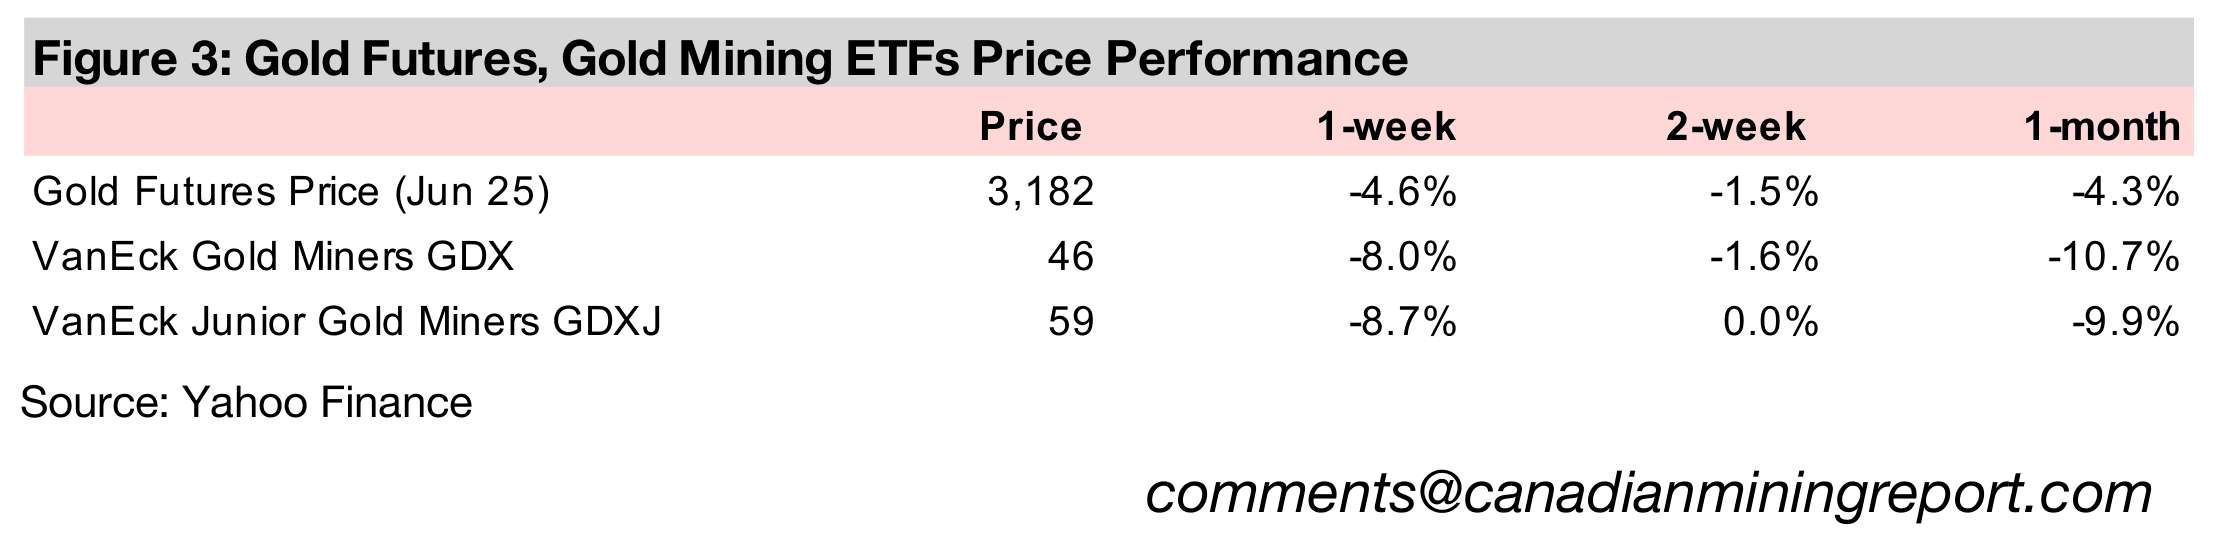
Gold declined -4.6% to US$3,182/oz, just below a trading range around US$3,200/oz
to US$3,400/oz that had held for the past four weeks. This was mainly driven by major
progress on US-China trade relations, but also on news of low US inflation, and a rise
in the US$ and bond yields. The combination of a weak metal price and resumption
of a risk-on move in equities after a pause last week drove down gold stocks, with
the GDX declining -8.0% and GDXJ dropping -8.7% (Figure 4). This significantly
underperformed the 2.6% rise in the S&P 500 and 2.9% gain in the Nasdaq, which
was driven by an 8% gain in US tech.
While other key defensive sectors also underperformed the broader markets, they still
made gains, with global utilities up 2% and global consumer staples rising 1%. The
Russell 2000 was up by only 1.3%, showing the move was concentrated in large caps,
with markets continuing to remain cautious and hedging moves into riskier segments
including small caps, part of an ongoing trend since mid-2024. This is shown by the
YTD performance of the GDX and GDXJ, both up 31% for the year, while US utilities
and consumer staples are up 9% and 8%, compared to a 2% gain for the S&P 500,
flat US tech and a -5% drop for the Russell 2000. Even the 9% YTD gain of China
tech, which had boomed earlier in the year, is just even with utilities.
TSXV Mining has also been a major outperformer, up 16%, especially driven by its
heavy weighting to the gold sector, with copper also a reasonably high proportion of
the index. While lithium had been a major TSXV sector two years ago, causing a major
drag on the index as the price plunged in 2023 and 2024, it has become a much
smaller proportion of the market cap and therefore not had a major effect on the
performance this year. The MSCI Metals & Mining Index has risen only 5% this year,
given a heavy weighted to the weak iron ore sector, although it held up reasonably
well this week, up 3%, as the decline of tariffs on China improved the metal’s outlook.
The most significant economic news this week by far was the announcement of major
progress in the trade negotiations between China and the US, with the countries
agreeing to dramatically reduce tariffs for ninety days. US tariffs on China will decline
from 145% to just 30%, and China’s tariffs on the US will drop from 145% to just
10%. This was taken as a strongly upbeat sign by global markets which at the depths
of the early-April 2025 crash had been pricing in severe potential economic fallout
from such high tariffs between the world’s two largest economies.
US inflation data also likely boosted the markets, although more moderately than the
tariff news. The US CPI rose 2.3% yoy for April 2025, below market expectations for
2.4% and at the lowest level since early 2021. However, core inflation, excluding food
and energy prices, was still 2.8%, flat mom although down substantially yoy. This
measure is believed to weigh more heavily in Fed interest rate decisions than the
headline number, and it has remained stubbornly above the central bank’s 2.0%
target. However, core inflation has come down in 2025, declining from 3.3% in
January, after limited progress for much of H2/24 when it ranged from 3.1% to 3.3%.
The improving trade relations and easing inflation could be expected to improve the
economic outlook dramatically, especially compared to during the early-April 2025
crash. However, global tariffs will be far higher this year, even if not at the previously
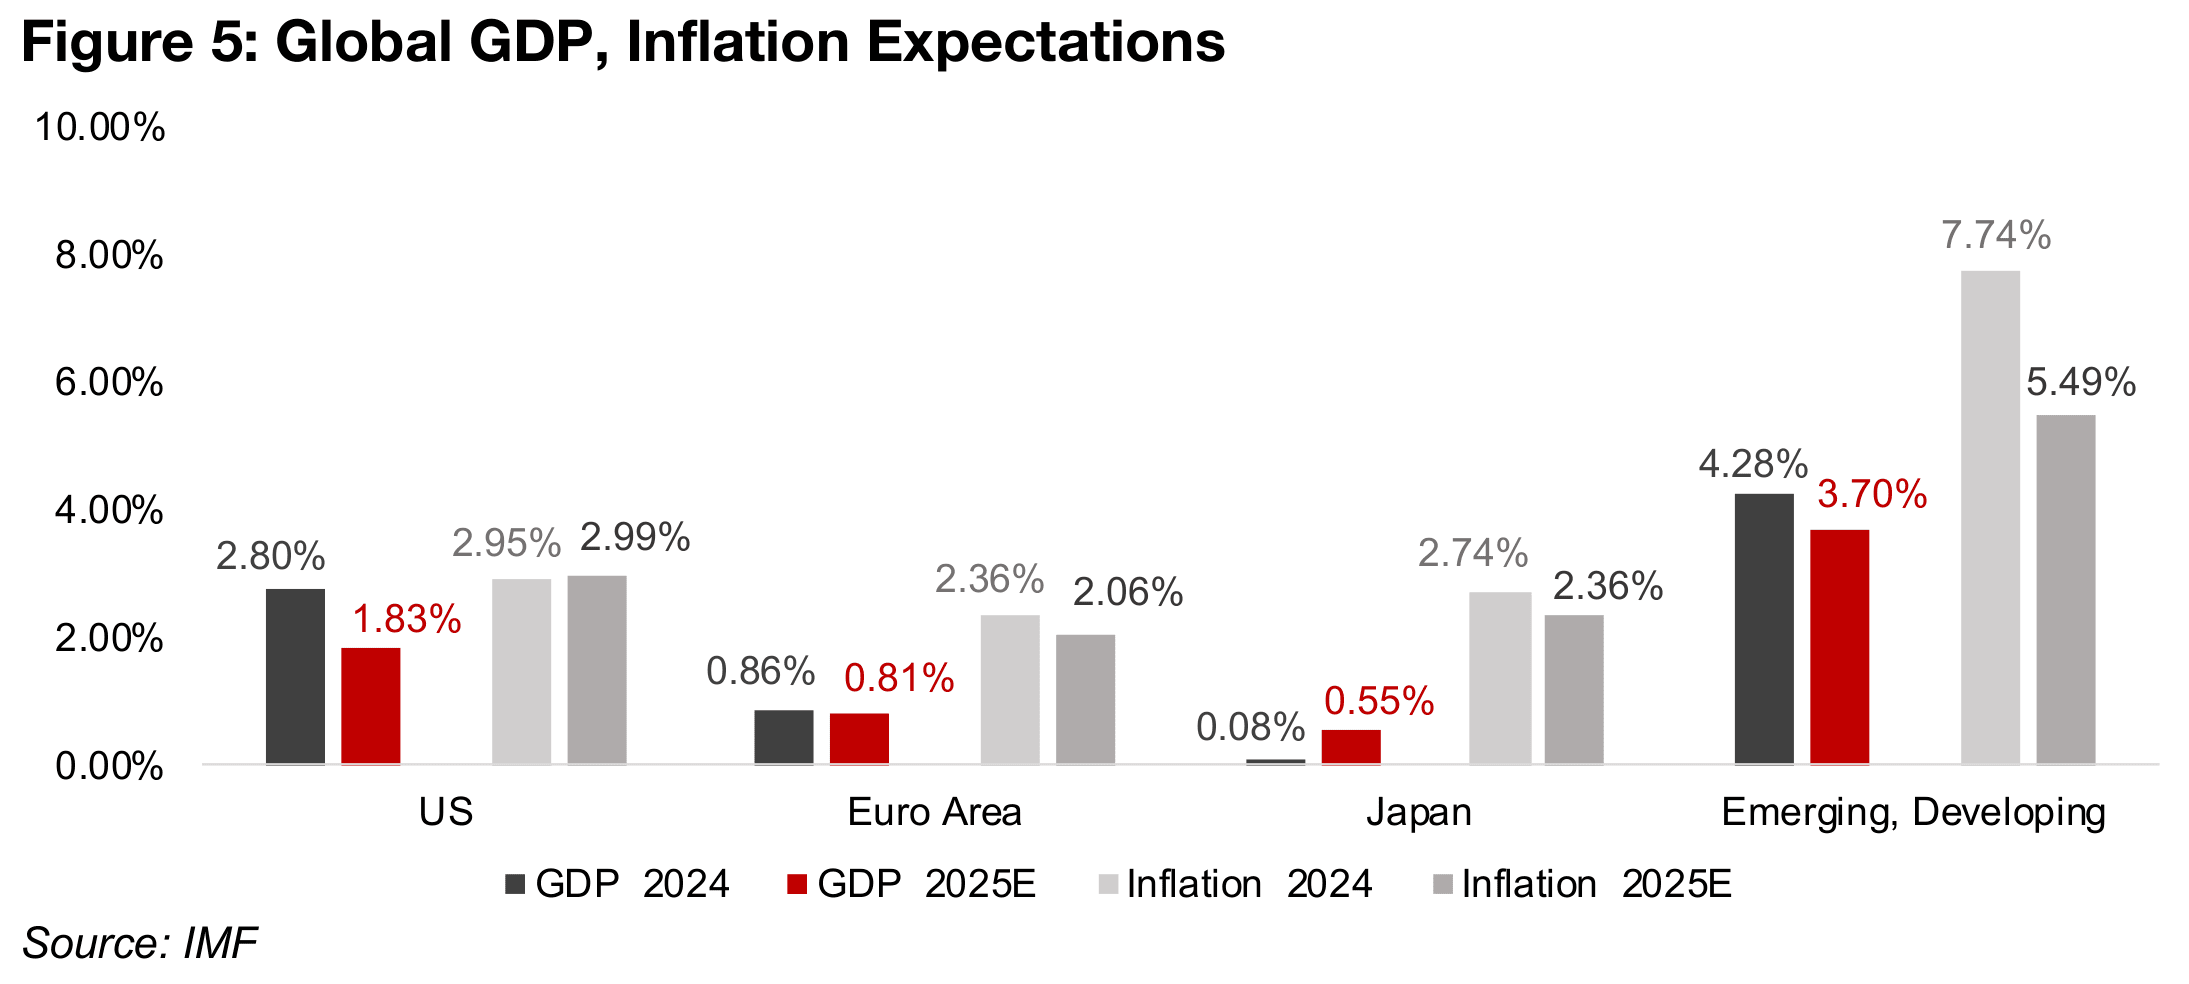
feared extremes, and this could still hit global economic growth. The IMF expects a
decline across the world, with real GDP growth down in the US to 1.83% from 2.80%,
in the Euro Area to 0.81% from 0.86% and in the emerging and developing
economies to 3.70% from 4.28% (Figure 5). While real GDP growth in Japan is
forecast to increase from almost zero growth of 0.08% to 0.55%, this is low versus
the other regions. The country’s weighting in terms of the global economy is also far
offset by the combined other regions where growth is expected to slow.
While the IMF forecasts that inflation will decline for most of the world, it is still
expected to be relatively high, with a decline in the Euro Area to 2.06% in 2025 from
2.36% in 2024, in Japan to 2.36% from 2.74%, with the Emerging and Developing
markets seeing the most major decline to 5.49% from 7.74%. However, inflation is
expected to rise slightly in the US to 2.99% from 2.95%, and combined with its
decline in growth is the most clearly stagflationary scenario.
This data is from the IMF’s April 2025 database, with the timing making it unclear
what level of tariffs are incorporated because they were changing so significantly in
the lead up to the release. The initial US hikes on tariffs for China to 10% occurred in
February 2025 and then were increased to 20% in March 2025. The severe hike in
US tariffs on China to 145% occurred in the second week of April 2025, and
presumably the IMF estimates will be finalized a week or so prior to the release, so
they may not have been included in these estimates.
With the tariffs having returned towards January 2025 levels, if the estimates had not
yet included the severe April 2025 increase, they could still reflect something near the
current rates. We assume that the IMF’s 2025 forecast growth rates would have been
even lower if the peak tariffs of the severe, but brief, escalation of the US-China trade
war were included. That the IMF is forecasting a downturn is actually quite a warning
sign itself, as it typically will forecast an improvement in forward years, except in times
of major crisis, and the data so far has not deteriorated that much. With this tendency
towards upbeat forecasts typical of most institutions, the IMF estimates could not be
considered a major vote of confidence in the economic prospects for 2025.
Over the past month we have outlined how a gold move heading to US$3,500/oz or
above could have proved too much too soon and eventually driven a severe pullback,
which could have damaged the upbeat sentiment for the sector. Therefore, we view
the consolidation over the past month as probably a good development, giving more
time for the market to gain acceptance of the US$3,000/oz as a key benchmark and
not an unsustainable level. With the price averaging US$2,991/oz so far in 2025, it
would only take an average US$3,005/oz for the remaining seven months of the year
for an average US$3,000/oz for the full year.
We had actually been surprised last week that gold didn’t decline more as there was
already rumoured progress on trade before this week’s major announcement, as well
as news of a reduction in geopolitical tensions. There was also a rise in the US$ and
yields, which tend to move inversely to gold. However, we seem to have seen the
combined effects of all these factors, with the addition of the low inflation data, finally
priced in this week, and dragging down the metal price. The question becomes where
gold will now head, especially if the risk-on moves starts to lose momentum and the
markets once again look to hedge more heavily.
We would not rule out another slide into a trading range around the US$3,000/oz level,
with dips a few hundred dollars below or above this level. There have been signs that
gold was getting fundamentally overvalued over the past few months, with its ratios
versus key commodities including silver, copper, oil and the CRB index surging far
above the average since 2021, with some even reaching all-time highs. This indicates
that either these assets would have to rise or gold fall to bring the ratios back to a
more reasonable balance. If these other assets remain low under pressure from
sluggish industrial demand, it may cause a further decline in gold.
However, it could be argued that the historically extreme divergence between gold
and both silver and copper simply reflects the market’s outlook on the fundamentals.
The current surge in gold signals primarily the market’s expectation for a major
expansion of the monetary base, with this being the main long-term driver of the metal.
The underperformance of copper, which is mainly driven by industrial factors, implies
expectations of low economic growth. This is turn implies stagflation, which matches
the estimates IMF 2025 estimates outlined above.
A sudden surge in interest in gold by the retail market, with sector ETF inflows at all-
time highs, investment banks forecasts ahead of the actual price for the first time in
years, and a pullback by central banks on purchases, also seems to be warning signs
of a bubble. However, there appears to be enough ongoing monetary expansion and
elevated economic and geopolitical to avoid a major plunge. The scenario that would
imply a severe gold downturn would be a return to the mid-2010s situation of zero
interest rates, extremely low inflation combined with strong economic growth. While
this crushed gold through most of the 2010s, it seems very unlikely currently.
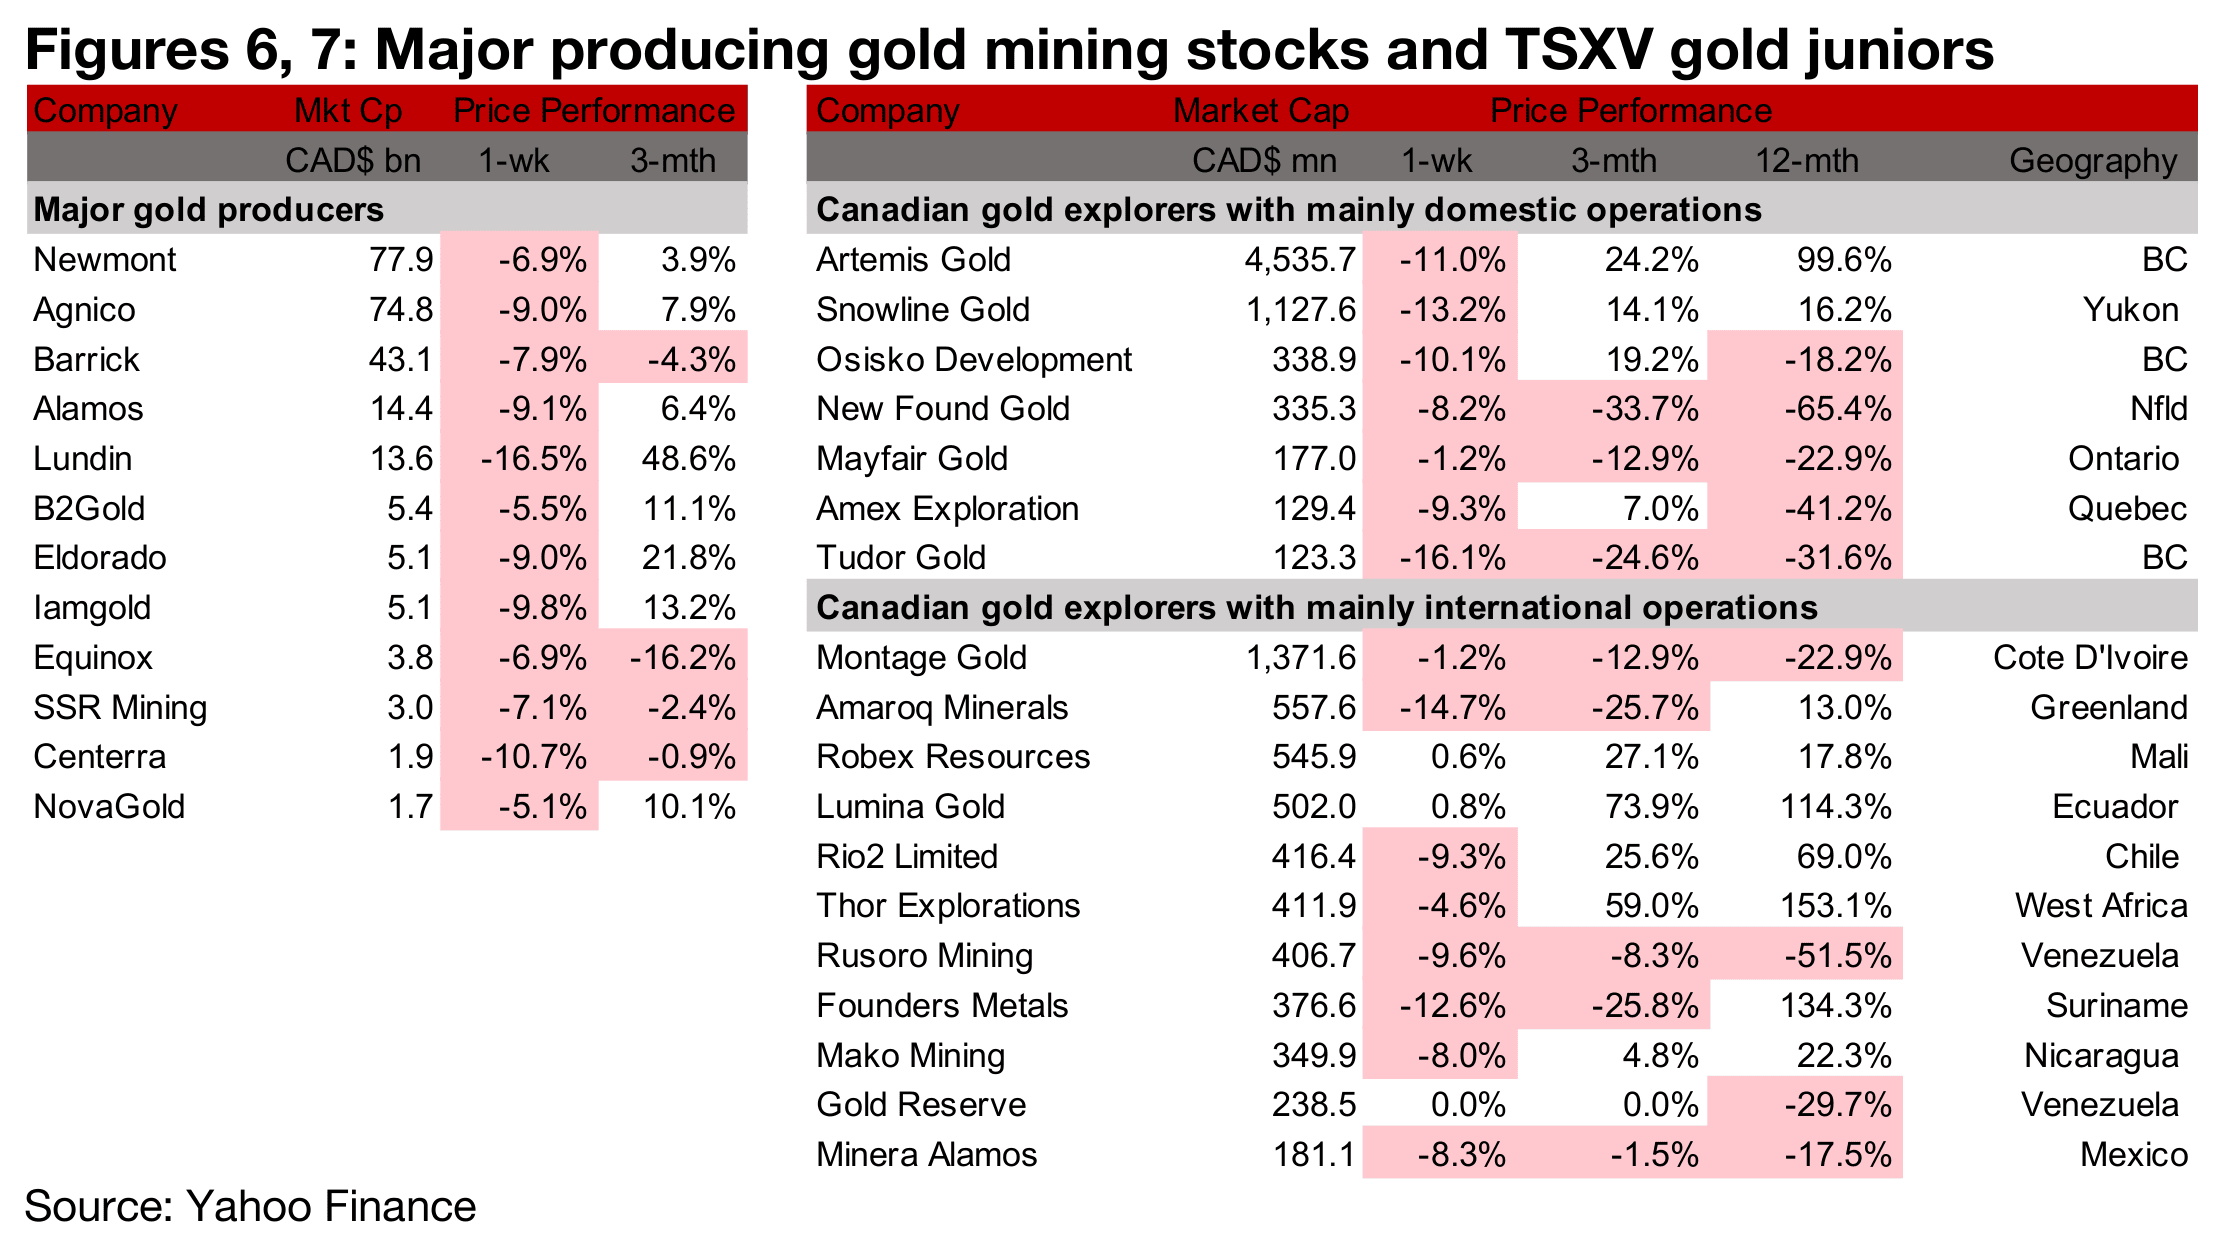
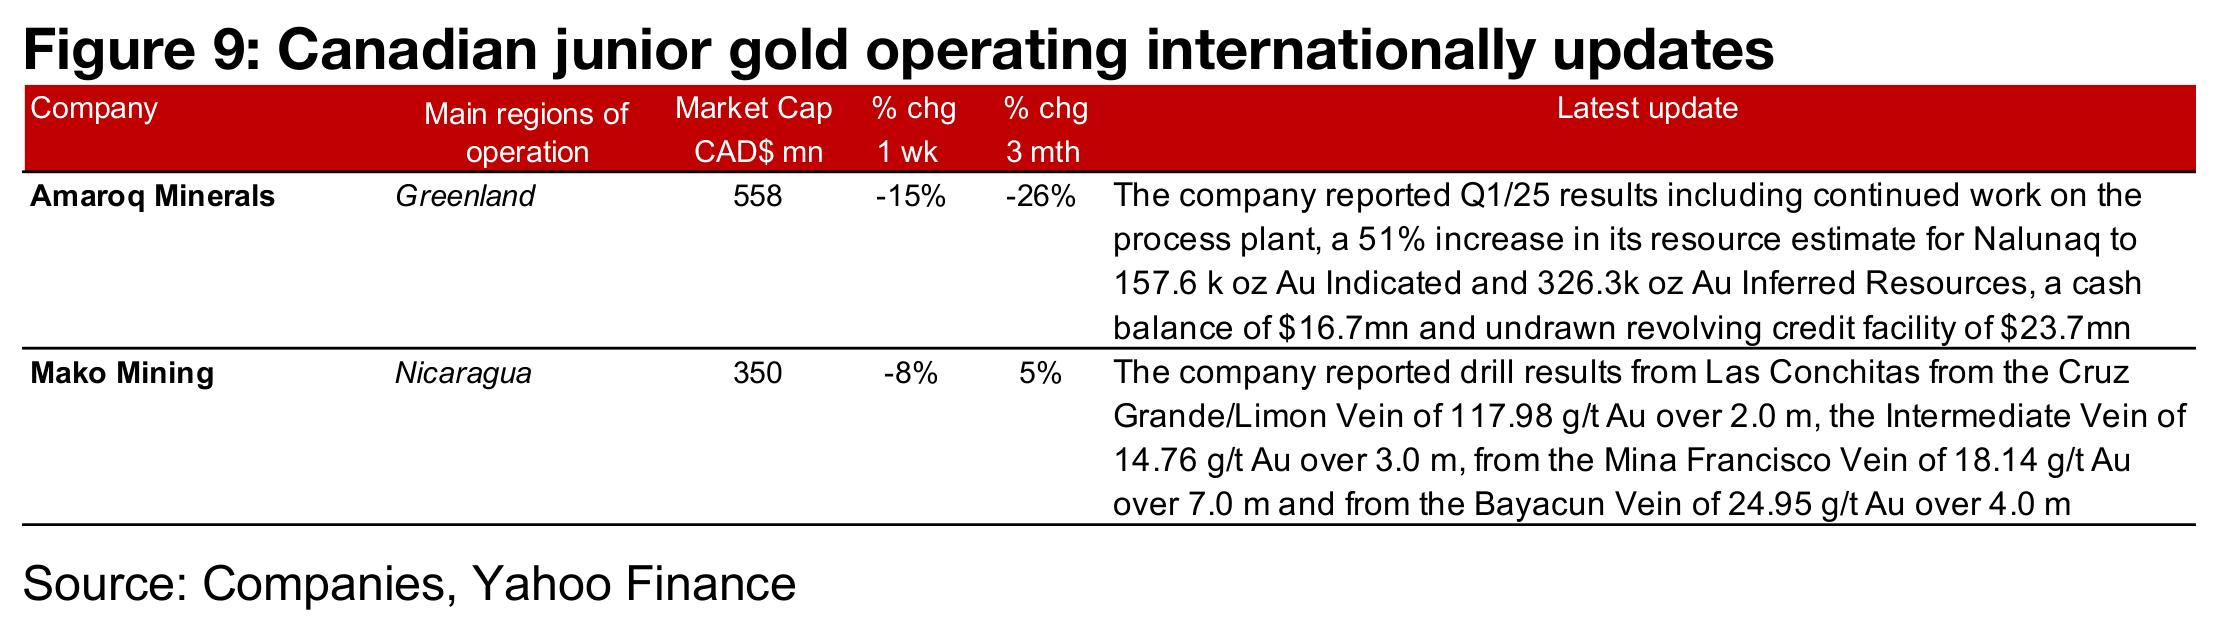
All the major producers and most of the large TSXV were down on the decline in metal price (Figures 6, 7) For the TSXV gold companies operating mainly domestically, Snowline Gold reported an increase in the Rogue mineral resource estimate and Tudor Gold upsized its private placement (Figure 8). For the TSXV gold companies operating mainly internationally, Amaroq reported Q1/25 results and Mako announced drill results from Las Conchitas (Figure 9).
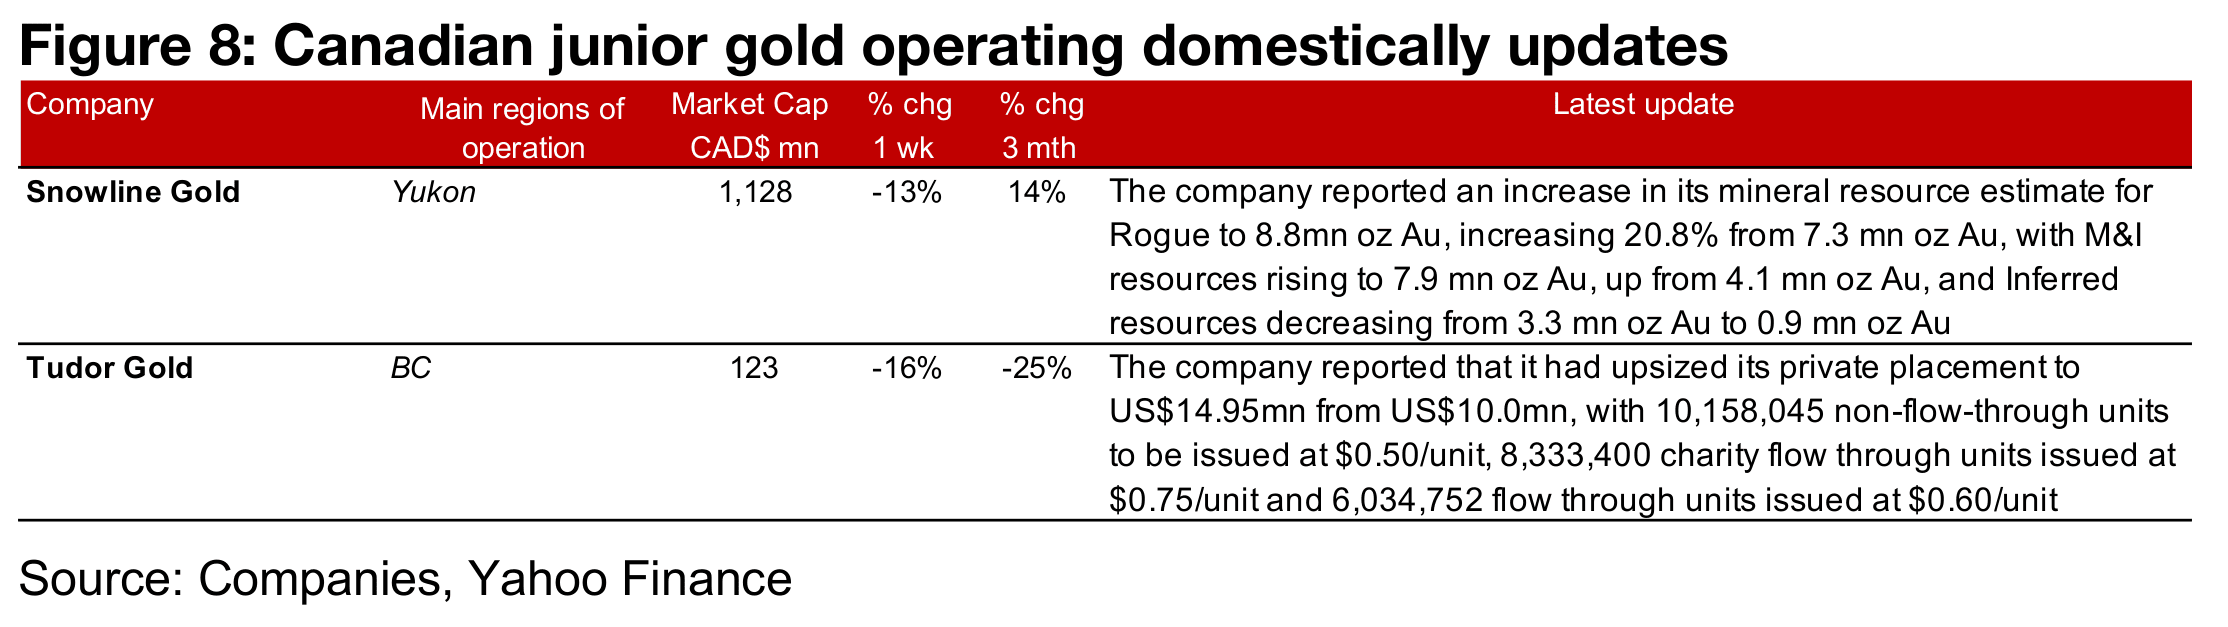
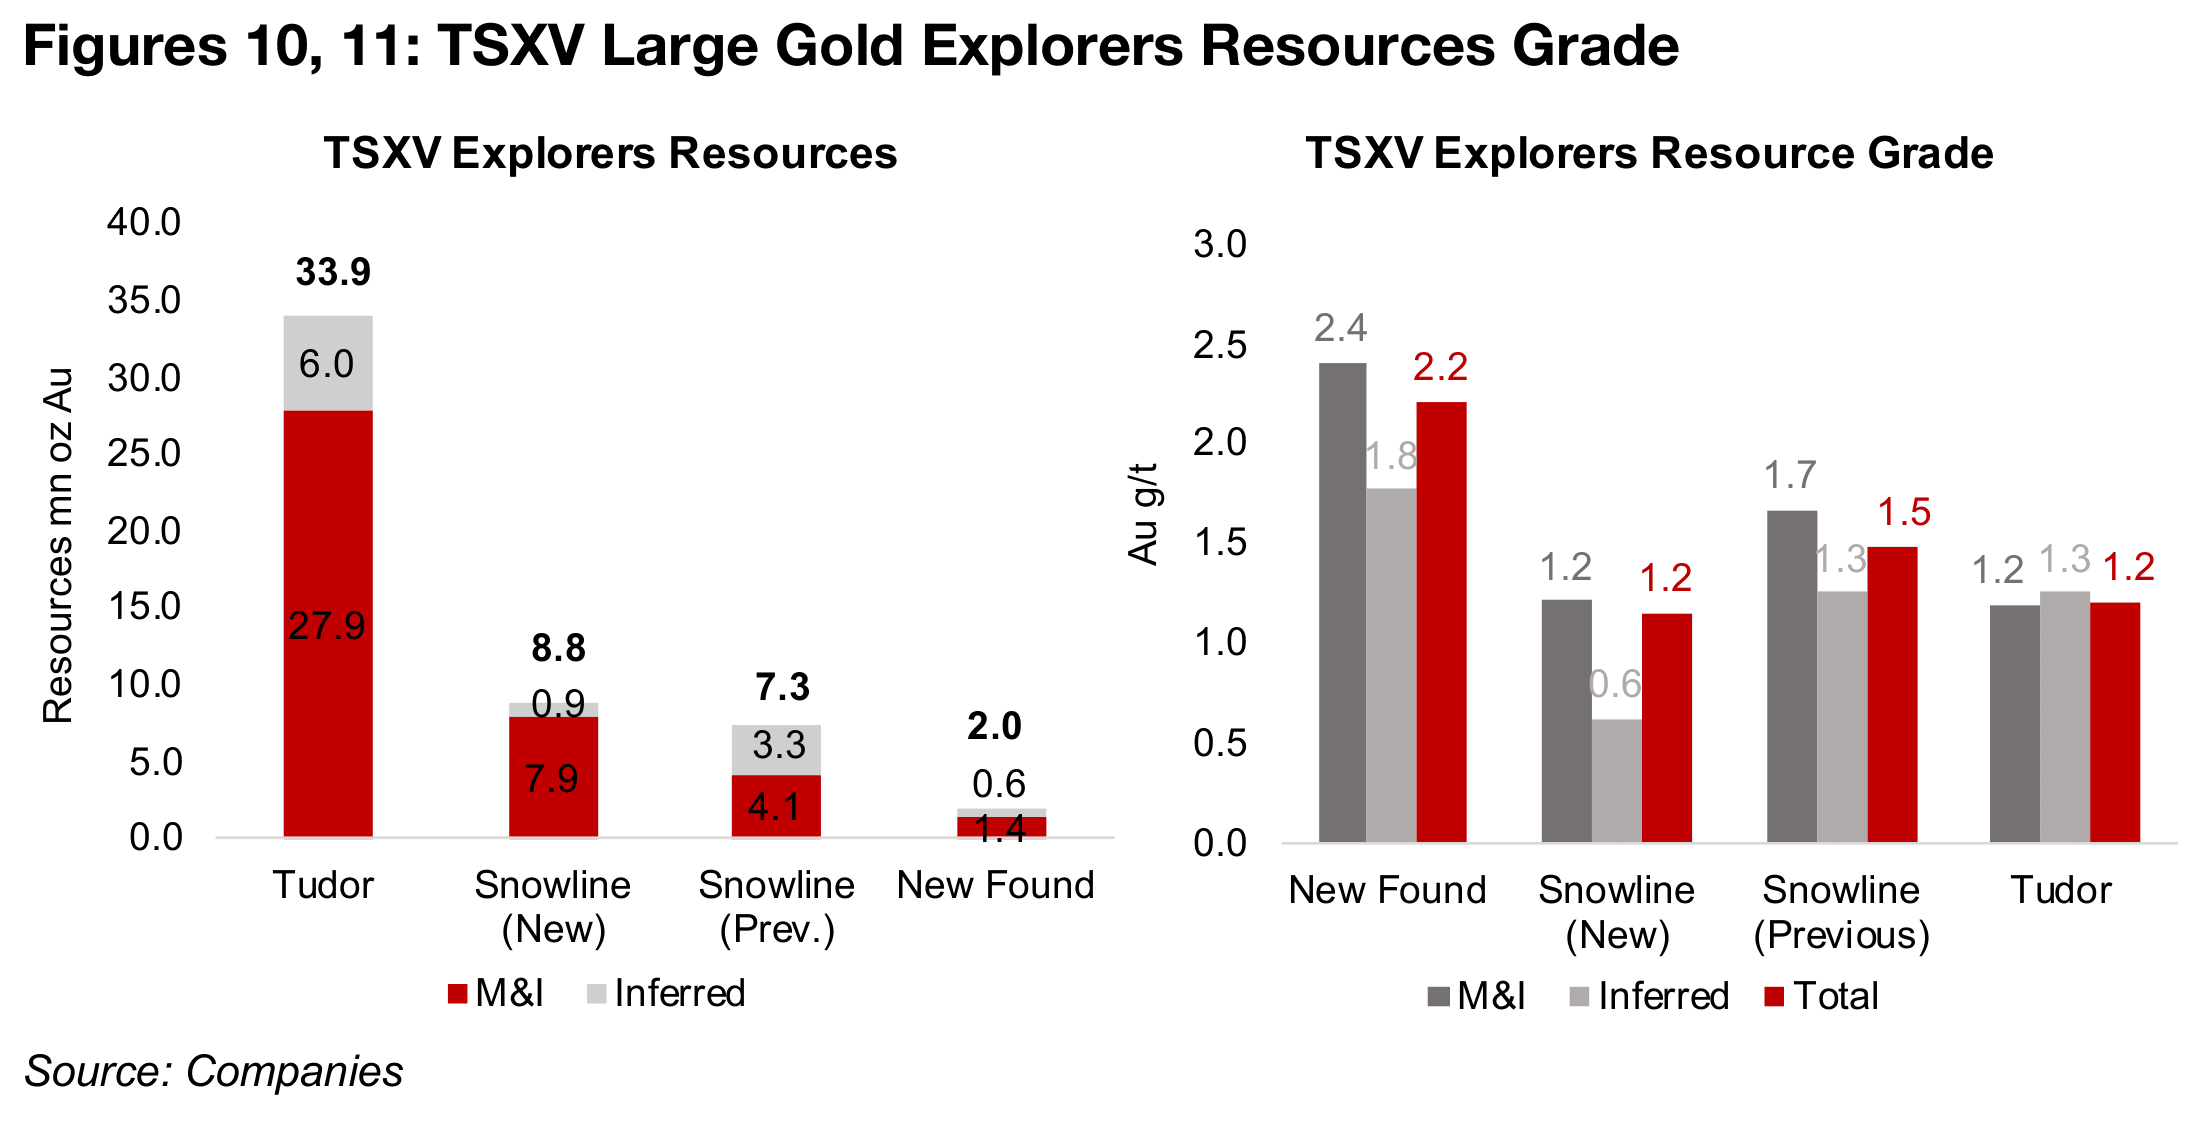
Snowline Gold’s upgraded resource estimate for its Rogue project in the Yukon saw
a 21% increase in the total resources to 8.8 mn oz Au from the previous estimate of
7.3 mn oz Au (Figure 10). There has been a significant improvement in the quality of
the resource, with an upgrade in the Indicated Resource to 7.9 mn oz Au from 4.1 mn
oz Au, while the Inferred Resources declined from 3.3 mn oz Au to 0.9 mn oz Au. The
overall grade declined, however, to just 1.2 g/t Au from 1.5 g/t Au, with the M&I
resource grade declining to 1.2x g/t Au from 1.7x g/t Au, and the Inferred grade
declining to 0.6 g/t Au from 1.3 g/t Au (Figure 11).
For the three larger TSXV explorers, Snowline’s resource size lies between Tudor
Gold’s large 33.9 mn oz Au Resource Estimate for Treaty Creek in British Columbia
and New Found Gold’s 2.0 mn oz Au Resource for Queensway in Newfoundland.
New Found Gold’s project has higher grade than Snowline, at 2.2 g/t Au, with Tudor
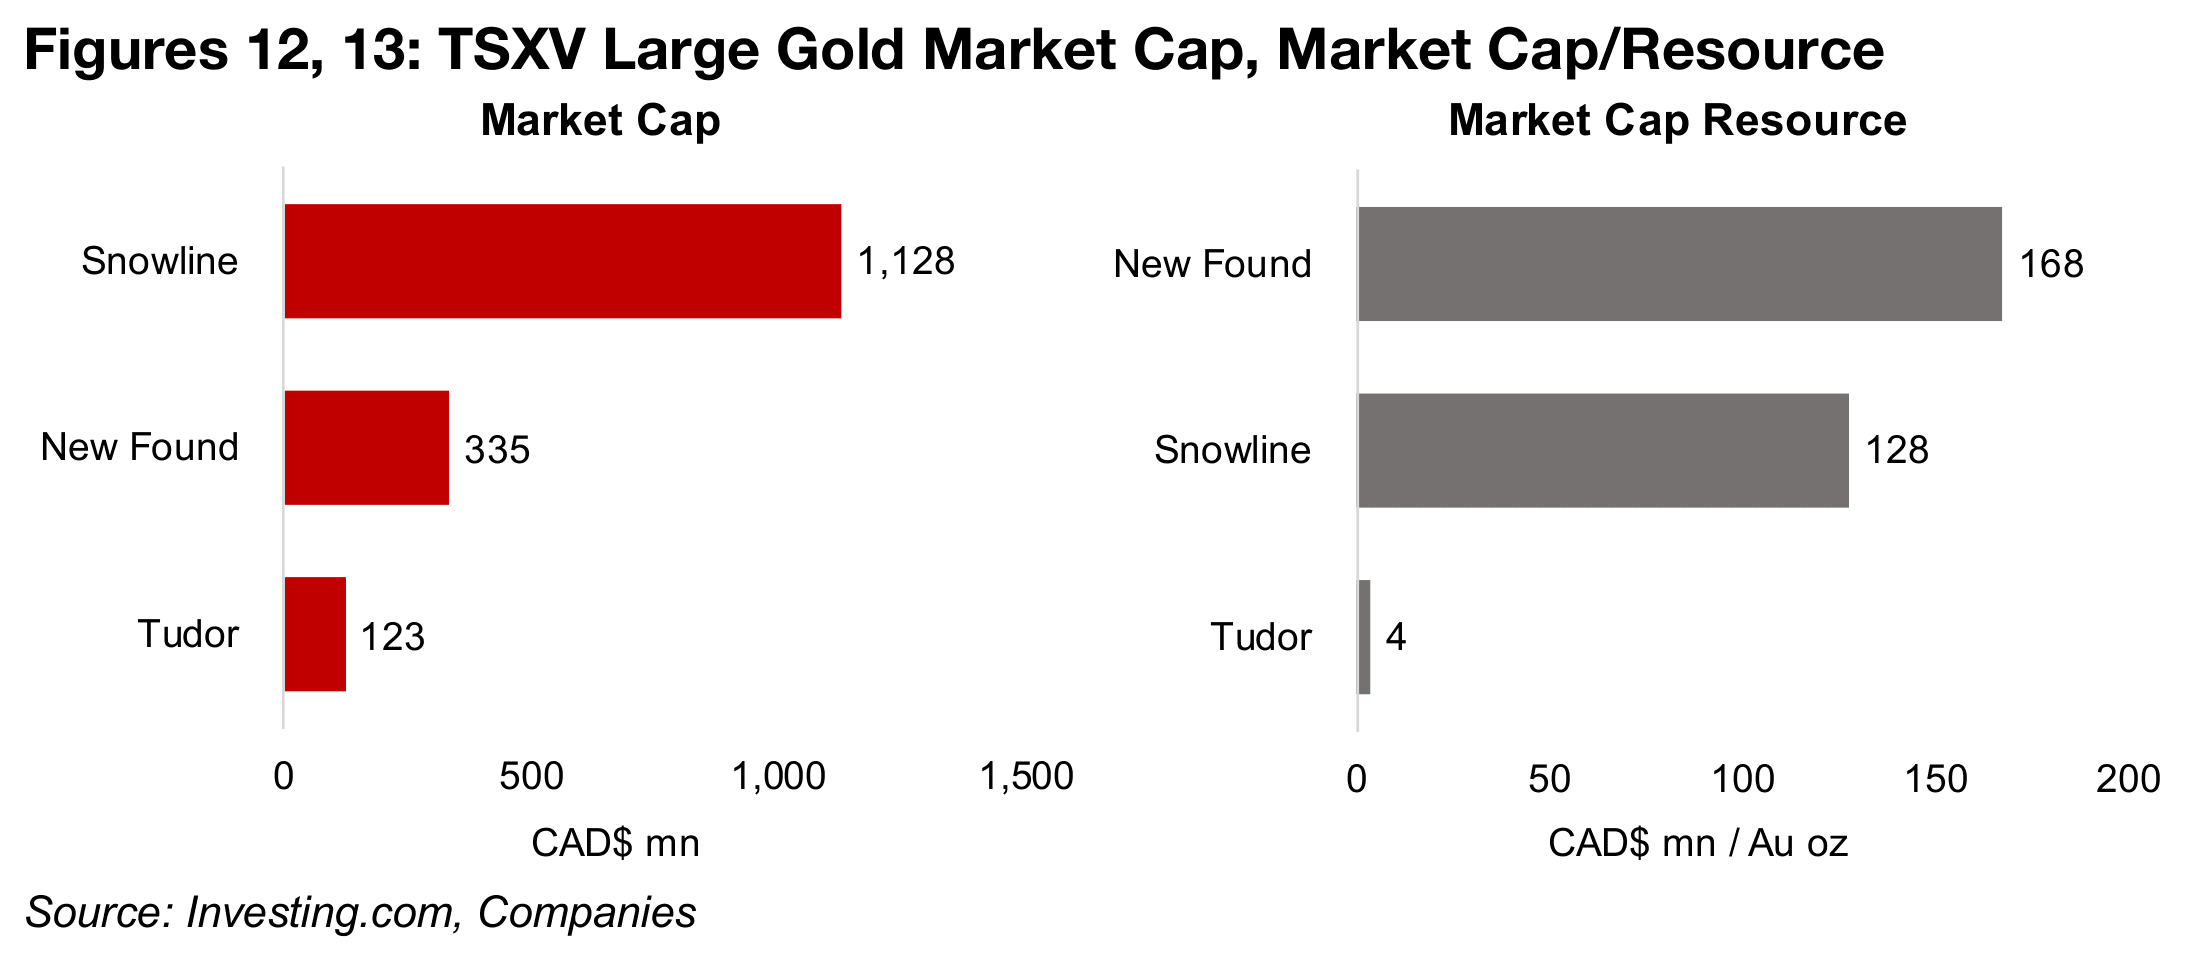
slightly lower, at 1.2 g/t oz Au. With the far larger resource the market is affording
Snowline the higher market cap of the three by far, at CAD$1,128mn, compared to
New Found Gold at CAD$335mn (Figure 12).
However, New Found Gold’s market cap to resources is higher at CAD$168/oz than
Snowline Gold, at CAD$128/oz (Figure 13). This could partly be accounted for by the
former’s higher grade, but also could imply market expectations for a lower cost per
ounce than for Snowline Gold, with potentially a more difficult and higher cost
operating environment in the Yukon versus Newfoundland. Tudor has a tiny market
cap to resource compared to the other two projects, which could not be accounted
for only by the lower grade. It shows that the market is still weighting a very low
probability that the entire reported resource can be extracted economically.
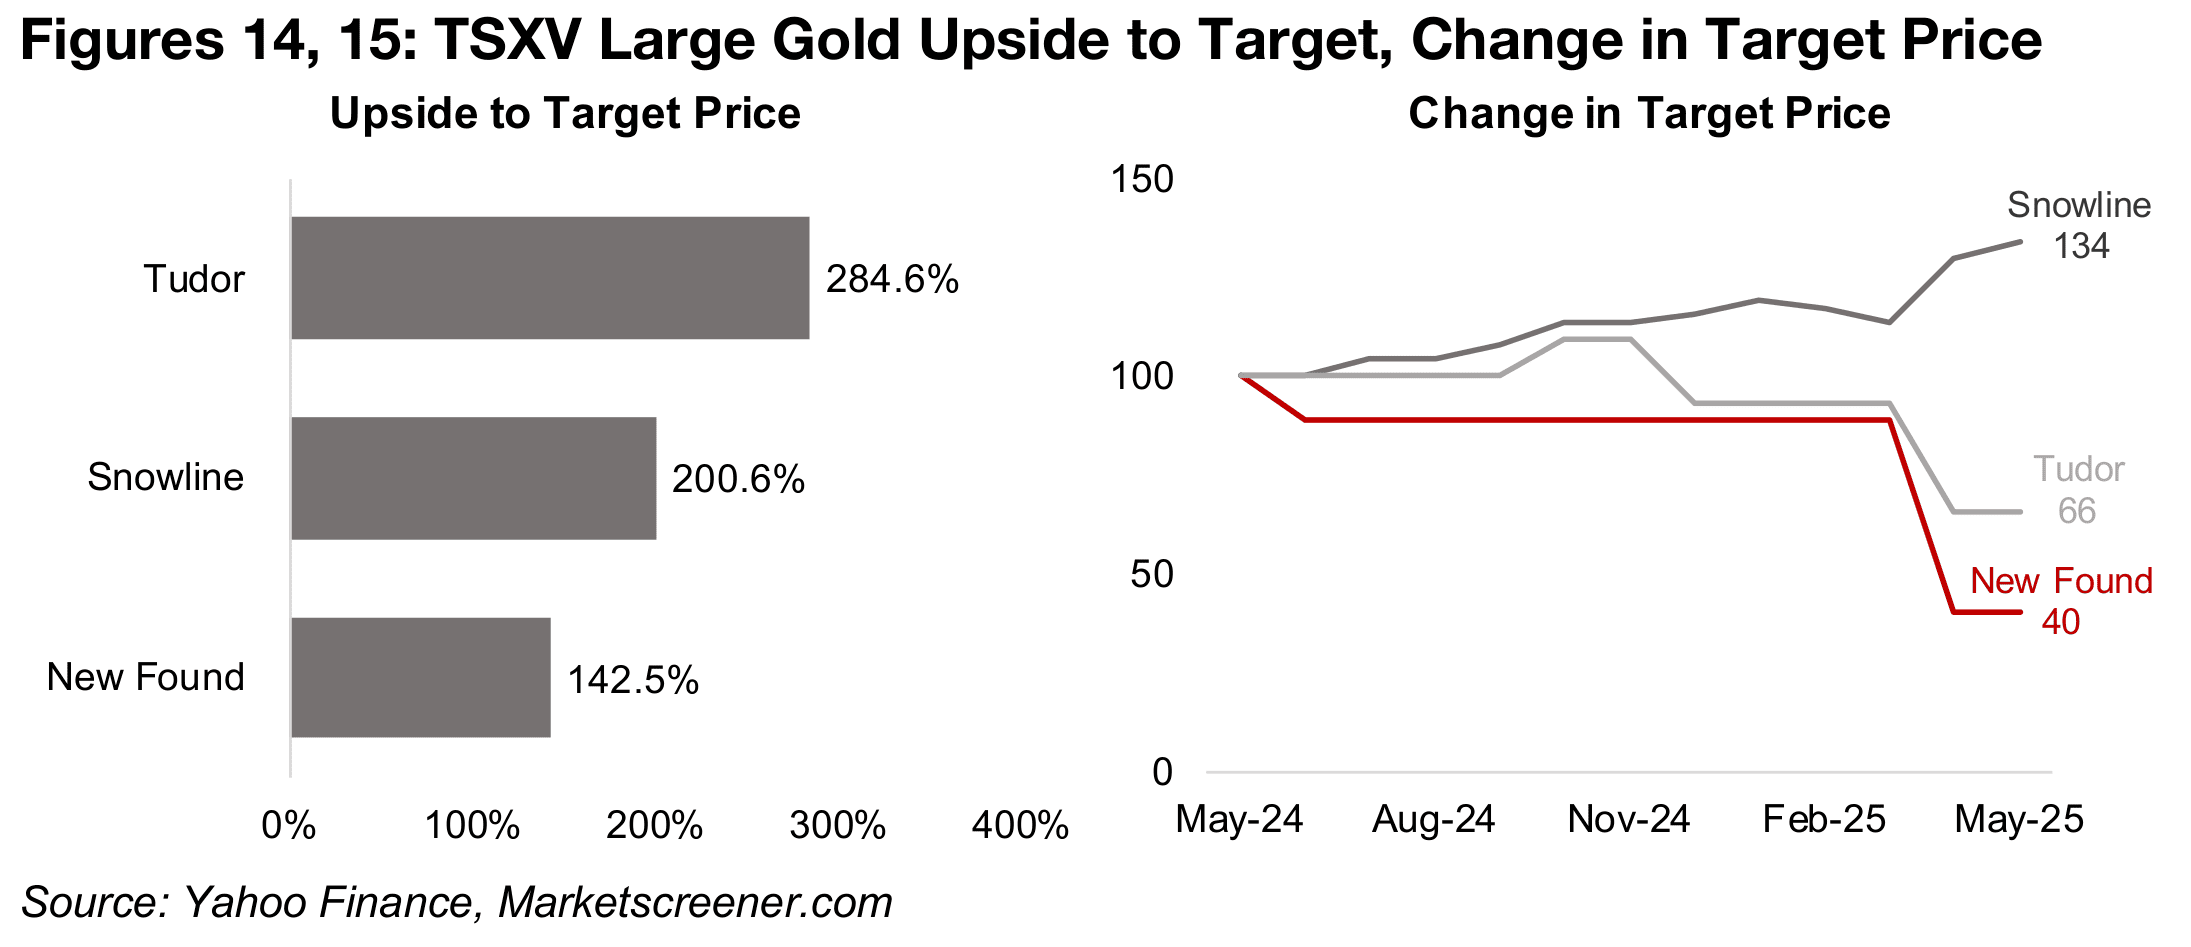
The consensus target prices still show major upside for all three stocks, with an
especially strong 285% upside for Tudor Gold, 200% for Snowline Gold and 143%
for New Found Gold (Figure 14). This comes after a 34% increase in Snowline Gold’s
target over the past year, with part of this likely having come from anticipation of the
resource upgrade. Tudor Gold’s target price is down -34% and New Found Gold’s
target has slumped -60% over the past twelve months, with most of the decline
happening after the release of its resource estimate for Queensway (Figure 15).
This also has dragged down the share price, with New Found Gold down -65.4%
over the past twelve months, continuing a decline in the market cap from a peak
around US$1.0bn a few years ago. Snowline is still up 16.2% for the past year, on
the initial resource estimate announcement last year, continued strong drill results,
and the recent upgrade of the resource. Both companies could see some overall
pressure on their share prices from the broader rise in the risk aversion over the past
year, apart from company specific developments.
The strong gold price alone has clearly not been enough alone to support the share
prices, as shown by the decline in New Found Gold, as these companies shift from
the early stage of exploration and into development. There will be an extended period
before these companies reach the production stage, and they will need to continue
to raise major financing to develop their projects even as capital raising conditions
may become more difficult.
Disclaimer: This report is for informational use only and should not be used an alternative to the financial and legal advice of a qualified professional in business planning and investment. We do not represent that forecasts in this report will lead to a specific outcome or result, and are not liable in the event of any business action taken in whole or in part as a result of the contents of this report.
Author
Ben McGregor authors the Weekly Roundup at CanadianMiningReport.com, providing sharp analysis of the metals and mining sector. With a talent for spotting trends, Ben distills complex market shifts into clear, engaging insights on TSXV junior miners. His weekly updates cover gold, copper, uranium, and more, blending data-driven perspectives with a knack for identifying opportunities. A vital resource for investors, Ben’s work navigates the dynamic junior mining landscape with precision.