
June 19, 2020
The gold price edged down -0.2% this week, and continued to trade around the middle of its range over the past two and half months. Looking at the gold price in a longer historical context, this week we compare gold to the monetary base.
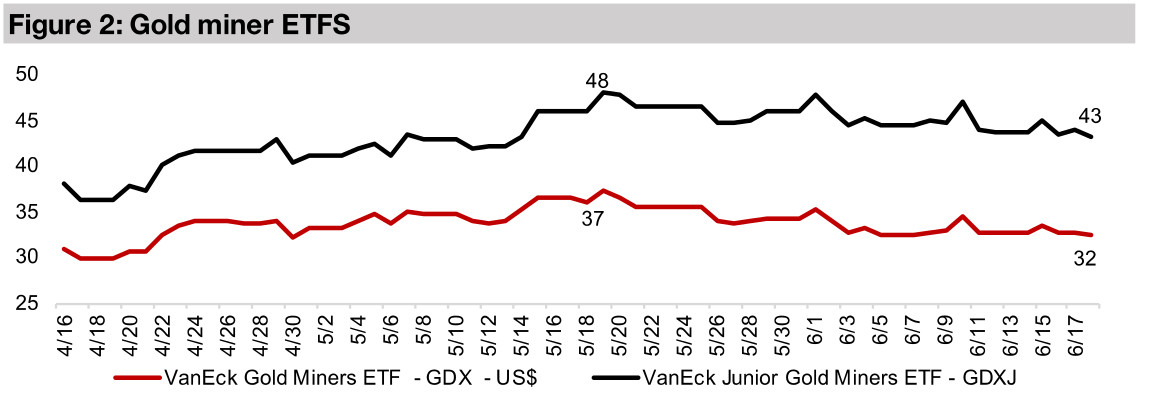
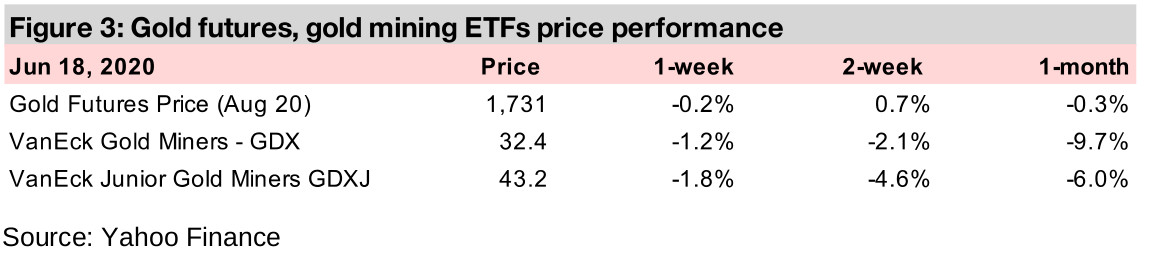
The producing miners mainly declined this week, but most by only low single digits, and the GDX was down -1.2%, as risks remain elevated, but in a holding pattern, and the gold price remained nearly flat.
While big macro trends drove the juniors from March to May, company specific news has been key in June; Novo Resources, for example, In Focus this week, has seen strong gains versus the group after reporting the expansion of its exploration territory.


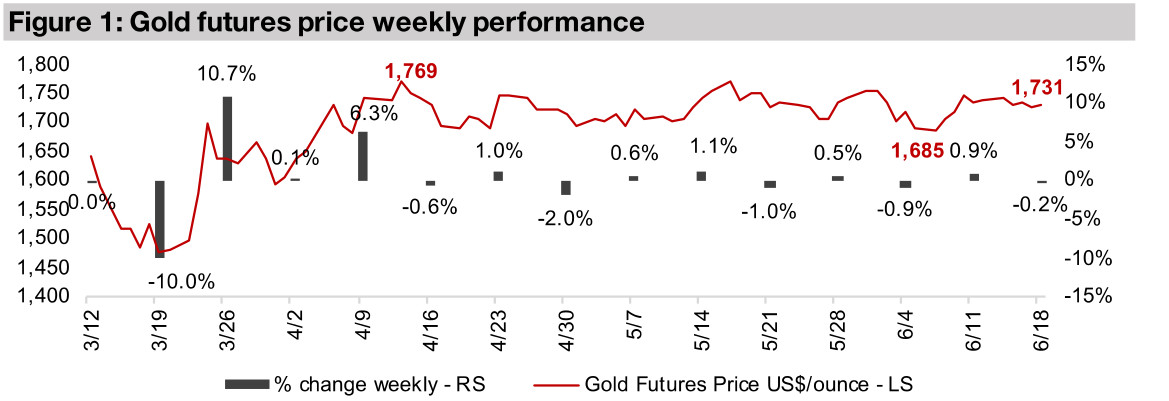
Gold edged down just -0.2% this week, marking ten weeks in a row of moves of 2.0% or less, a period of considerable stability compared to the extreme volatility of March 2020, which saw moves of 10% in a single week both up and down (Figure 1). Gold averaged US$1,733/ounce this week, and closed at US$1,731, both of which are near the middle of its ten week range, which saw a low of US$1,685/ounce and a high of US$1,769. With the dual factors of continued risks from the global health crisis and a continued major ongoing monetary expansion from the US Fed unlikely to dissipate soon, gold is likely to hold in the current range. Gold has seen strong recent downside resistance at US$1,700, a level where the potential margins make junior mining exploration activity considerably more attractive in 2020 than last year at this time, when the average gold price had been just US$1,305 over H1/19.
While the current high risks are likely to support gold in the short-term, there are also some metrics that point to potential longer-term strength for gold. One such metric is comparing the monetary base to gold. This has strong historical roots, as there were long periods where paper currency was directly linked to the gold base. While this direct connection has not been official since the 1970s, as gold still remains an important form of currency held by central banks, the level of paper money as a multiple of gold gives us some idea of the relative value of the two.
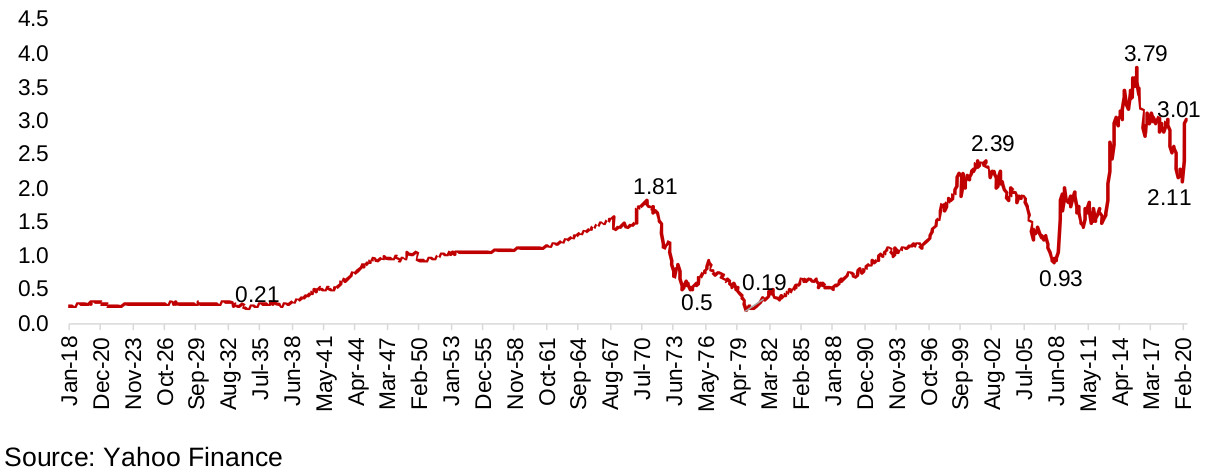
One series reported by the US Federal Reserve has over a 100 year history, the price of gold to the narrowest monetary base of Federal reserve money, in contrast to broader measures such as M2. If we take the reciprocal of this series, as shown in Figure 4, or the monetary base to the gold price, the higher the series, the more the money supply has expanded versus gold. In a historical context, this ratio ranges from 0.21x to 3.79x (Figure 4). The lowest level in recent years was in 2008 prior to the financial crisis, at 0.93x, and it subsequently rose with the massive monetary expansion to 3.79x in 2015, before global central banks began to ease off liquidity. The ratio dropped to 2.11x just prior to the March 2020 crash, as the liquidity contracted and the gold price rose. The ratio spiked again in recent months, even as the gold price jumped, as another large monetary expansion started. Overall, in historical terms, this ratio remains high, and points to the potential for gold to move higher to bring this ratio more back in line with long-term averages.
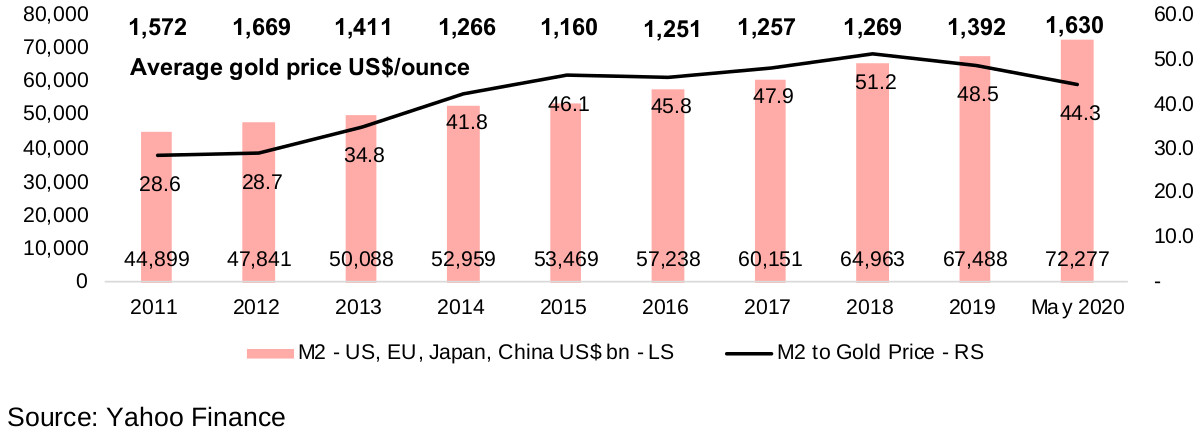
One issue with using only the US monetary base, while it is a valuable series because of its long history, is that is does not reflect the much broader global monetary base of the present, for which the main currencies are not only in the US, but also Europe, Japan and China. We can also expand the measure of money to a broader money of M2 for each country, and look at a ratio of this to the gold price. This ratio has also expanded considerably over the past ten years, from 28.6x in 2010 to a peak of 51.2x in 2018, before a pick up in the gold price reduced the ratio (Figure 5). We haven't seen the spike in the combined M2 that we saw in the US narrow monetary base mainly because while US M2 grew 18% since the end of 2018, the EU, Japan and China have increased M2 by only 3.1%, 4.5% and 3.9%, respectively. If economic issues from the current crisis persist, we could see these other regions/nations expand liquidity and we could see this ratio rise further, potentially boosting the value of gold versus paper money.
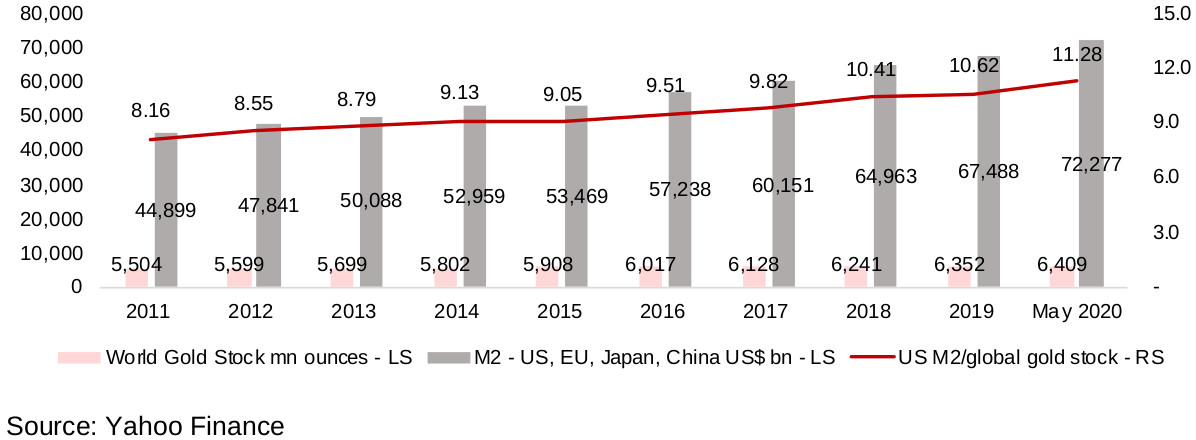
We can also take the same M2 ratio versus not only the gold price, but also the physical gold stock in ounces. This ratio has increased from 8.16x in 2011 to 11.28x in May 2020 (Figure 6), as the physical gold stock has grown at a rate below 2.0% per year.
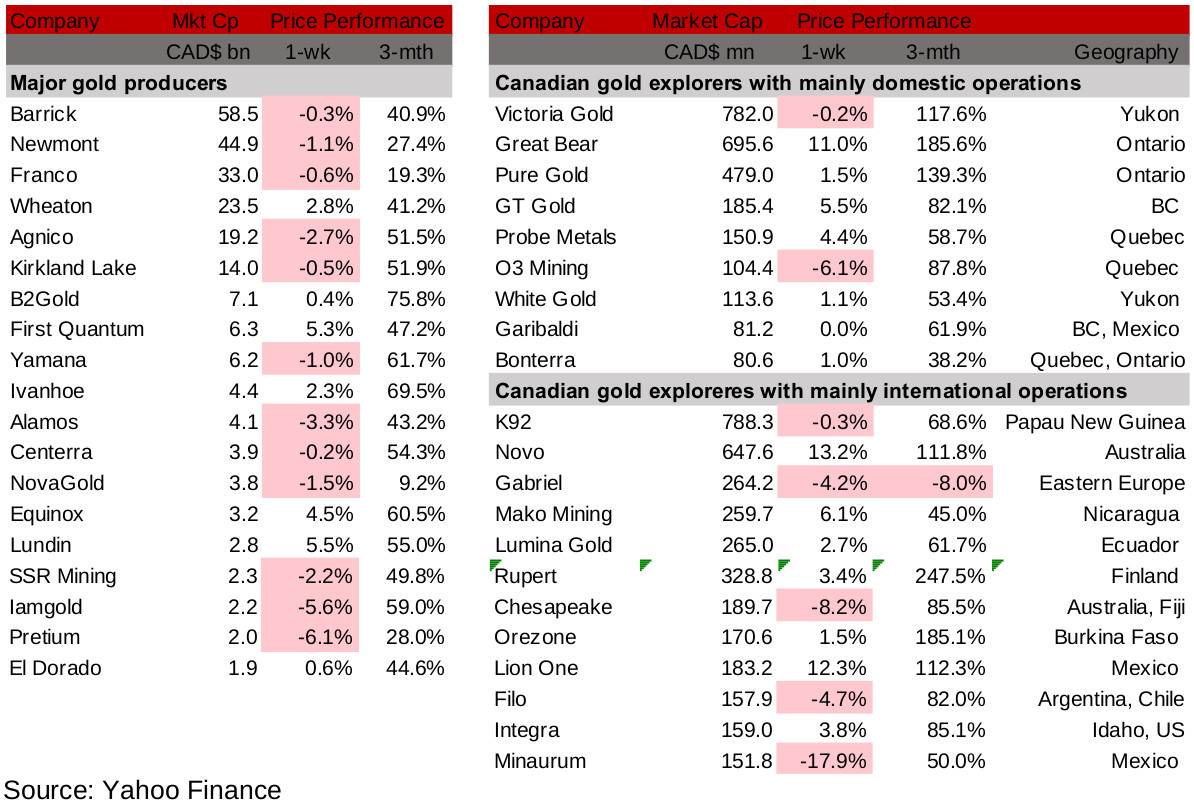
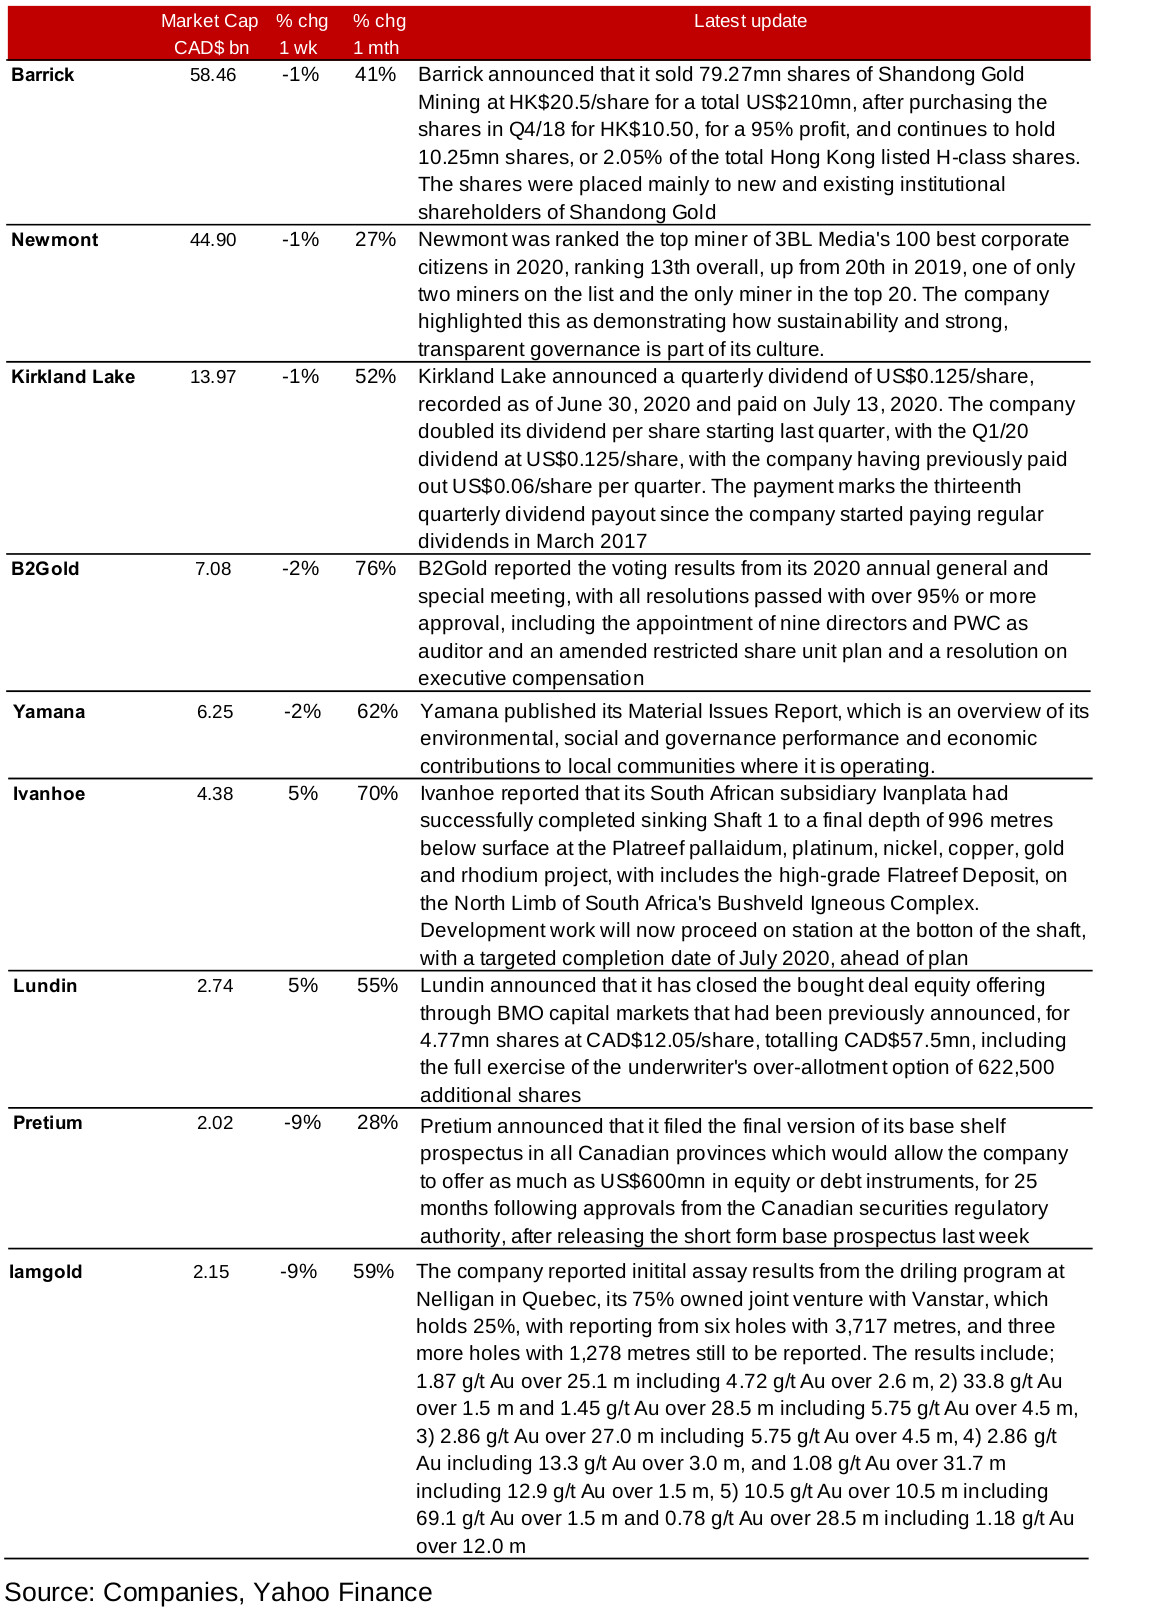
Most of the producing miners were down this week, but mainly by low single digits (Figure 7). Company specific news flow for the large cap mining names was relatively benign, with Barrick selling part of its stake in Shandong Gold, Newmont ranked high for corporate governance and responsibility by 3BL Media's in its top 100 survey for 2020, Kirkland Lake announcing an expected dividend payout, B2Gold reporting the voting results of its AGM and Yamana publishing its environmental, social and governance report. There was material news flow from Ivanhoe, which successfully completing sinking a mine, and Iamgold, which released initial assay results from its drilling program at Nelligan in Quebec. News flow for other mid-cap producing miners was relatively light, with Lundin closing a bought deal equity offering, and Pretium filing the final version of its base shelf prospectus, both of which were follow ups on previous announcements (Figure 9).
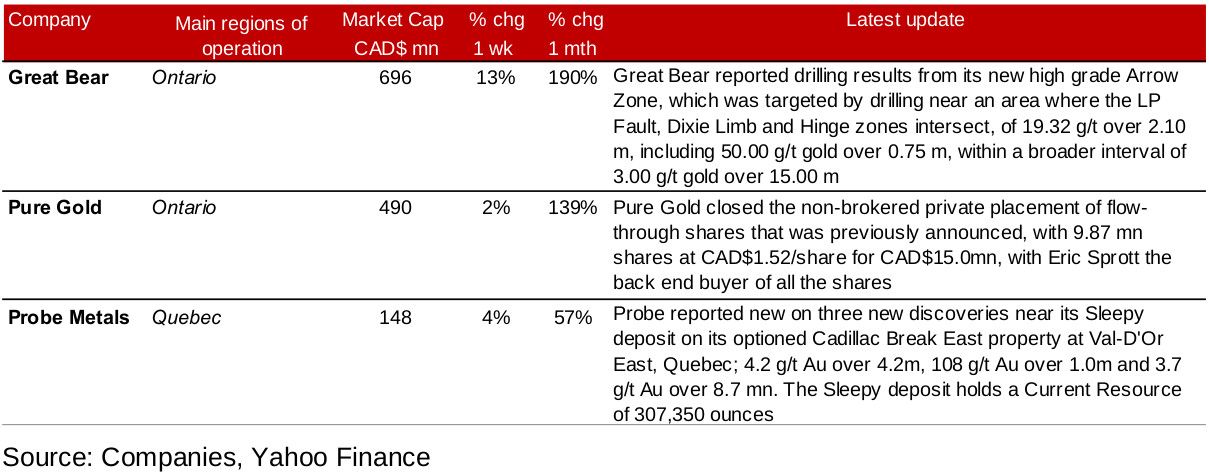
The Canadian operating junior gold mining stocks mostly saw gains this week (Figure 8) but only three companies of the group had news releases, with Great Bear seeing the strongest performance of the group driven by news flow of another set of positive drilling results in a continued recent series (Figure 10). Pure Gold saw a small gain after closing a previously announced non-brokered private placement and Probe edged up after reporting three new discoveries.
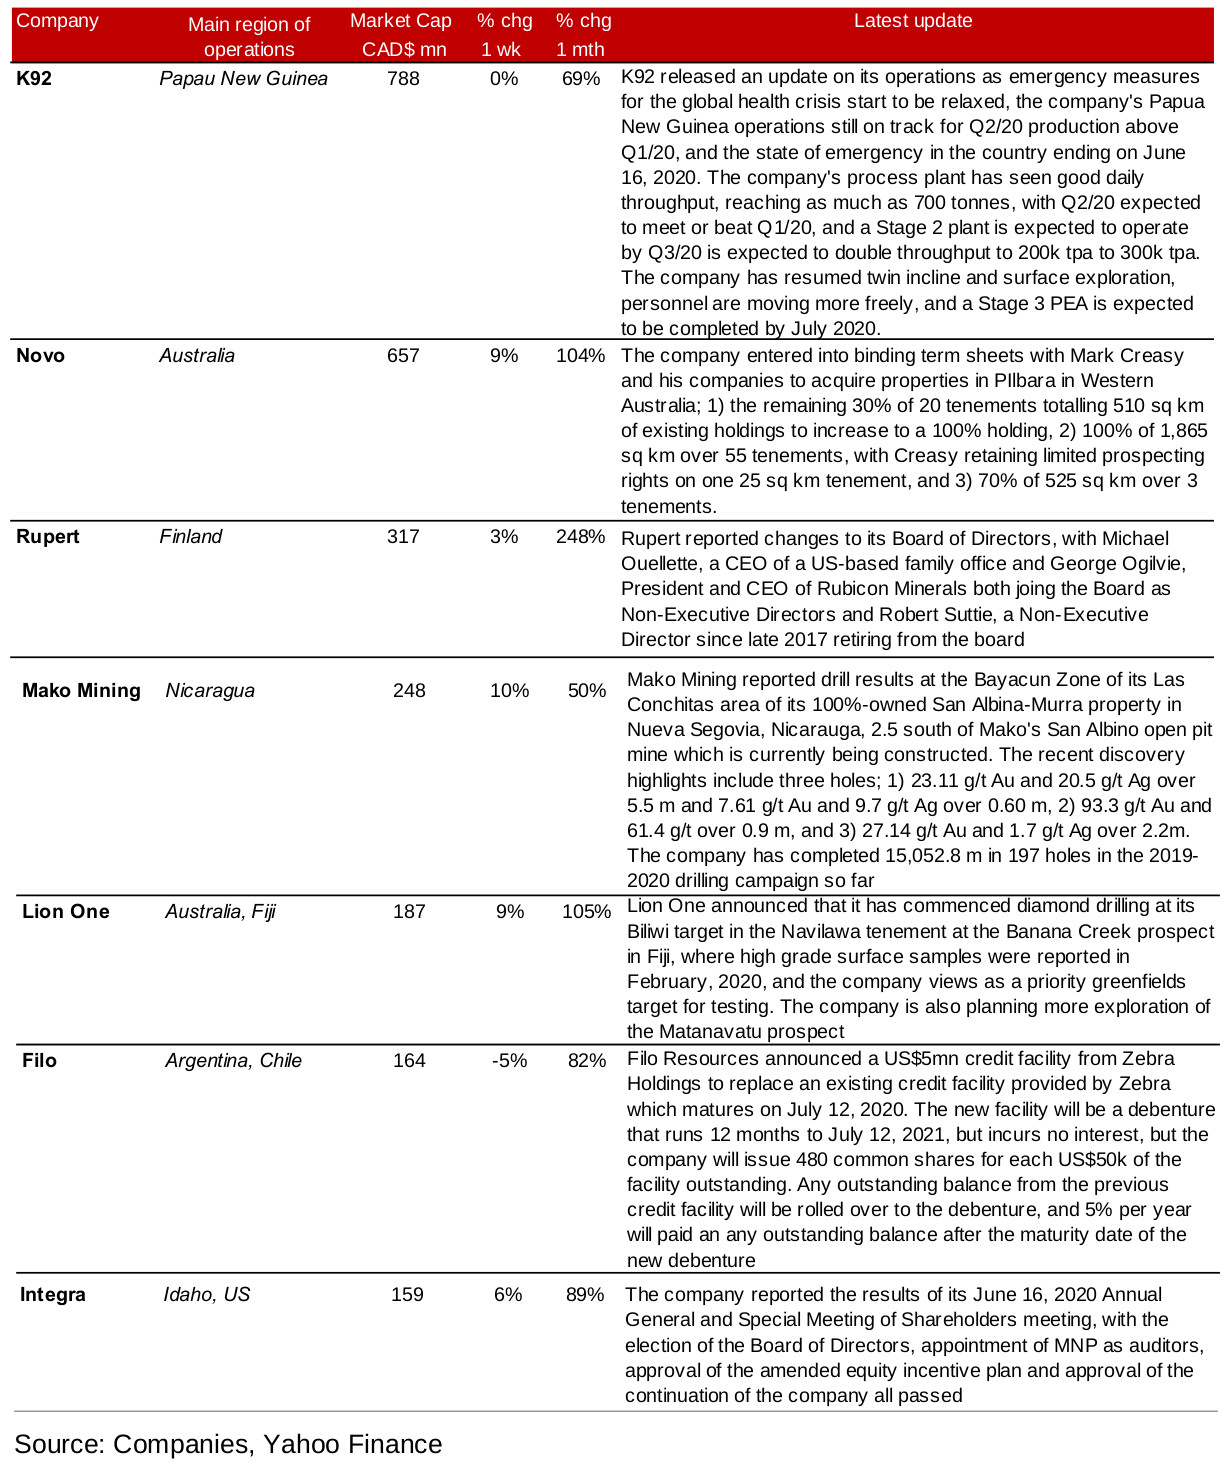
The Canadian internationally operating juniors were mixed this week. The largest moves were driven by material press releases by our In Focus stock this week, Novo Resources, up over 10% after acquiring more area for some of its projects, Mako, up nearly 10% after reporting strong drilling results, and Lion One, up 9% after commencing diamond drilling one of its projects in Fiji. K92 gave an operational update following the resumption of activity since the global health crisis, with the company still targeting qoq throughput growth for Q2/20 (Figure 11). Other news releases included Rupert's changes to its Board of Directors, Filo's announcement of a replacement credit facility and Integra's reporting of the results of its AGM. Material declines by Minaurum and Chesapeake did not see related press releases.
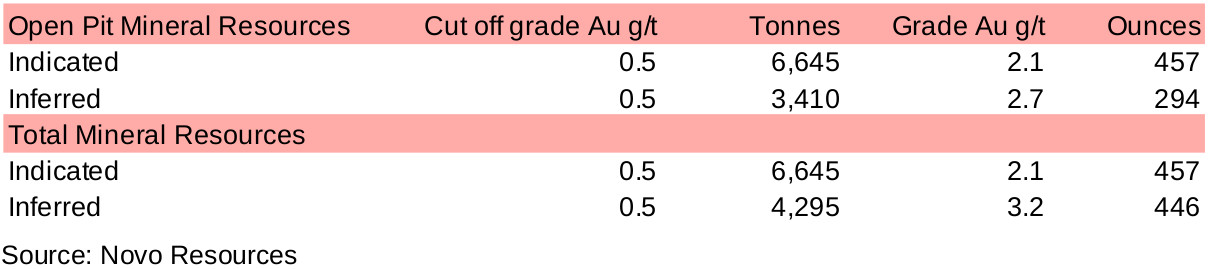
Novo Resources is one of the largest Canadian junior miners with operations outside of Canada, with three main projects in Northwest Australia's Pilbara Craton. The gold from the conglomerates in Pilbara can be particularly coarse, and the company has developed systems to handle mineralization of this kind. The company's most advanced project is Beaton Creek, where, as of its June 2020 presentation, it has completed surveying and sampling, released Indicated and Inferred resources, made agreements with local communities, completed mine permitted, established a relationship with Sumitomo for financing and has considered properties to option including strategic acquisitions (Figures 13, 14). The company has nearly completed mechanical sorting test and is now considering a path toward production.
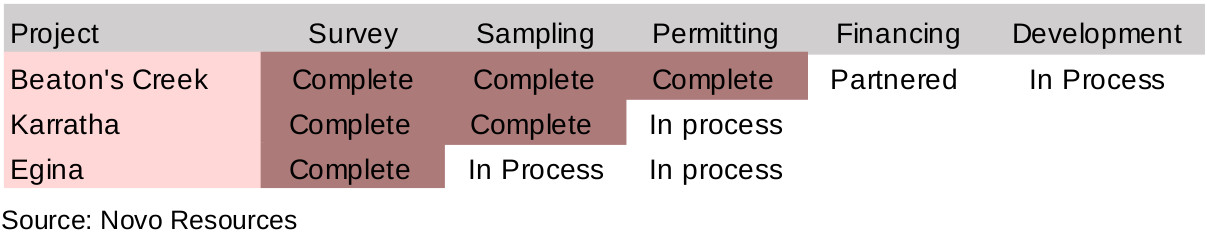
The company's other two projects in Pilbara are Karratha and Egina. At Karratha the company has completed surveying and sampling and is still working towards agreements with local communities and mine permitting, and is planning bulk extraction and processing. Egina is at an earlier stage than Karratha, with surveying completed, and sampling still in process, and agreements with local communities and mine permitting still to occur. Recent news flow has included restarting exploration at Egina, and then the discovery of a gold-bearing swale there in May 2020, and the expansion of its projects with three licenses at Mt. Elsie, an option with Bellary Dome for a gold rights exploration license in Southern Pilbara, and an acquisition of a large area of properties currently owned by Mark Creasy and his associated firms, all in June 2020.
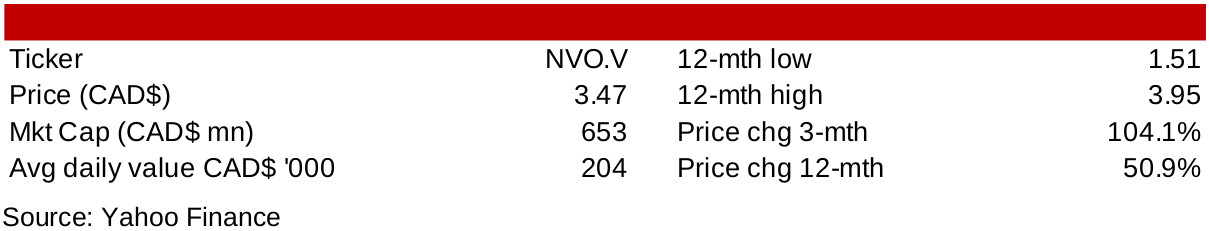
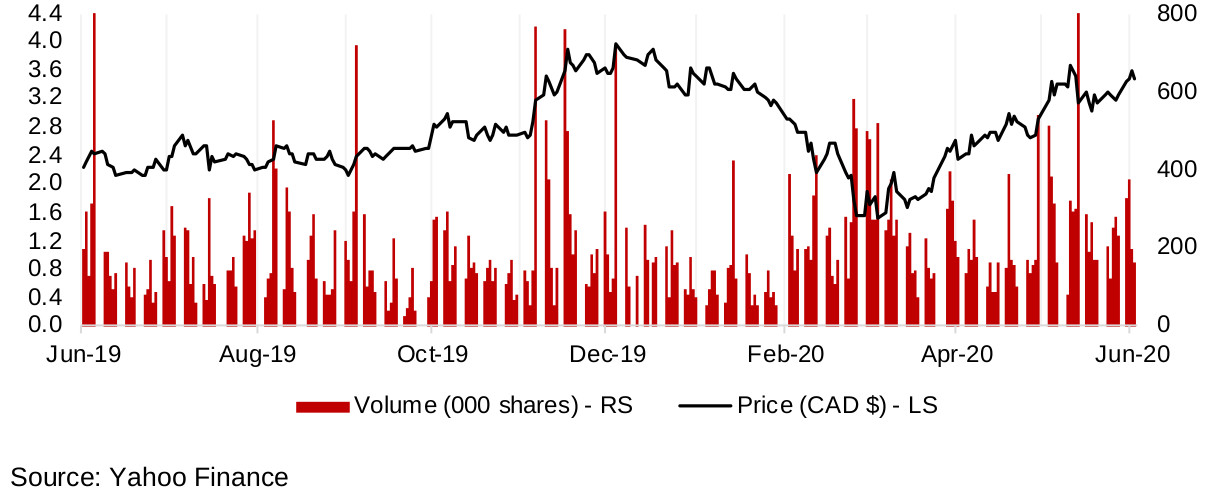
The company has several large strategic shareholders, with Kirkland Lake holding 15.83% of its shares, Eric Sprott holding 12.20%, Creasy Group 5.93%, Newmont Goldcorp 3.15% and management and directors 1.87%. The company has recovered from the March crash and is nearing highs set in December 2019, and was up over the past week on the news of the expansion of its project holdings.
Disclaimer: This report is for informational use only and should not be used an alternative to the financial and legal advice of a qualified professional in business planning and investment. We do not represent that forecasts in this report will lead to a specific outcome or result, and are not liable in the event of any business action taken in whole or in part as a result of the contents of this report.
Author
Ben McGregor authors the Weekly Roundup at CanadianMiningReport.com, providing sharp analysis of the metals and mining sector. With a talent for spotting trends, Ben distills complex market shifts into clear, engaging insights on TSXV junior miners. His weekly updates cover gold, copper, uranium, and more, blending data-driven perspectives with a knack for identifying opportunities. A vital resource for investors, Ben’s work navigates the dynamic junior mining landscape with precision.