
July 21, 2025
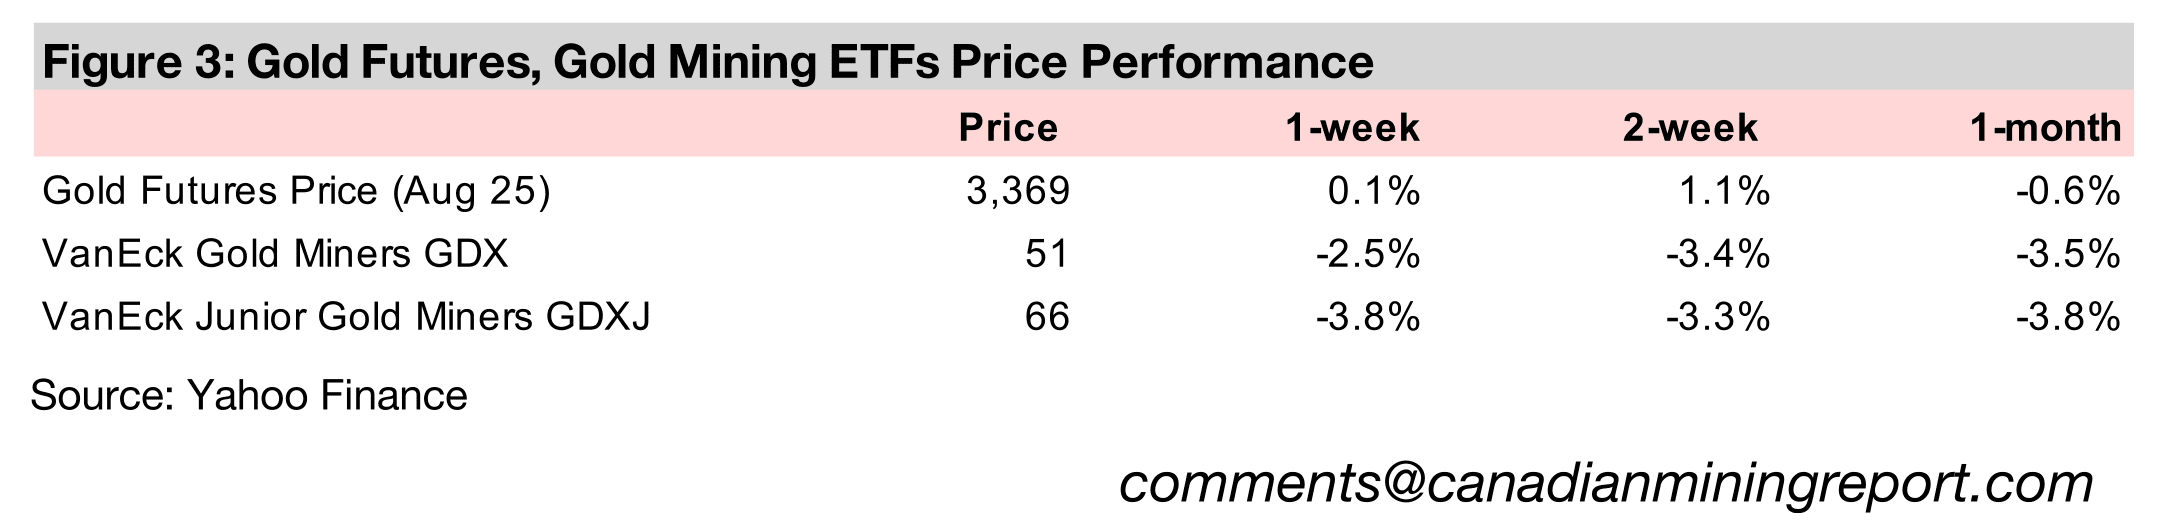
Gold was near flat, up 0.1% to US$3,369/oz and has remained steadily for five weeks near the mid-point of a US$3,200-US$3,400/oz range holding for over three months, with US CPI inflation the main economic release and inline with expectations.
This week we look at how gold’s stagnation may see it avoid the boom bust of some previous cycles and the shift in the TSXV Top 20 Gold market cap towards producers, with exploration’s share declining to very low levels versus the past five years.
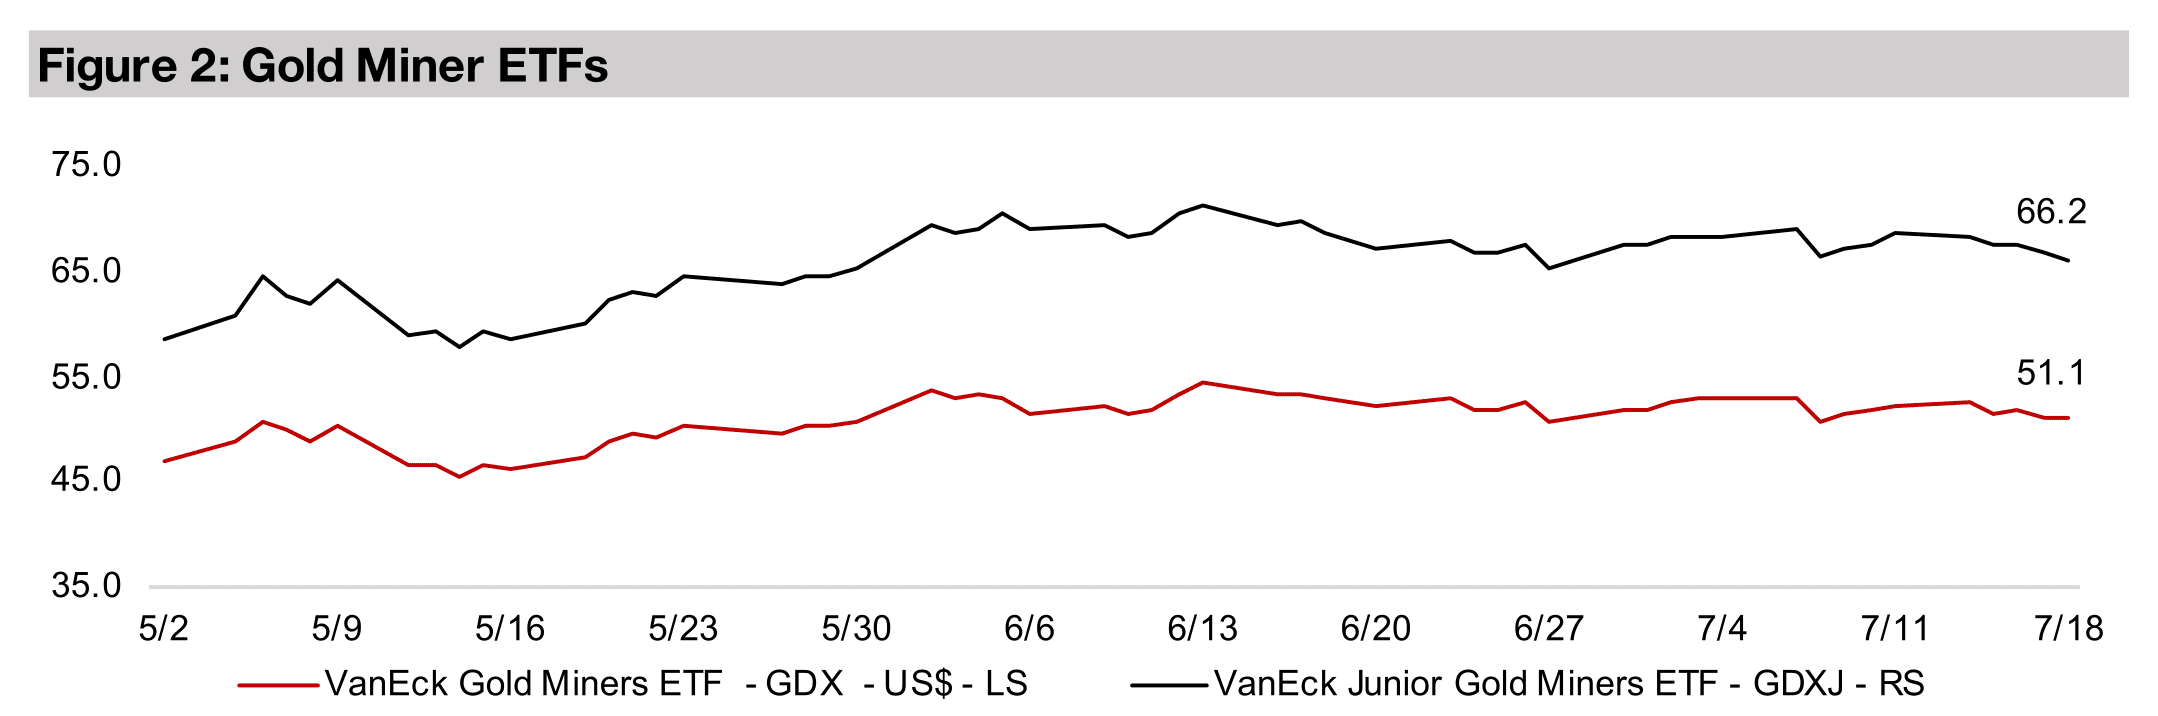
The gold stocks were down with the GDX off -2.5% and GDXJ declining -3.8% on the flat metal price and continued risk on move in markets, with the S&P 500 up 0.8% and Nasdaq gaining 1.5% as both reached new record highs.


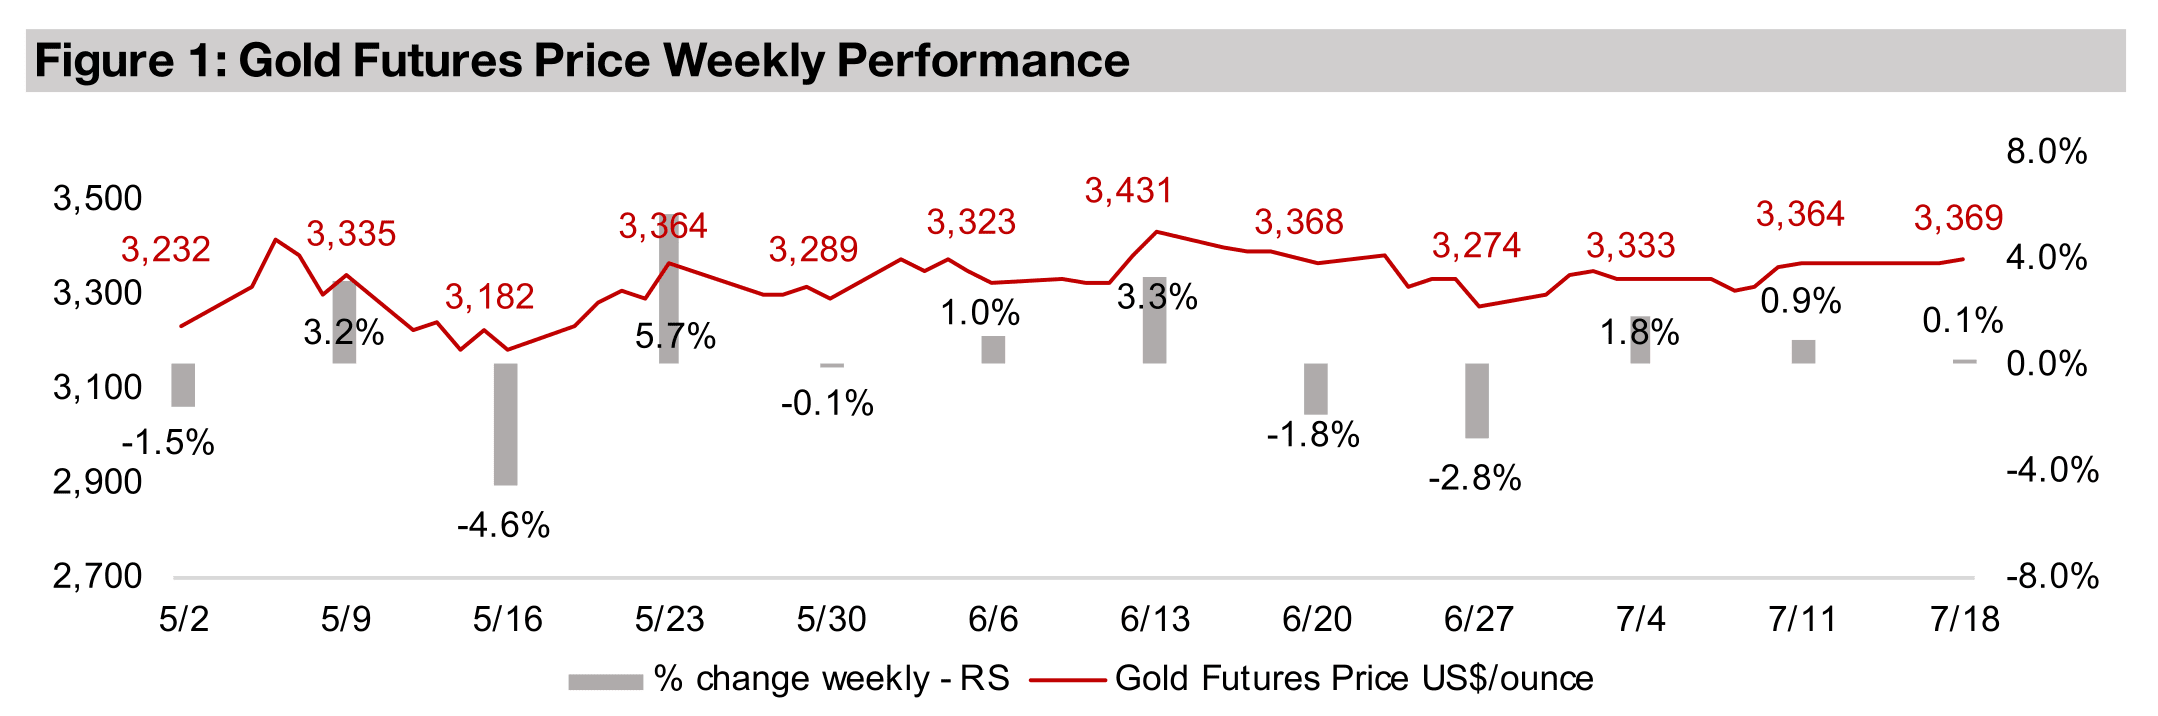
The gold price was near flat, gaining just 0.1% to US$3,369/oz, with the metal
consolidating in a range around US$3,200/oz-US$3,400/oz for over three months,
and remaining remarkably close to the mid-point for six weeks. The key economic
news was US CPI inflation, which rose moderately, inline with expectations, and risk
on in markets continued, with the S&P 500 up 0.8% and Nasdaq gaining 1.5%, and
both reaching new all-time highs. However, the market still continues to hedge these
moves, as shown by the steady gold price, and an 0.8% rise for the defensive utilities
sector, which is up 14.8% in 2025, notably still ahead of the 12.6% gain in tech.
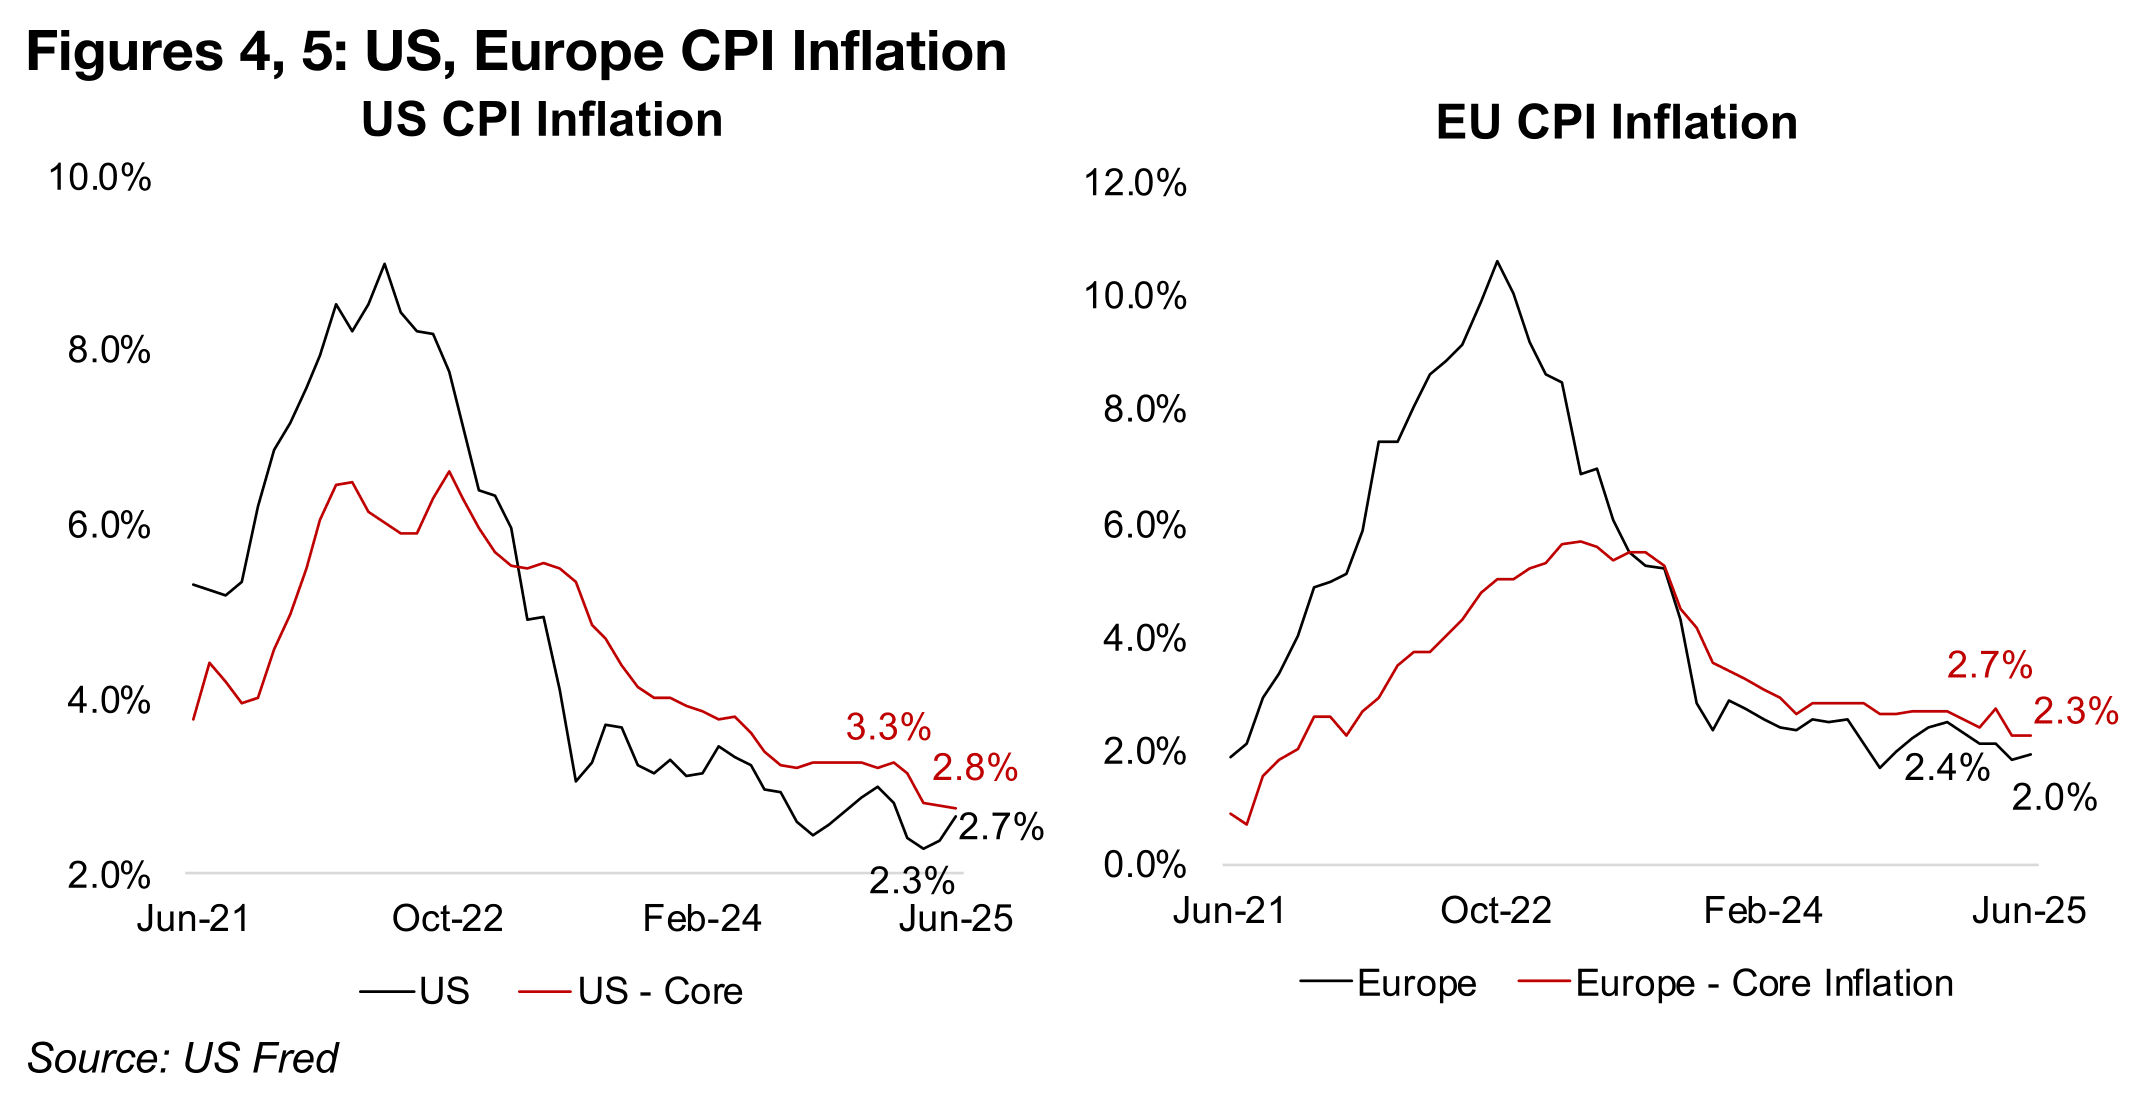
US headline CPI inflation rose for a second month to 2.7% from lows of 2.3% in April
2025, although core inflation continued to decline, to 2.8%, which is still moderately
above the Fed’s 2.0% target for this latter measure (Figure 4). While headline
European CPI inflation ticked up slightly in June 2025, it is still down from its most
recent highs at 2.4% in March 2025 (Figure 5). Core inflation in Europe has continued
to trend down overall this year, with it at 2.3% in June 2025, and nearing the European
Central Bank target, also at 2.0%, after a brief rise to 2.7% in April 2025.
The rebound in US inflation has kept the Fed cautious on cutting rates, and they have
maintained the base rate flat at 4.33% since April 2025. The Fed continues to be
concerned about the potential inflationary effect of new US tariffs, with another major
round of hikes to start on August 1, 2025. This has drawn criticism from the US
President, who has pushed for rate cuts, and even led to claims that the US Fed
Chairman would be fired, although this has been denied by the current administration.
However, with the current Fed Chairman’s term to end in May 2026, it seems very
likely that he will be replaced then.
While the major central banks and the markets have focussed on the potentially
inflationary effects of tariffs, there has also been another major driver exacerbating
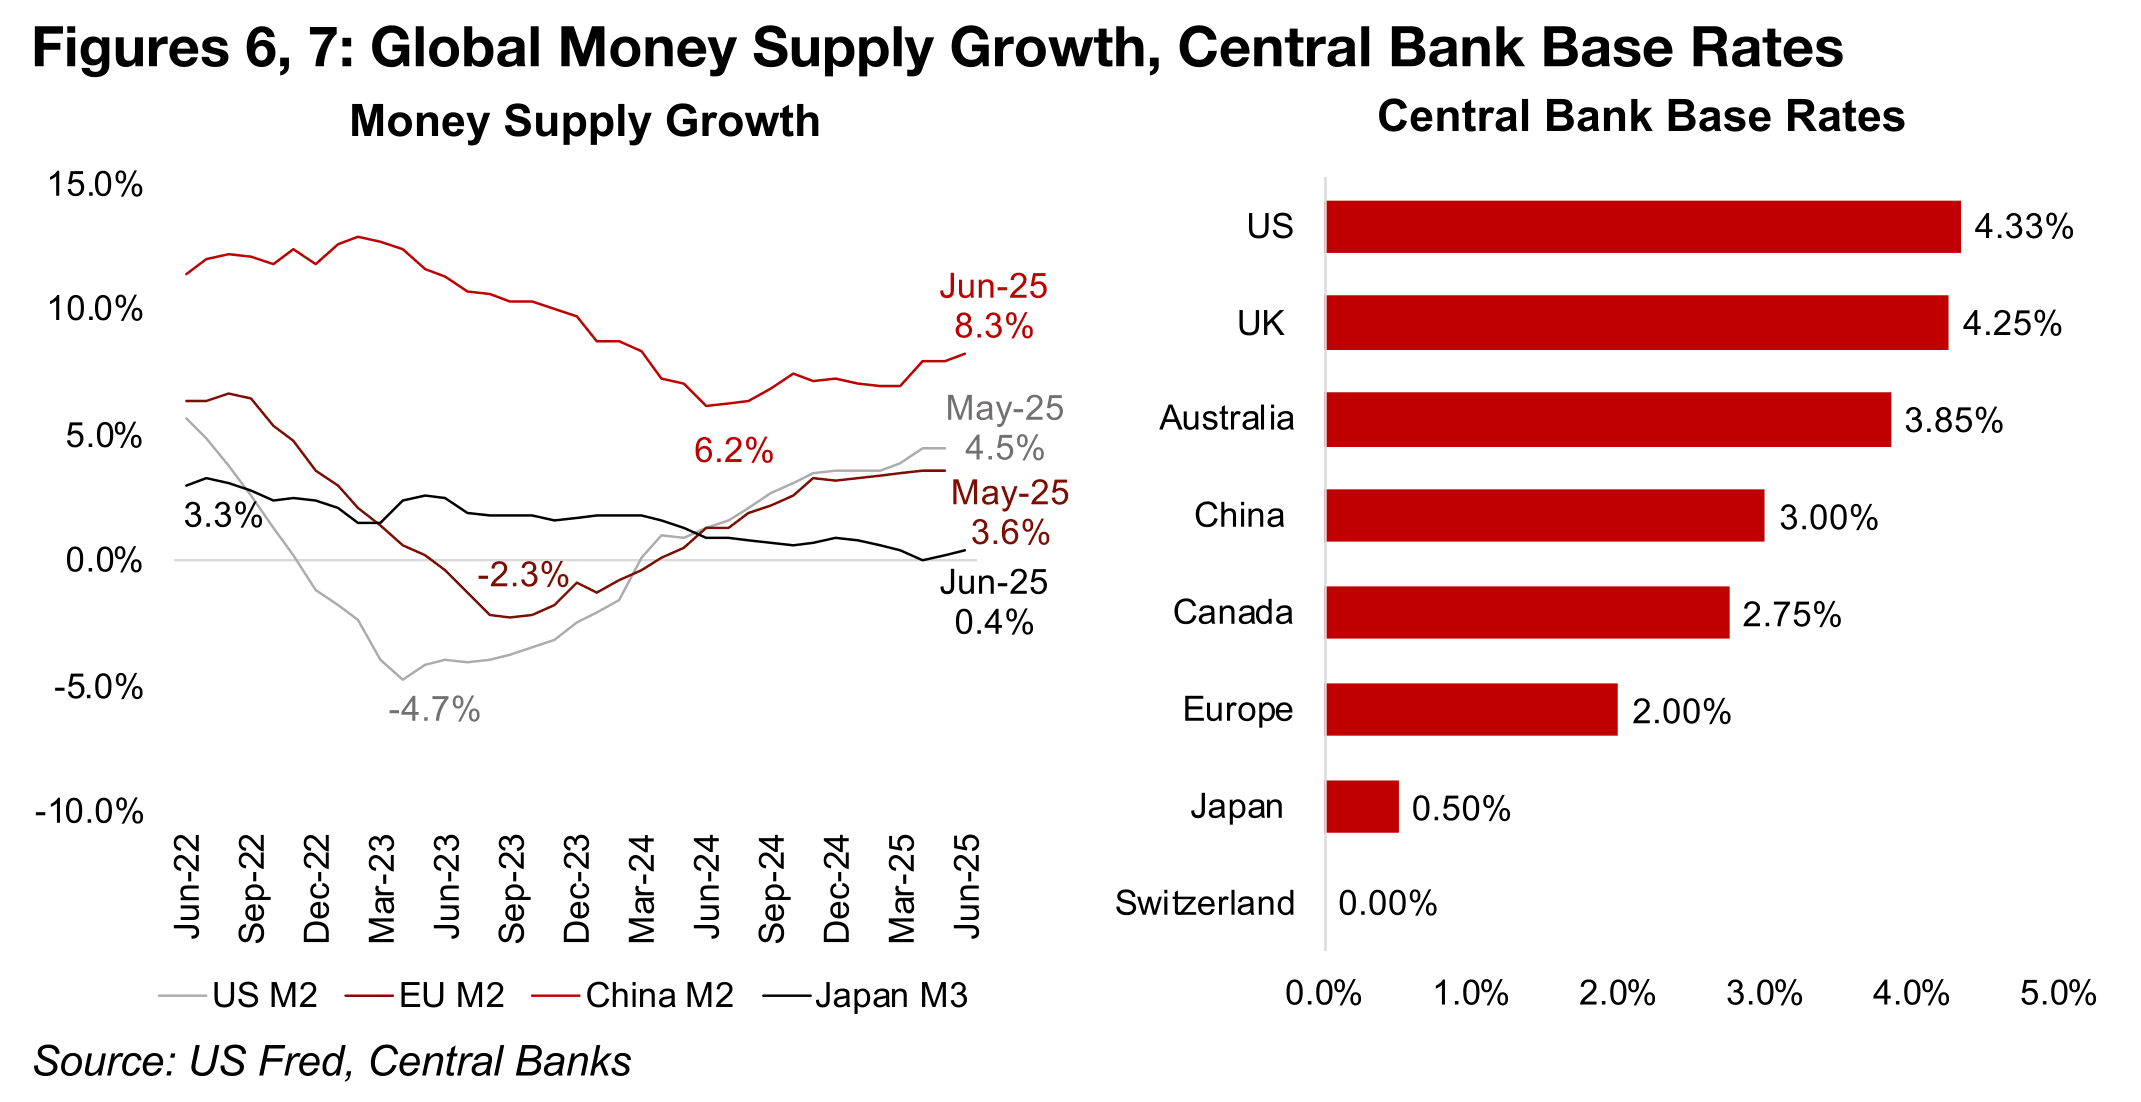
the risk of price rises, a major continued expansion of the global money supply. US
M2 money supply rose 4.5% in June 2025, and have trended up for two years from
lows of -4.7% in June 2023, and China’s M2 growth was at 8.3% last month, up from
6.2% lows a year ago (Figure 6). Europe’s M2 rose 3.6% in June 2025, up from -2.3%
lows in September 2023, and of the world’s four largest money supplies, only Japan
has seen a downtrend in growth, to 0.4% in June 2025, from 3.3% in July 2022.
The increase in the US M2 money supply has continued even with Fed holding rates
flat this year, which suggests that it could ramp up even more quickly if the country
starts to cut along with most of the rest of the world. The European Central Bank and
Canada have already cut rates by half over the past year to 2.0% and 2.75%,
respectively and Switzerland has even returned to zero interest rates (Figure 7). China
has gradually reduced rates for several years, reaching 3.0%, and the UK and
Australia have also cut more gradually, to 4.25% and 3.85%.
Such a major rise in the global money supply could be inflationary, and along with
the tariffs could see the three-year decline in CPI start to reverse. If this is also
coupled with relatively weak global economic growth, as is currently forecast by the
IMF for 2025, it could mean a period of stagflation. This could put the US Fed in a
difficult position where it would be inclined to lower rates to boost economic growth,
but constrained from major reductions by high inflation. For the gold price, however,
this would not necessarily be a negative scenario, with it historically doing well during
the major stagflation of the mid-1970s through to early 1980s.
We do not view the consolidation of the gold price over the past three months as
necessarily negative for the metal, as a continued parabolic move could have been
setting it up for a severe reversal. The recently extended period of low volatility is
actually quite rare in gold’s historical upswings and is a sign gold’s move over the
past year has some strong fundamental support and has not become a speculative
bubble. A history of spikes in the gold price indicate that the 33% gain from
November 2024 to April 2025 over 158 days has actually been relatively gradual and
muted compared to some previous gold spikes.
The most severe gold move was November 1979 to January 1980, when it surged
116% in just 55 days, and subsequently faced a major downturn. There have been
more recent strong upswings over a short period, but by much lower percentages,
with it rising 23% from June 2020 to August 2020 over 62 days, and 14% from
February 2022 to March 2022 over 33 days. While there was another rise similar to
the level of the late 1970s-early 1980s jump, at 109%, this took far longer, over 784
days from July 2009 to August 2011. The other major historical jump for gold was
between August 2007 and March 2008, when it gained 54% over 209 days.
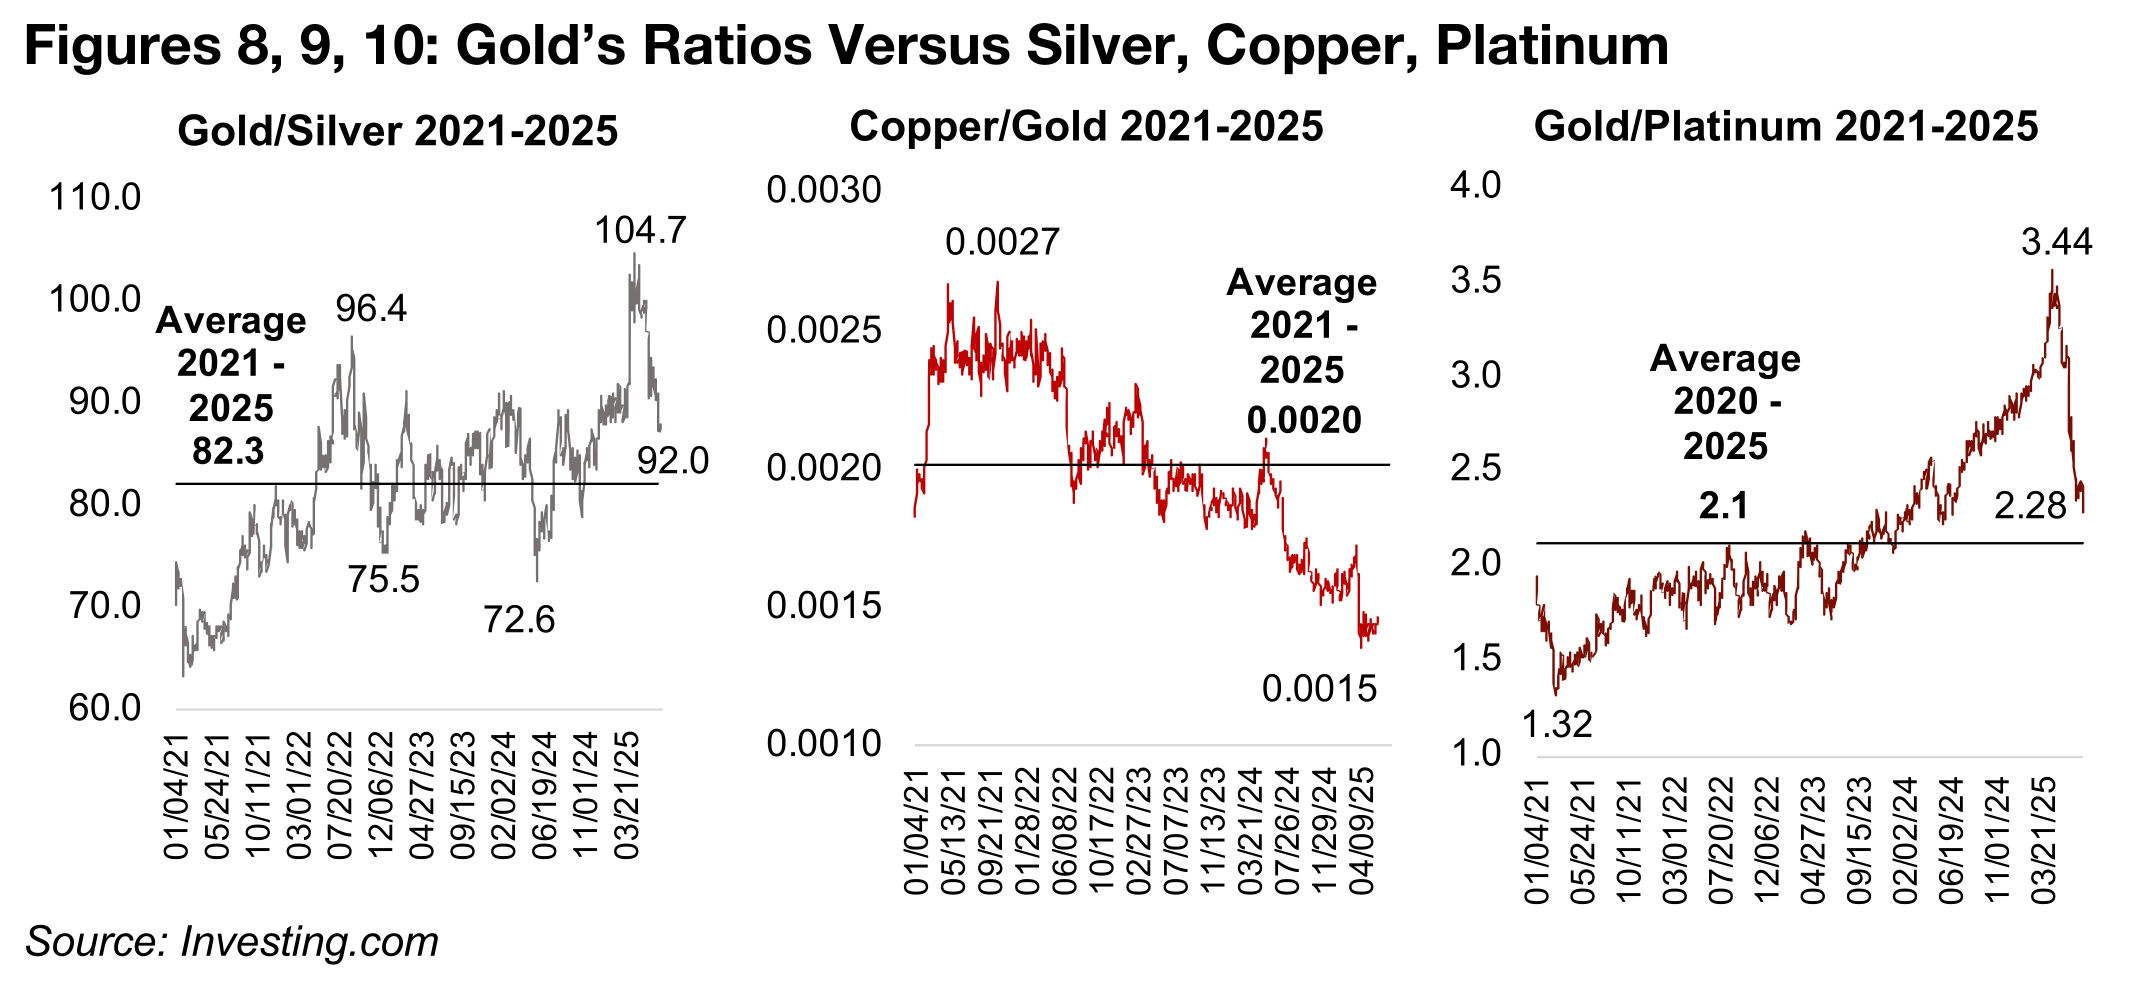
We had been concerned earlier this year by the extreme levels of gold’s ratios versus
some key comparable commodities, suggesting the metal would have to come down,
or these other assets rise, to bring them more in balance. For gold’s ratios versus
silver and platinum, it has turned out to be the latter, with the prices of these metals
surging in recent months. The gold to silver ratio peaked at 104.7x in late April, and
has pulled back to 92.0x, moderately above the 82.3x average since 2021 (Figure 8).
Gold to platinum dropped from 3.44x in April 2025 to 2.28, also moderately above
the 2.1x average from 2021 (Figure 10). Copper to gold has not recovered, and at
0.0015 is near its lows and well below the 0.0020 average since 2021 (Figure 9).
While the gold to oil ratio at 48.4x has declined from a 50.8x peak it is still nearly twice the level of the 27.0x average since 2021, although this is largely because high levels of global oil production are driving down the price (Figure 11). The gold to CRB Commodities Index at 8.9x has come down from a 9.6x peak and is only moderately above the 7.1x average since 2021 (Figure 12). This did not indicate a severe level of overvaluation for gold versus commodities even at the recent peak, and it would not take a major rebound in the CRB Index to see the ratio decline to the recent average.
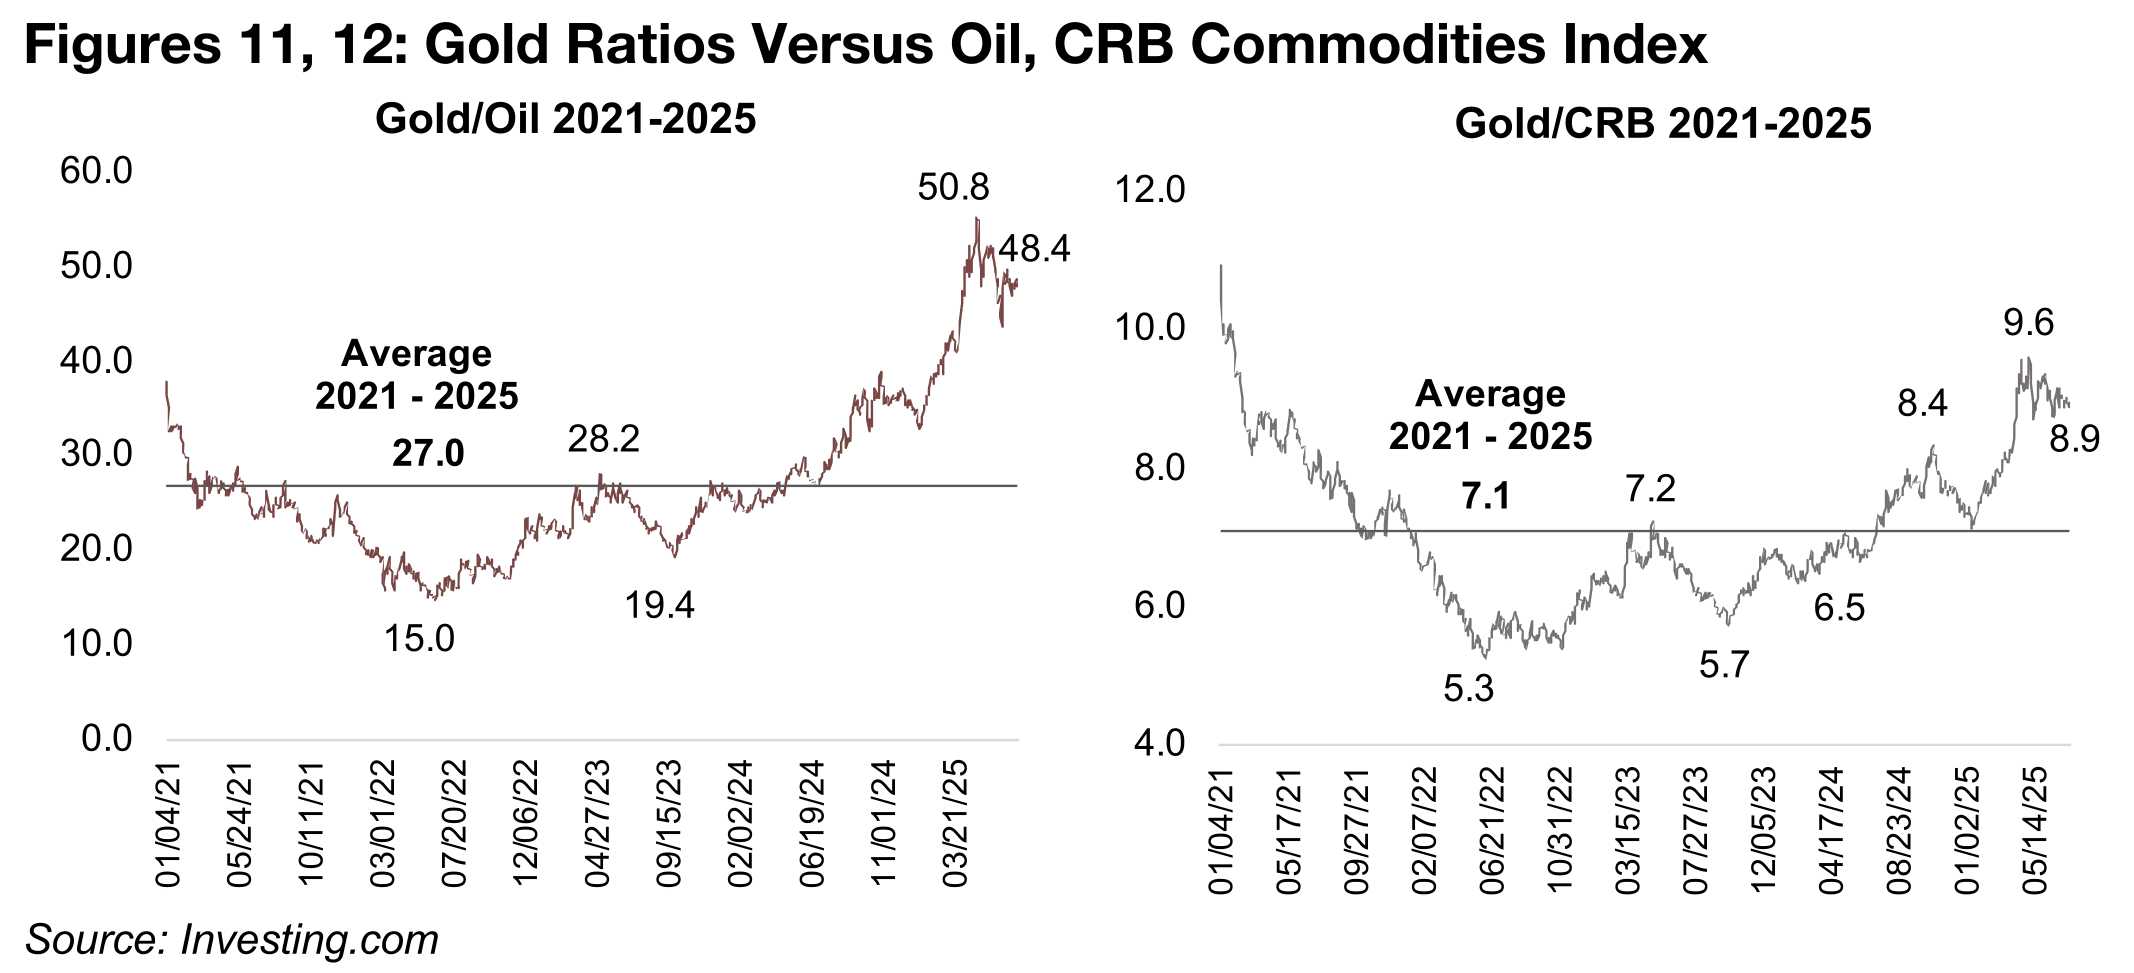
In considering the potential downside for gold price from here, we would first look to the bottom of the US$3,200/oz-US$3,400/oz range that has held for the past three months, which would indicate about a US$150/oz decline from the current level. Mean reversion would indicate lows of US$3,099/oz based on the 2025 average, and in a far more bearish case US$2,048/oz using the average since 2020. While this lower price seems very unlikely given still extremely high levels of economic and geopolitical risk, even using this five-year average as the ultimate downside would indicate that the days of sub-US$2,000/oz gold could be permanently over.
The rise in the gold price has seen a huge jump this year in the market cap of the TSXV Top 20 Gold to C$13.2bn as of May 2025 (Figure 13). Much of this is actually from a single stock, Artemis, with nearly a C$5.0bn market cap as of May 2025 (it has risen to nearly C$6.0bn since) with the start of commercial production in May 2025 at its huge Blackwater project. This has been a key driver of a rise in the share of companies in the production phase in TSXV Top 20 Gold market cap to 56% from just 20% in 2024 (Figure 14). However, there are several other companies in production that have also seen large gains, and there has been a major shift towards later stage companies for TSXV Top 20 Gold market cap in 2025 compared to the past five years, inline with markets becoming more risk averse overall.
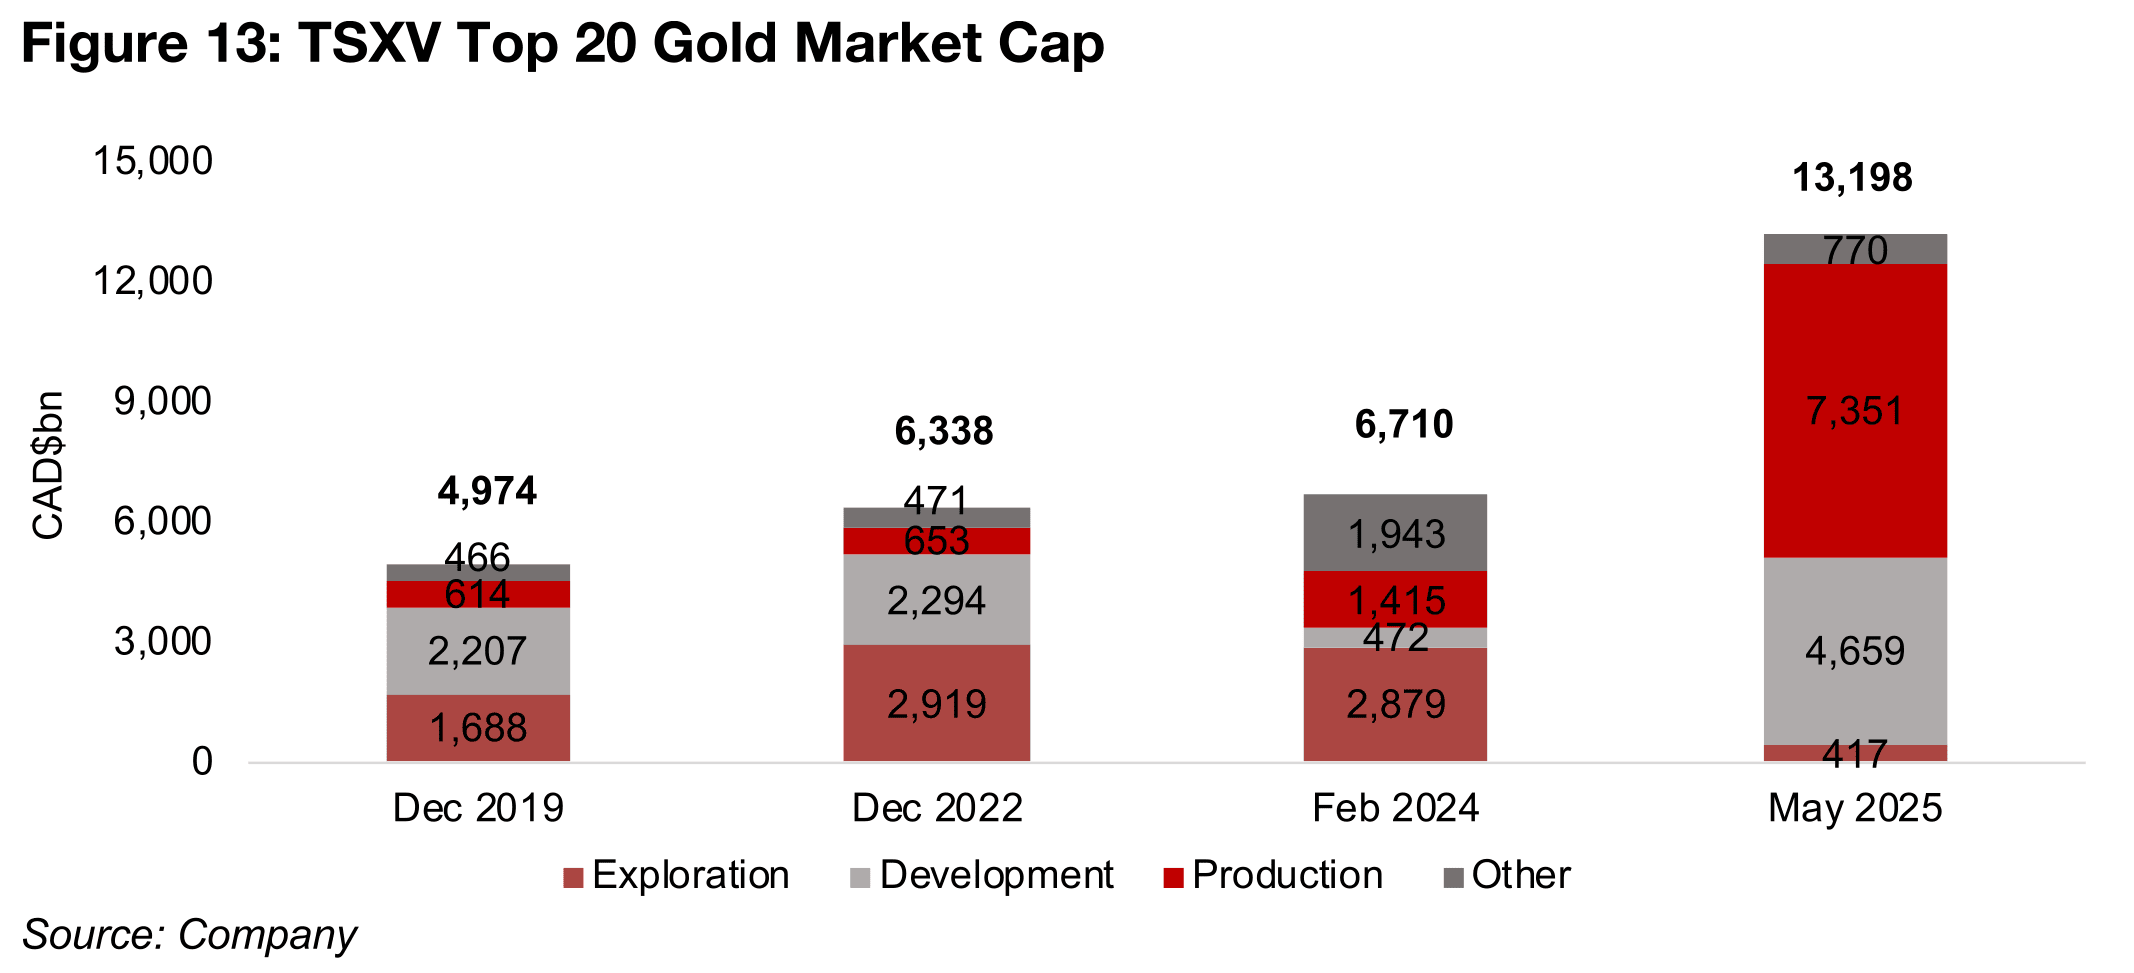
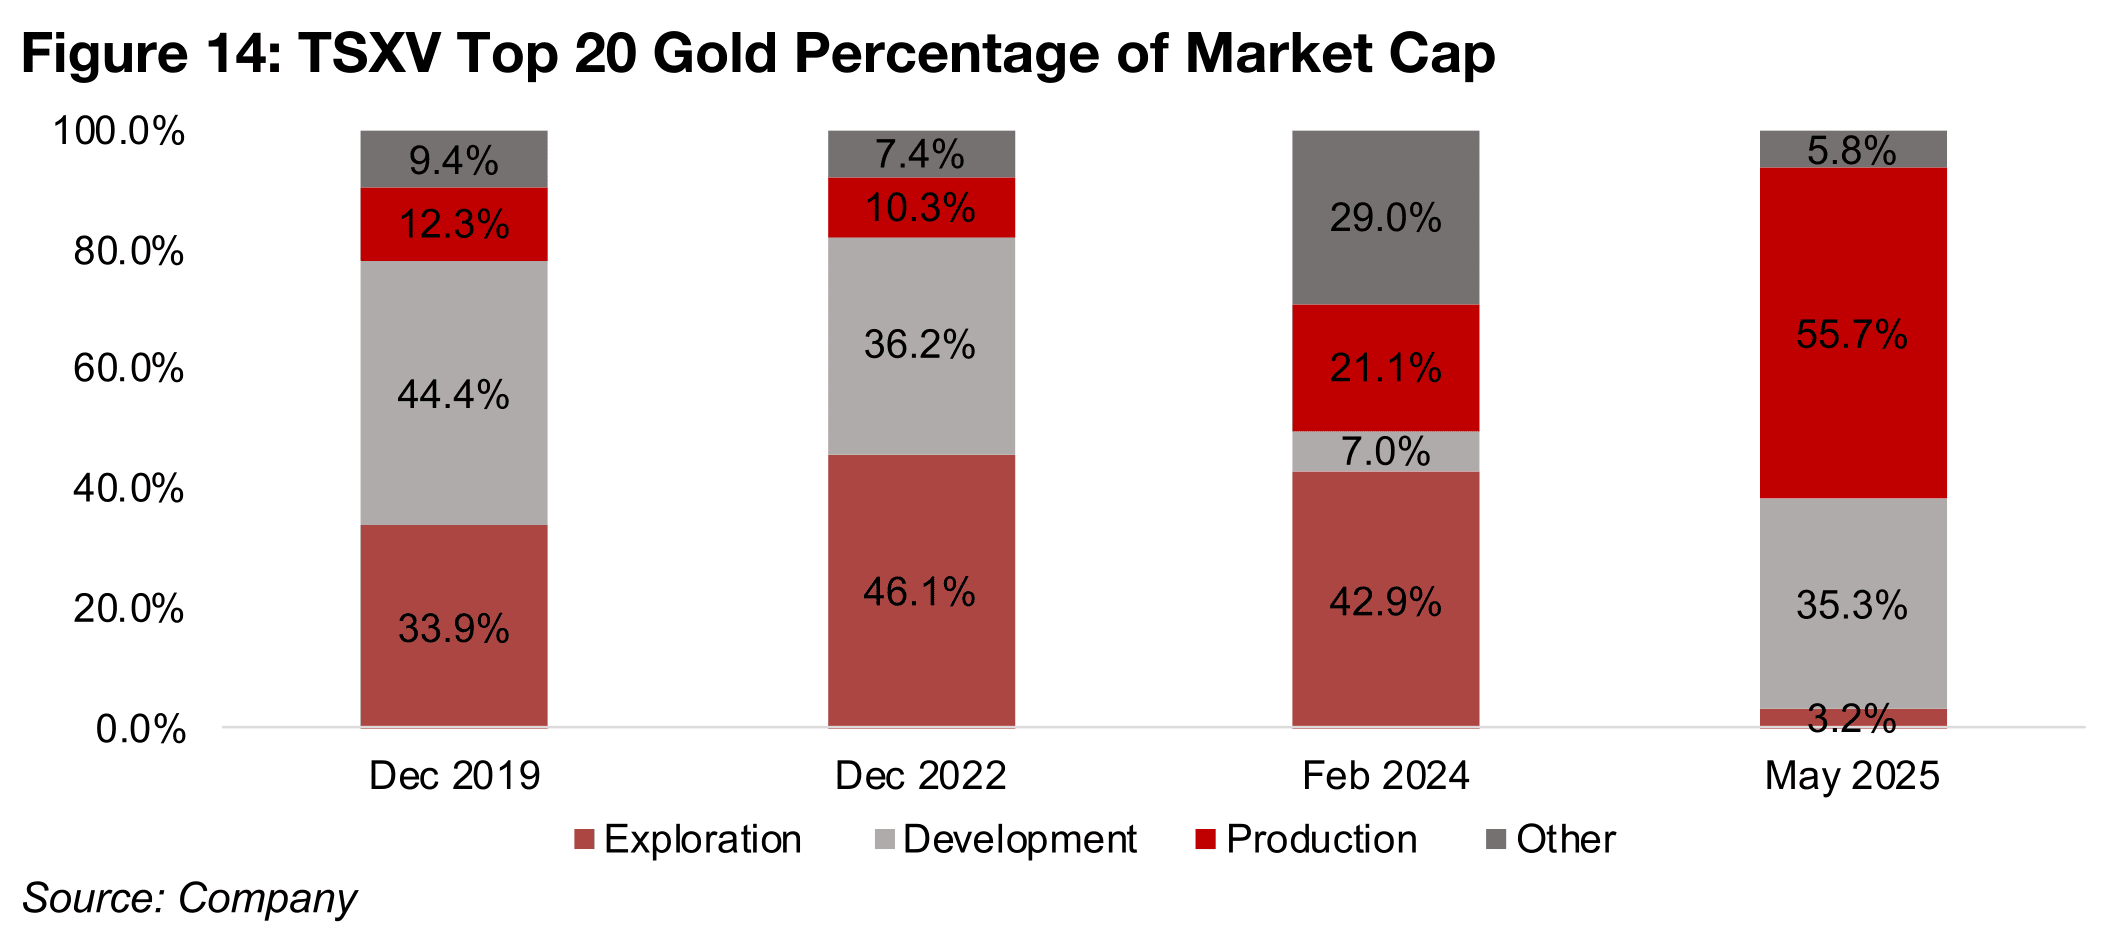
One extreme change in the composition of the TSXV Top 20 Gold market cap this year has been a plunge in the proportion of exploration stage companies, to just 3.2%, with it still over 40% in 2022 and 2024, and over 34% in 2019. The share of companies in development has also recovered, to 35.3%, from just 7.0% in Feb 2024, after being at around the 30%-40% level in 2019 and 2022. ‘Other’ companies had become a very large 29% of the TSXV Top 20 gold stocks market cap in early 2024. These were the ‘lawsuit’ stocks, Gabriel Resources, Gold Reserve and Rusoro Mining, which were all involved in long legal processes and not really actively developing projects. One of these stocks, Gabriel, did not receive the expected outcome or award from legal process, and the shares collapsed driving down the ‘other’ segment market for the TSXV Gold Top 20. The segment now comprises Gold Reserve and Rusoro Mining which have made progress in their legal cases this year and seen their market caps rise.
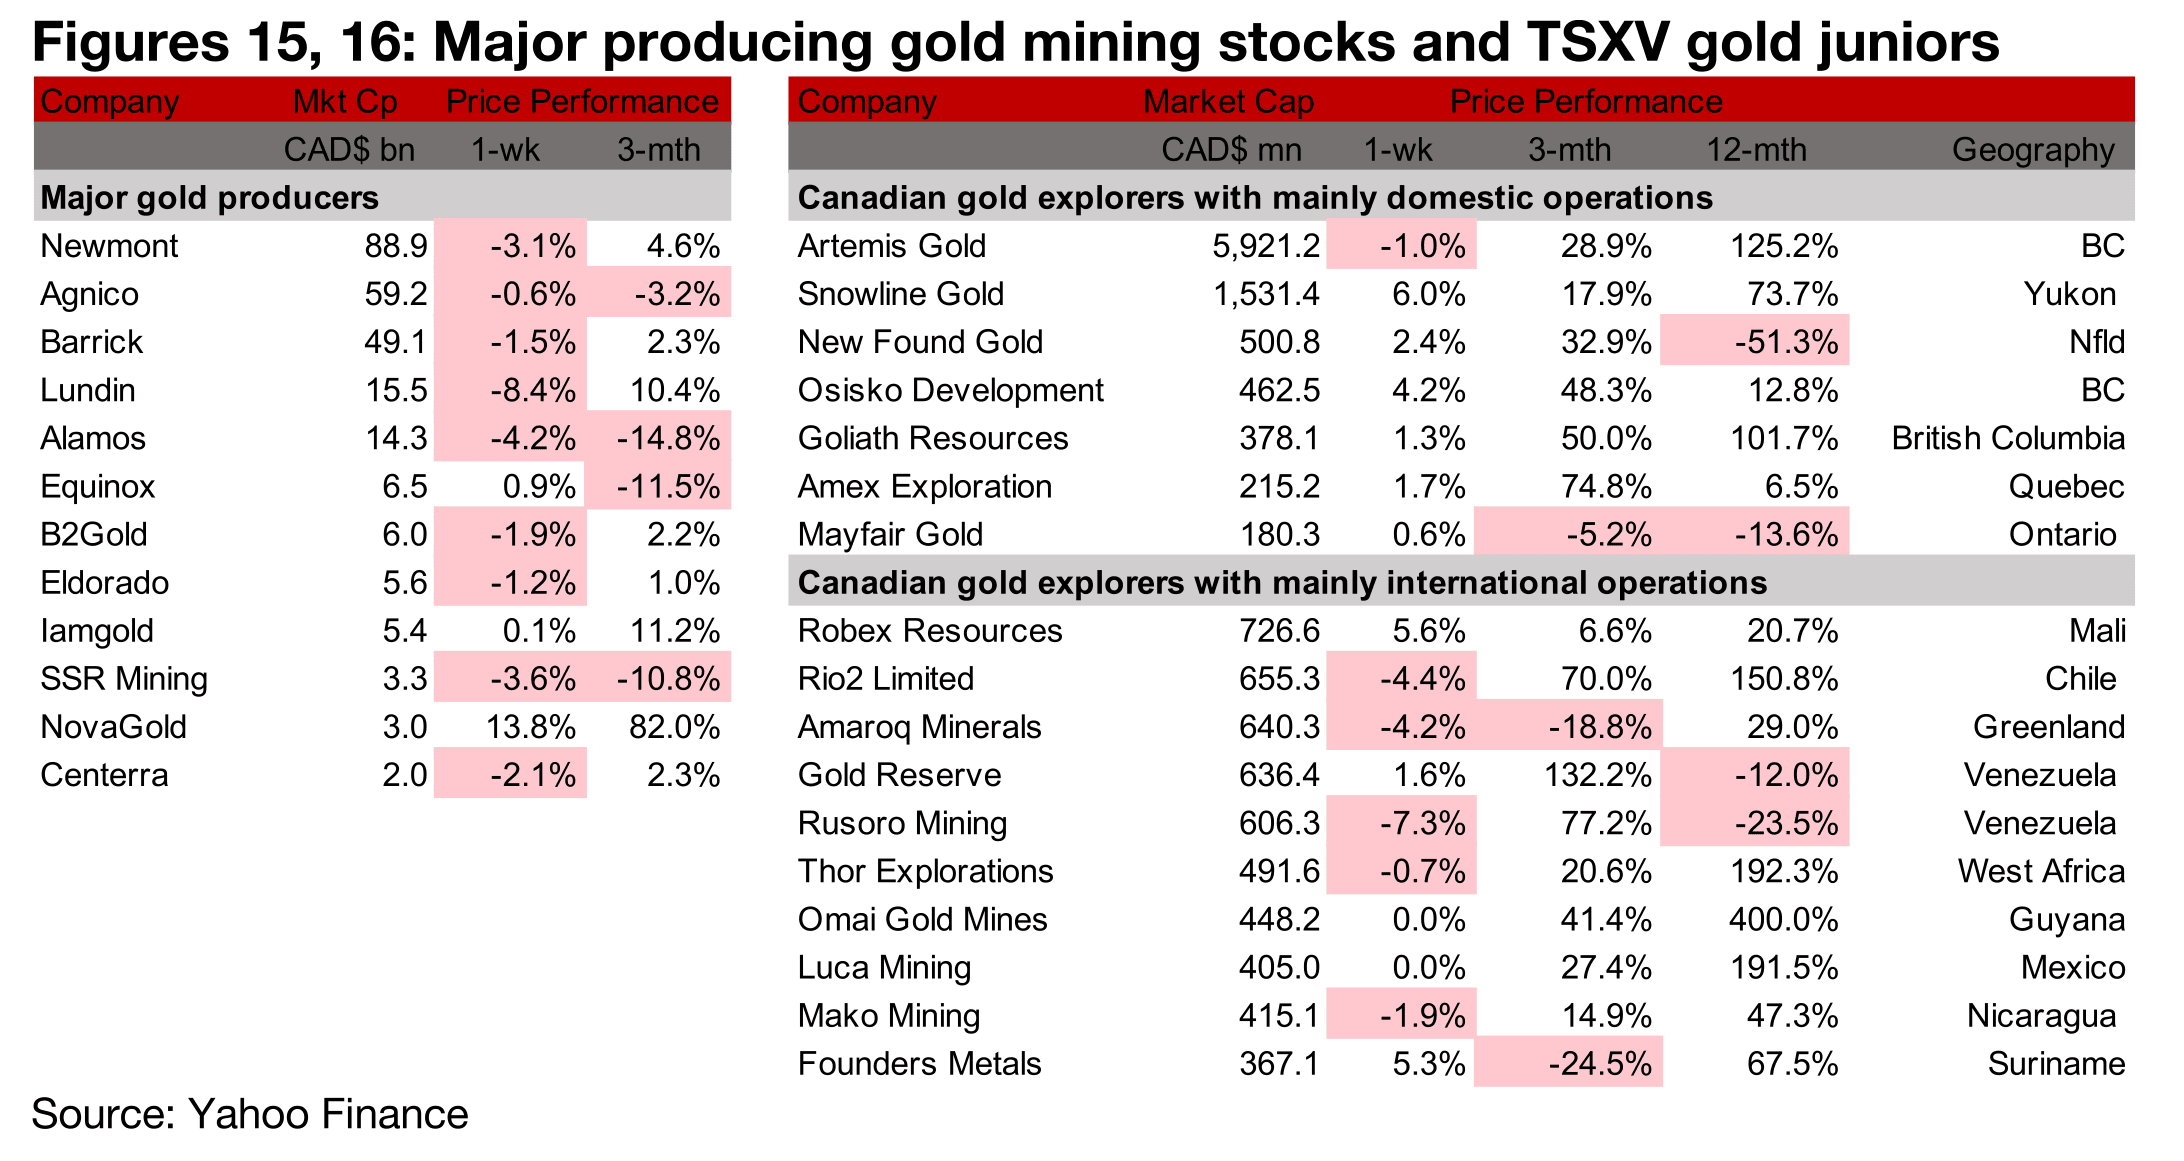
The major gold producers were mostly down and large TSXV gold were mixed
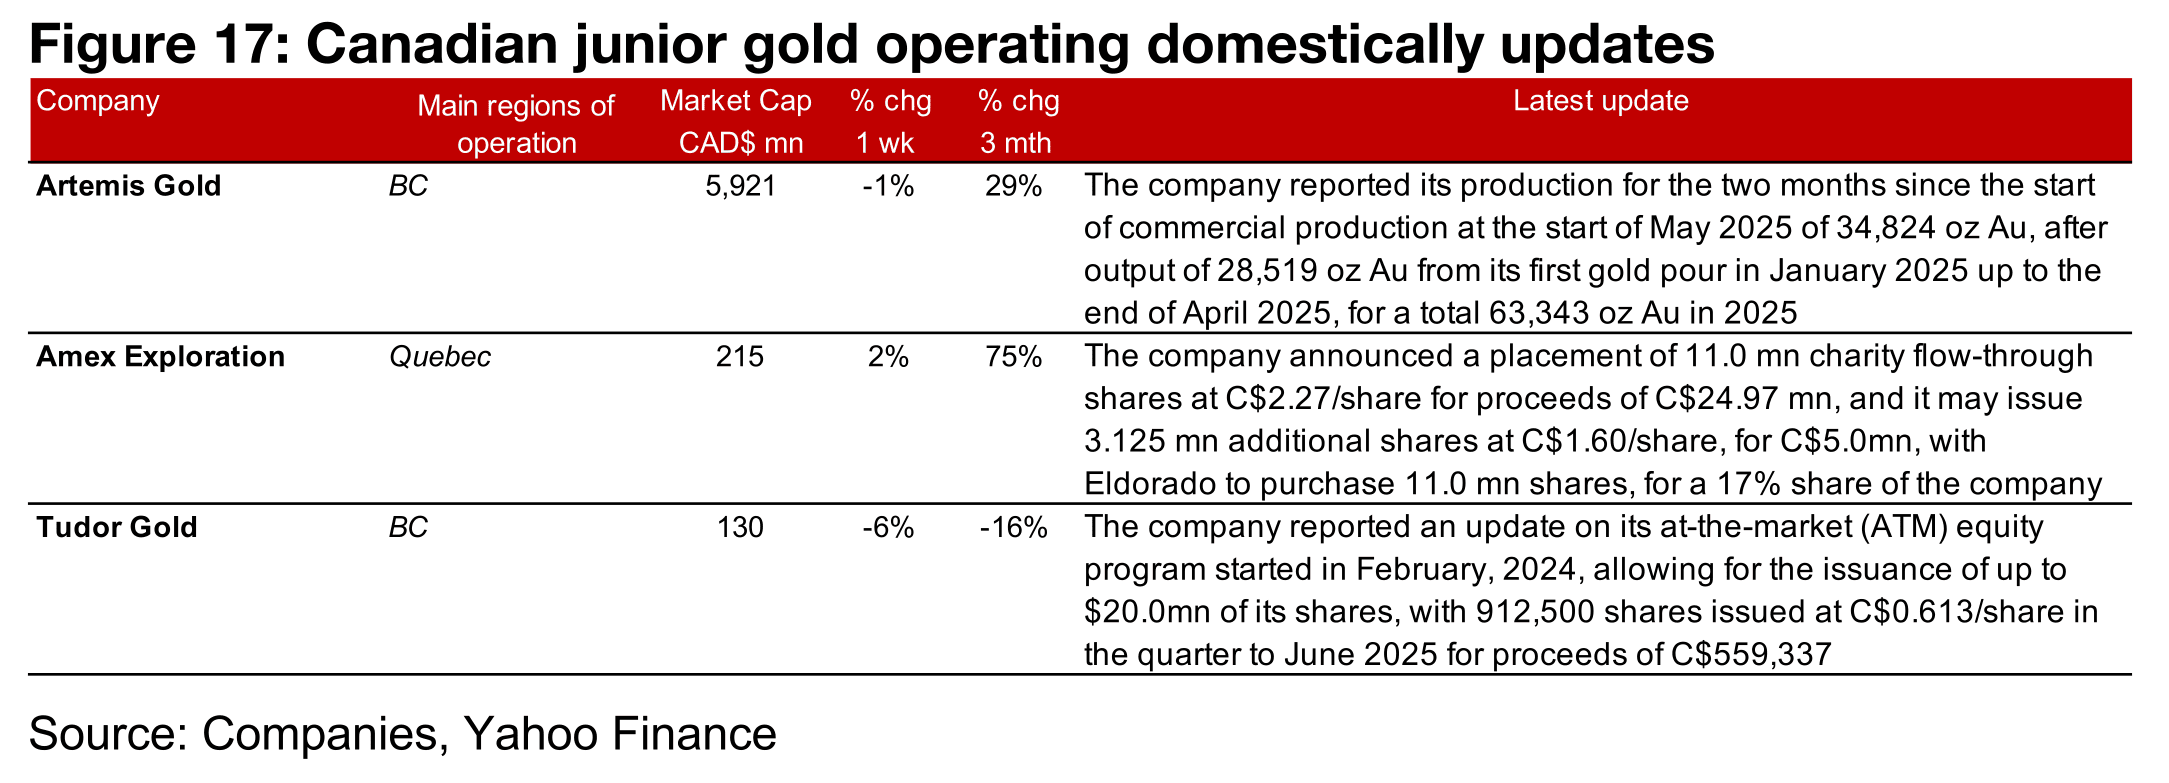
(Figures 15, 16) For the TSXV gold companies operating mainly domestically, Artemis
reported its output from its first two months of commercial production, Amex
Exploration announced a C$25.0 mn placement and Tudor Gold gave an update on
its at-the-market equity program (Figure 17). For the TSXV gold companies operating
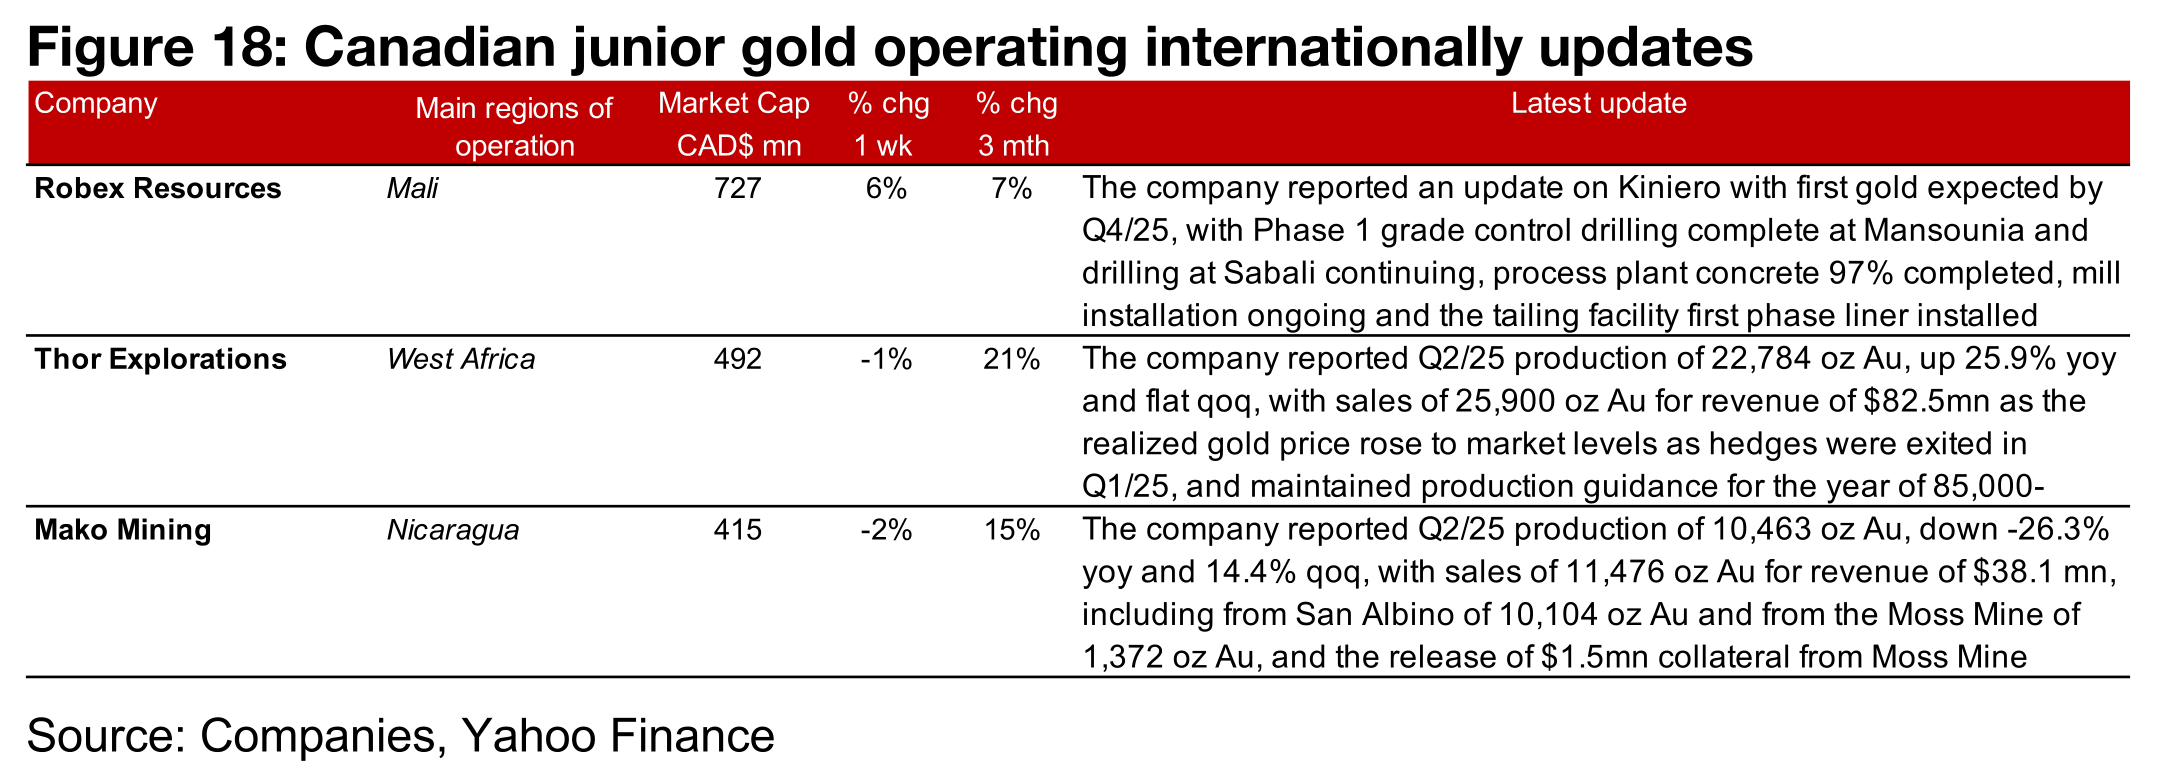
mainly internationally, Robex reported an update on Kiniero and Thor Explorations
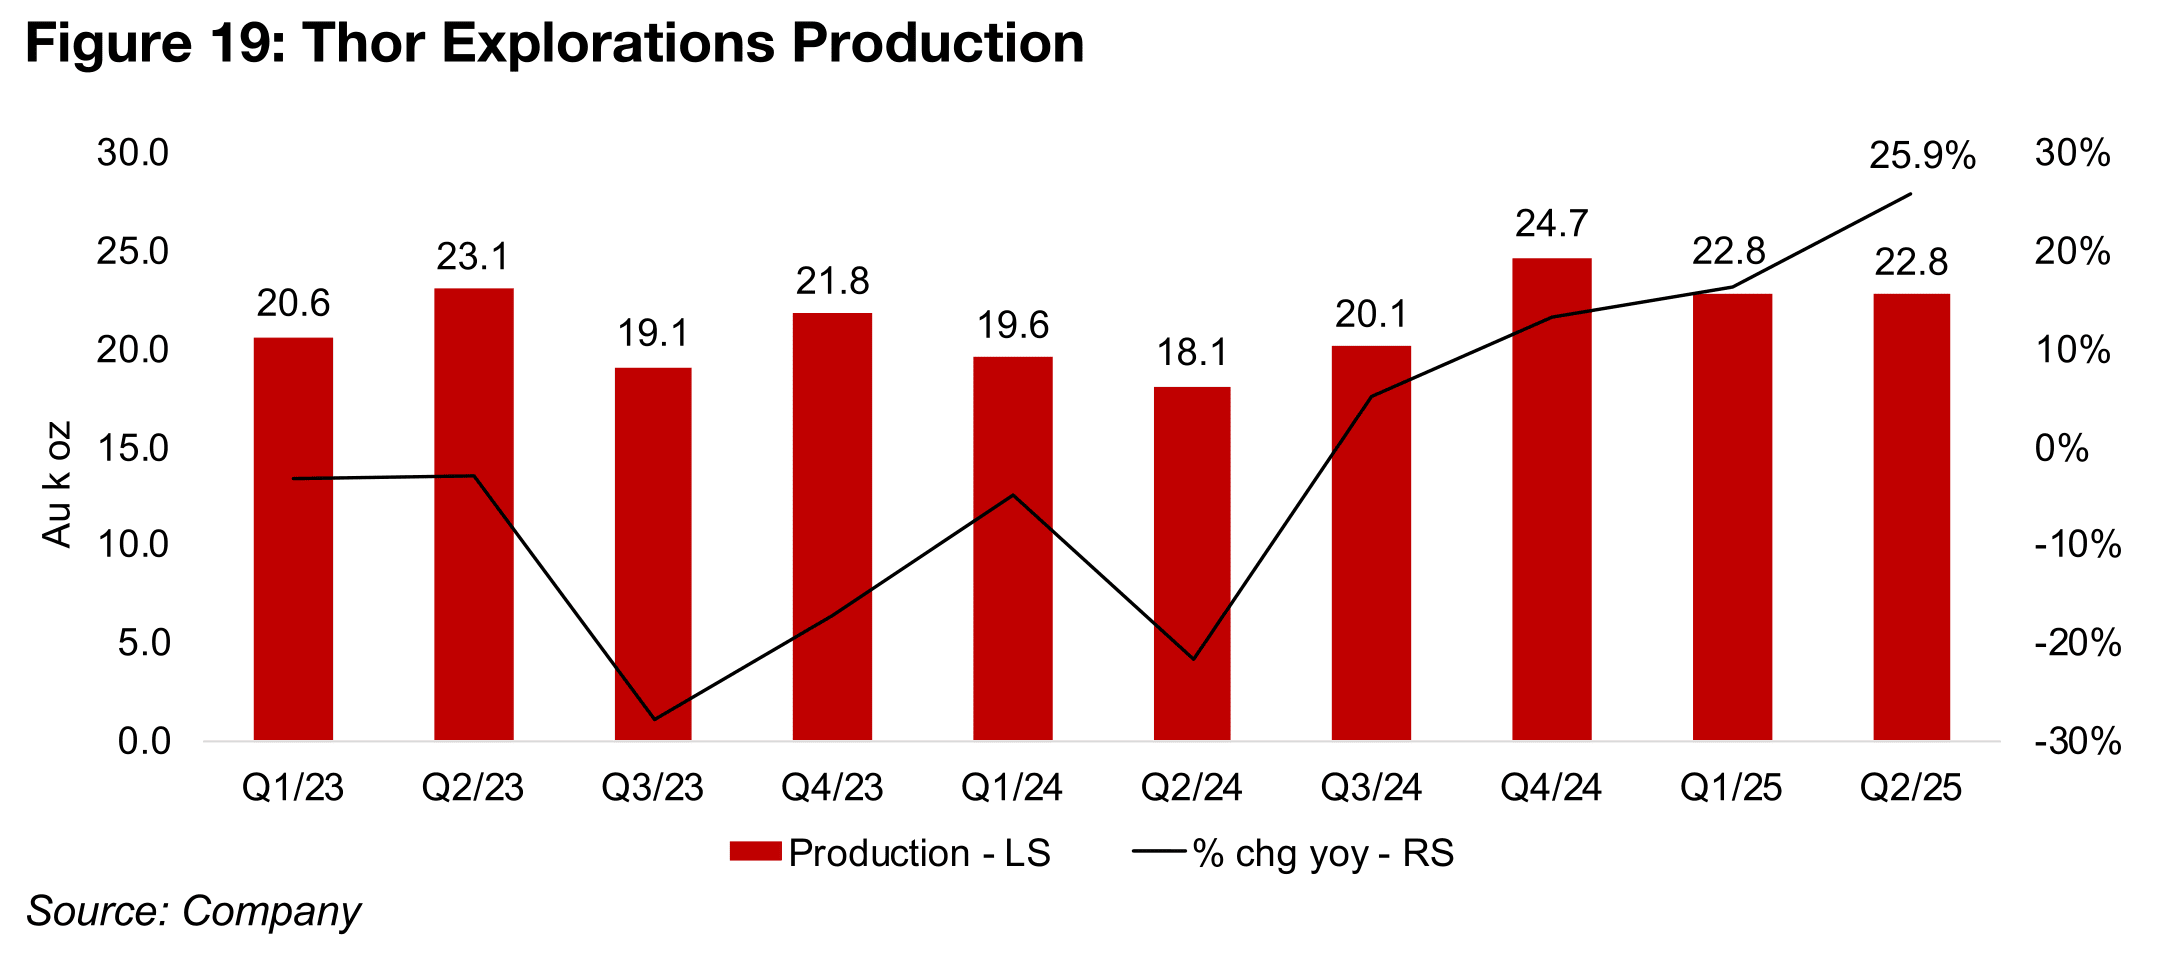
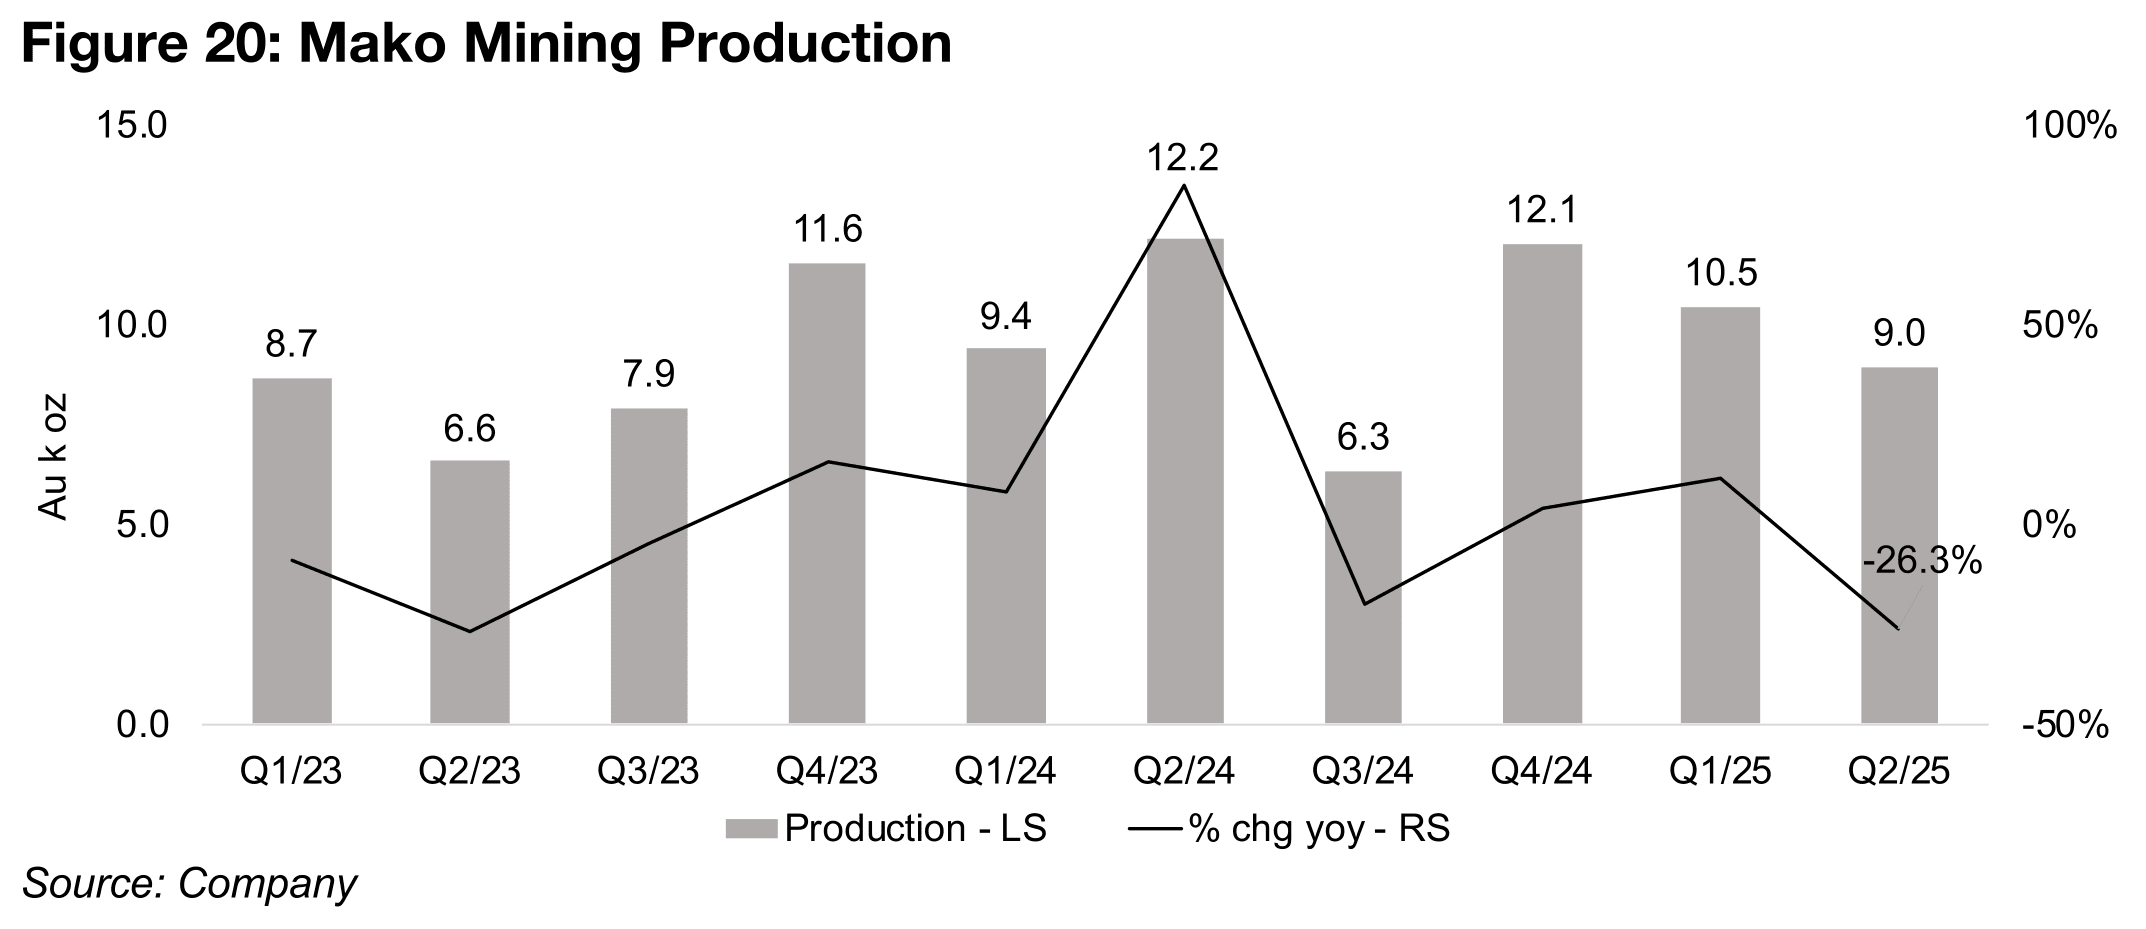
and Mako Mining announced Q2/25 production (Figure 18).
Thor Exploration’s production rose 25.9% yoy to 22.8k oz Au, although output qoq
was flat, and revenue jumped to US$82.5mn as the full effect of the rising gold price
was realized as the company had exited its hedges for the metal price in the previous
quarter (Figure 19). Mako Mining’s production declined -26.3% yoy to 9.0k oz Au,
with Q2/24 particularly strong, with 12.2k oz Au of output, and there was a -14.4%
decline qoq from 10.5mn oz Au in Q1/25. While the majority was from the company’s
San Albino mine, at 10.1mn oz Au, there was also a contribution of 1.4mn oz Au from
the newly acquired Moss Mine. Even with the decline in production, revenue rose to
a record US$38.1mn on the substantial yoy rise in the gold price. The company also
reported the release of $1.5mn in collateral related to previous creditors of the Moss
Mine and a cash balance of $28.6mn.
Disclaimer: This report is for informational use only and should not be used an alternative to the financial and legal advice of a qualified professional in business planning and investment. We do not represent that forecasts in this report will lead to a specific outcome or result, and are not liable in the event of any business action taken in whole or in part as a result of the contents of this report.
Author
Ben McGregor authors the Weekly Roundup at CanadianMiningReport.com, providing sharp analysis of the metals and mining sector. With a talent for spotting trends, Ben distills complex market shifts into clear, engaging insights on TSXV junior miners. His weekly updates cover gold, copper, uranium, and more, blending data-driven perspectives with a knack for identifying opportunities. A vital resource for investors, Ben’s work navigates the dynamic junior mining landscape with precision.