
February 03, 2025
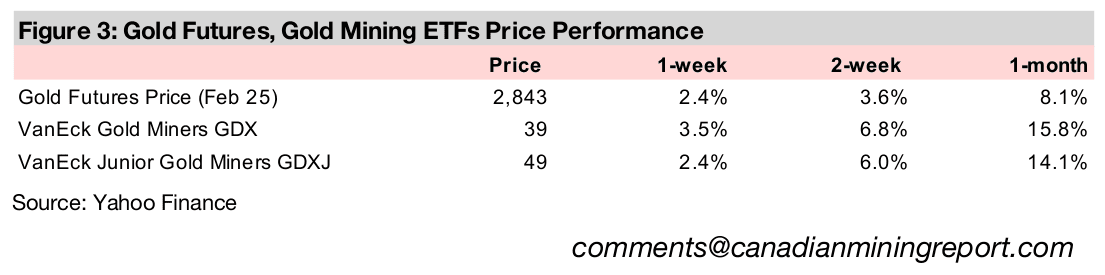
Gold rose 2.4% to US$2,843/oz, breaking through another benchmark, as the rising risk from the sudden eruption of a trade war and an equity market shock from China AI offset the downward driver of a hawkish US Fed holding rates steady.
This week we look at the ongoing rotation out of US tech stocks, recently catalyzed by the new low-cost AI developed in China and the potential effects of US tariff hikes, including for mining, which has prompted retaliation from Canada and Mexico.
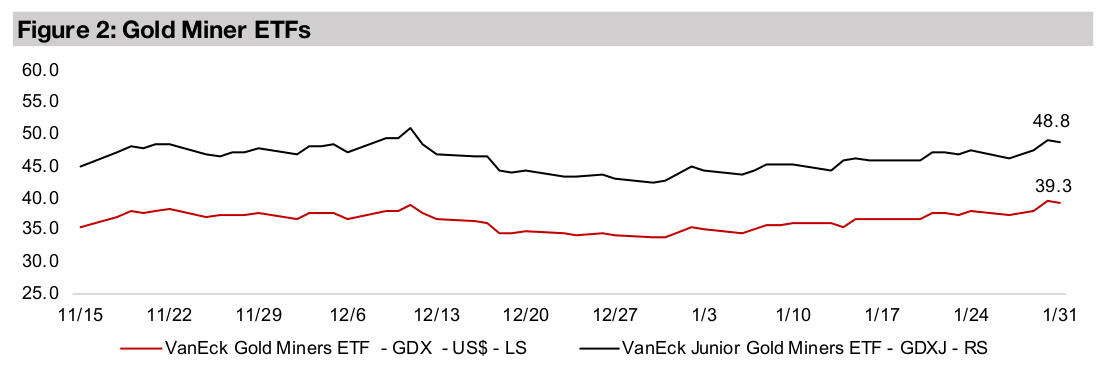
The GDX and GDXJ rose 3.5% and 2.4%, with the former back near the most recent December 2024 highs and the latter almost there, outpacing equities, which recovered from AI-induced volatility, with the S&P up 1.2% and Nasdaq gaining 2.0%.


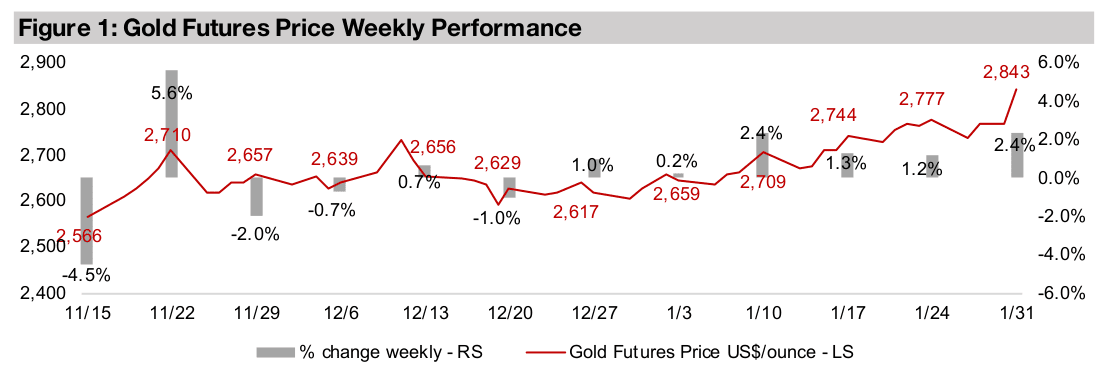
Gold rose 2.4% to US$2,843/oz, hurdling another key benchmark, even as the US
Fed paused interest cuts at its meeting this week and maintains a relatively hawkish
stance. This could keep US rates high versus other countries that are in still in a
cutting cycle, leading to a potential rise in US yields and the US$, which both tend to
move inversely to the gold price. Holding rates flat also implies a slowdown in rate of
money supply expansion, which we view as the core underlying driver for the gold.
However, these negative drivers could have been offset by the start of a full-blown
trade war this week, with tariffs spiking, which is generally considered inflationary.
There also could have been a move into gold as a safe haven on the strong volatility
in equities mid-week, on news of potential disruption to the artificial intelligence
industry, which has been a key driver of markets over the past year. However, much
of these initial losses were recovered by the end of the week, with S&P up 1.2%, the
Nasdaq gaining 2.0% and Russell 2000 down -0.1%. The gold stocks increased, with
the GDX ETF of producers up 3.5% and GDXJ of juniors rising 2.4%, with the former
near recent highs reached in December 2024 and the latter nearly there.
The mid-week dip in markets was driven by Chinese artificial intelligence company DeepSeek’s release of a more cheaply developed AI using much less chip capacity than the current US competitors. This led to a slump in US AI companies, with NVIDIA, which develops AI chips, taking a particularly big hit, dragging down the tech sector. This has not been tech’s first bout of volatility over the past year, with it weakening from July to September 2024, plateauing over the past two months, and struggling to get back to even from the middle of last year, with only a 6% gain (Figure 4).
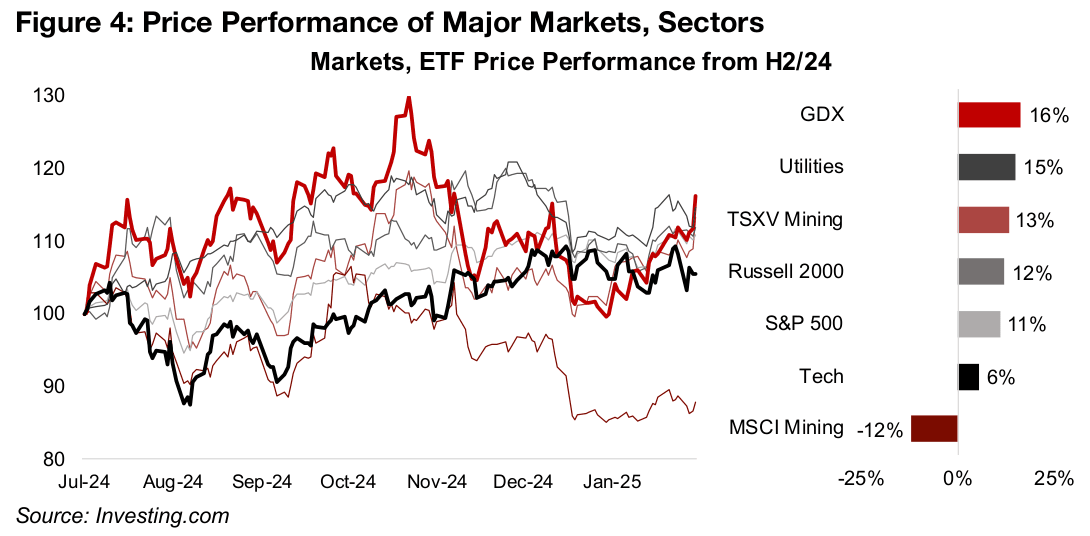
This has been far below the 16% and 15% gains, respectively, in the GDX ETF of
gold producers and utilities sector, since July 2024, with both considered heavily
defensive sectors. This would seem to indicate a fundamental shift in the markets
over the past year towards more hedging of risk, especially compared to 2023. The
markets are still taking on risk, however, just more outside of tech, shown by the 12%
gain in the small cap Russell 2000 index, and the 11% rise in the S&P 500. The S&P
500 had been heavily reliant on tech for gains in recent years, and its outperformance
of tech also indicates a move into other sectors. This puts H2/24 in distinct contrast
to 2023 and H1/24 for tech, when it was still far outperforming other sectors.
Interestingly even the particularly risky TSXV Mining sector is ahead of tech, up 13%.
While support will have come from the heavy weighting to the gold sector, it has also
likely partly been from the broader move into small caps, and markets generally
seeking out lower valuations outside of tech. While the iShares MSCI Global Metals
& Mining ETF has underperformed, down -12%, this has been mainly because of its
high weighting to companies with a heavy exposure to a slumping iron ore price.
The decline in this index, driven by metals moved mainly by the industrial cycle, and
rise in the GDX ETF, driven mainly by monetary factors, highlights the clear split in
the market between their support for these two main themes. These moves seem to
be indicating a market expecting inflation and risk overall to rise and continue to drive
up gold, but economic growth to slow. The performance of TSXV Mining has been in
between these extremes, as it has low iron ore exposure, but its heavy gold stock
weighting is offset by a large contribution from copper stocks, which are down on a
stagnating metal price, and declining lithium stocks, as the metal continues to slide.
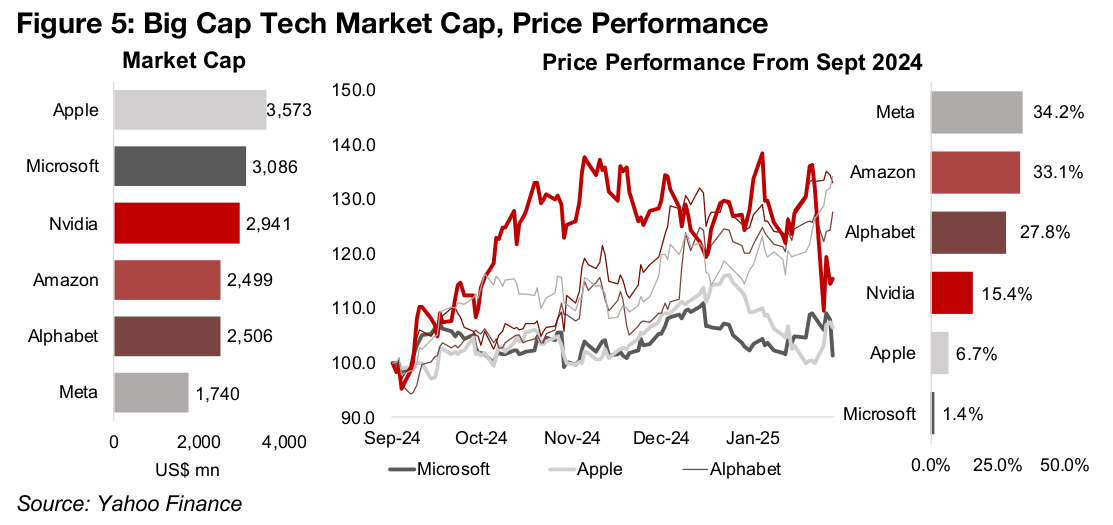
While the slide in tech this week has largely come from Nvidia, with its share price
plunging 3.8%, even as other equities recovered, the tech weakness since mid-2024
has been more broad-based. Both Apple and Microsoft, which had been major
drivers for the market, are up just 6.7% and 1.4% since July 2024, and Nvidia’s gains
have come down to just 15.4% (Figure 5). With these three alone comprising nearly
20% of the S&P 500, their continued weakness could be a huge issue for a continued
tech-led bull run (Figure 6). While Meta, Amazon and Alphabet have gained, up 34.2%,
33.1% and 27.8%, respectively, since H2/24, combined they are only 13% of the
index, and may not be enough to offset a decline in the big three.
So, while it looks the tech boom is finally ending, we note that we had ‘counted tech
out’ a couple of times last year, only to have the sector come roaring back, so this
remains a risk. However, we believe the probability of such a scenario has declined
significantly, as last year there was certainly no huge industry shift suddenly
threatening the Nvidia AI story and Apple and Microsoft continued to post strong
earnings growth and major stock gains.
Any rotation out of tech and into almost any other sector has been long overdue, and
actually has not really been an Nvidia induced phenomenon, but rather been an
imbalance in the making for about a decade. Tech valuations have surged to
extremely high levels, even accounting for the sector’s superior earnings growth.
While most other sectors in the US and other global markets are not that expensive,
which could encourage a rebalancing of the weighting between sectors, it remains to
be seen if such a rotation can entirely offset a tech decline.
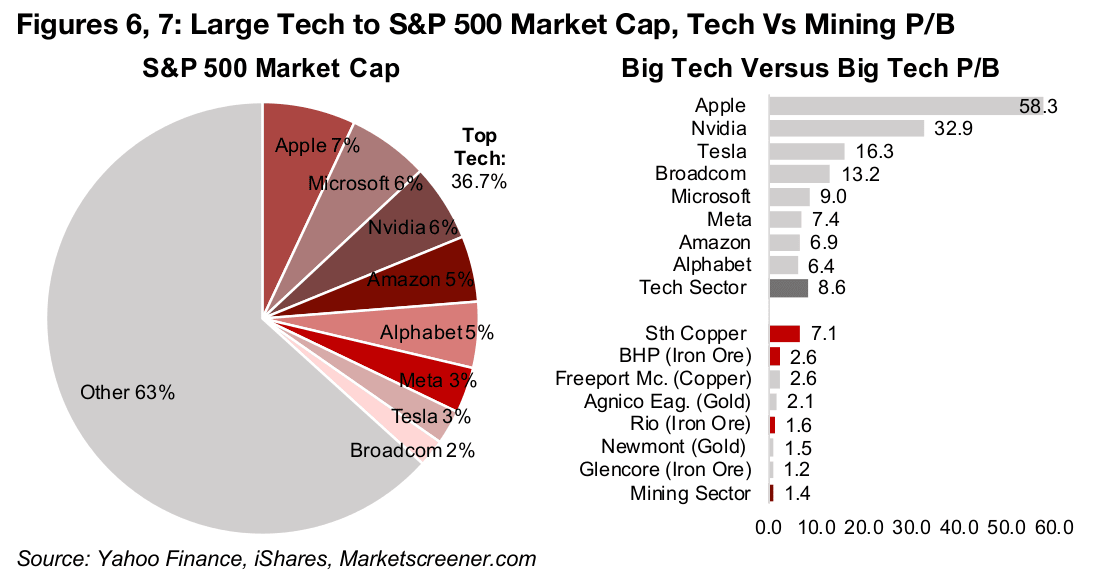
The mining sector could be a beneficiary of such a shift, as the P/B of Global Metals
& Mining is at just 1.4x, compared to 8.6x for tech (Figure 7). Only Southern Copper
has a clearly high P/B, at 7.1x, and that still would only put it near the bottom of the
tech sector valuations. The next highest P/Bs for BHP and Freeport McMoran at 2.6x
are still only moderate, and the rest of the sector trades at around 2.0x or lower. If
the valuations of most of the big mining stocks were to fall much further, they would
be heading for a 1.0x P/B, which is considered inexpensive for firms not in obvious
financial distress. None of these mining giants are at all in such a dire situation.
This doesn’t mean that mining sector couldn’t move lower if there is a slowdown in
economic growth, but that it does have a considerable cushion with some negative
scenarios already priced into the low multiples. This especially contrasts with some
very upbeat assumptions that seemed to be priced into tech valuations and seems
to indicate somewhat of a disconnect between the two sectors. The market is
basically saying that tech growth will not put pressure on the natural resources that
back the industry at quite a fundamental base level. To expand the tech sector to the
levels implied by the current valuations would certainly require more copper,
aluminum, silver, nickel, lithium, lead, platinum, palladium.
The US government shocked markets this week by announcing an across-the-board
25% tariffs on Canada and Mexico, and 10% on China, which would start
immediately. The level and speed of the implementation of these hikes came as a
surprise as it had been widely expected that there would be a longer period of
negotiations. While there were hopes for exemptions especially for US large oil and
other energy imports from Canada, even these are expected to face 10% tariffs. Both
Canada and Mexico quickly responded with retaliatory trade measures.
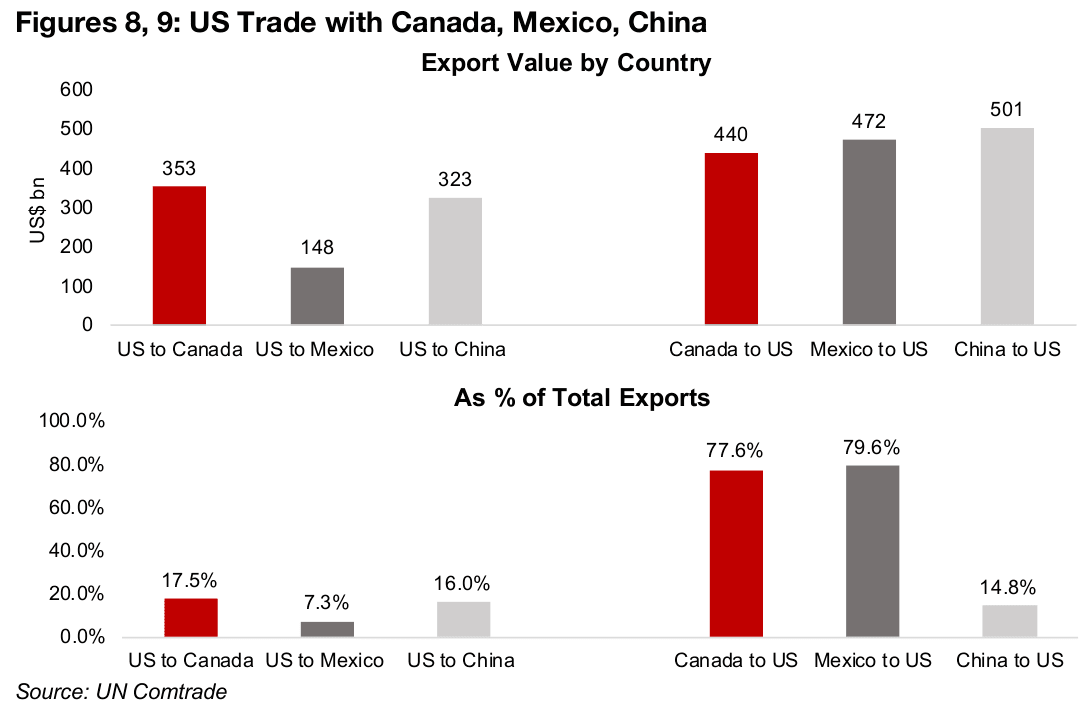
The US does have considerable leverage with Canada and Mexico on trade. For US-
Canada trade, the absolute level of trade is not particularly imbalanced, with US
exports to Canada at US$353bn and imports from the country at US$440bn (Figure
8). However, exports to Canada are just 17.5% of total US exports, while Canadian
exports to the US are 77.6% of the total, meaning that Canada is far more reliant on
the US as an export market than the US is on Canada (Figure 9).
US trade with Mexico is less balanced, with the US exporting US$148bn and
importing almost three times this level, at US$472bn. US exports to Mexico are also
just 7.4% of the total, while Mexico’s exports to the US are 79.6% of the total. US
trade with China is somewhat imbalanced, with US$323bn of exports and US$501bn
of imports. However, the US is a much smaller market for Chinese exports, at only
14.8% of the total, roughly even with China’s percentage of US exports, at 16.0%.
This relative lack of leverage in trade with China may partly explain the relatively low
10% increase in tariffs for the country.
The US also has one of the lowest average trade weighted import tariffs of the largest global economies, at just 2.2%, with only Japan below it, at 2.2% (Figure 10). The average tariffs of China, Canada and Mexico are 3.0%, 3.4%, and 3.9%, which does give the US support for claims that its tariffs are too low in a global context. While Mexico has not outlined specific retaliatory trade measures yet, Canada has provided details on its plans, with 25% tariffs to be placed on US$106bn of goods, about a third of US exports to the country.
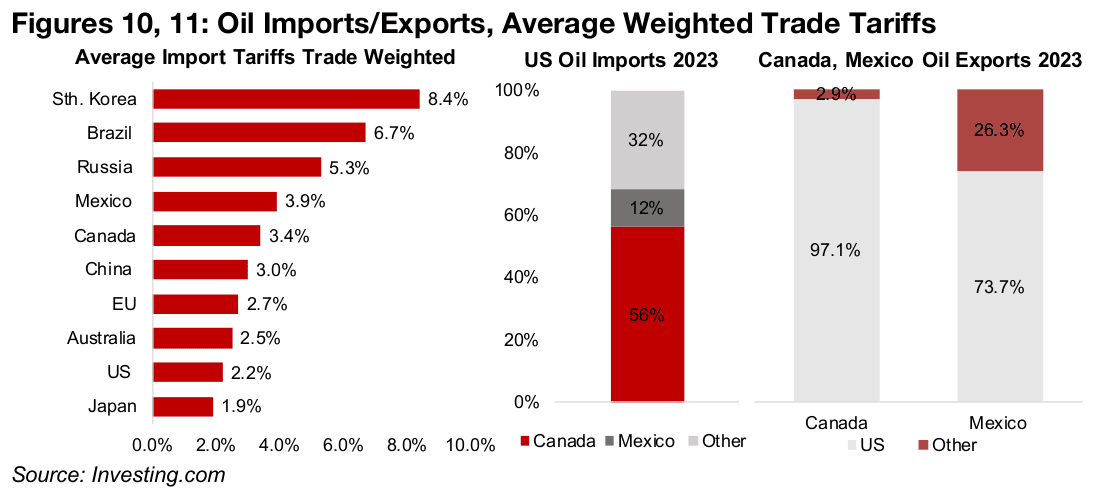
The lower potential tariffs on oil seem to arise from Canada and Mexico actually
having a degree of leverage in this sector, accounting for 56% and 12% of total US
crude petroleum imports (Figure 11). However, the US is still certainly not without
bargaining power for these products, as by far the majority of crude oil exports for
both Canada and Mexico are to the US, at 97.1% and 73.7% of the total.
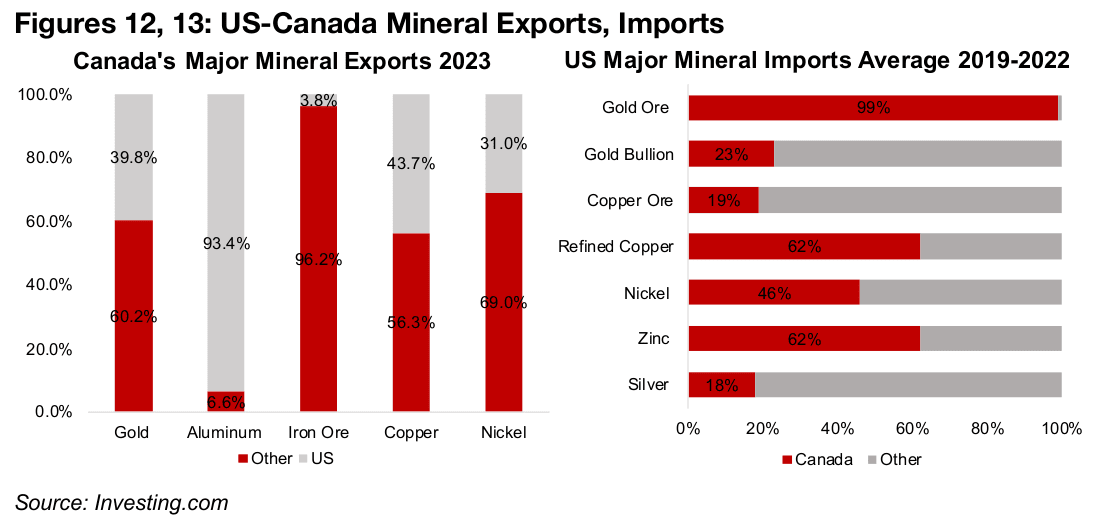
For the mineral sector, there is major trade between the US and Canada, and the
sector is likely to be heavily affected by the tariffs on both sides. The US is the largest
export market for Canada’s gold, iron ore, copper and nickel, and the US imports
most of its gold ore, refined copper, nickel, and zinc, and a large proportion of its
gold bullion, copper ore, and silver, from Canada (Figures 12, 13).
A major question now is what could drive a reduction in these tariffs? The Trump administration seems to have two main demands on both Canada and Mexico at the root of the trade war, which is to stop both illegal immigration and illicit drugs movements across their borders into the US. Presumably once there is clear evidence that the flow of both of these have been curtailed some relaxation of tariffs could follow. However, this would of course require the US to once again take the lead on such reductions, and then have to assume that the other side would respond in kind and not keep tariffs elevated. Even if it does prove possible for Canada and Mexico to solve these issues, it would take considerable time, indicating that these high tariffs will likely remain in place for the next few years.
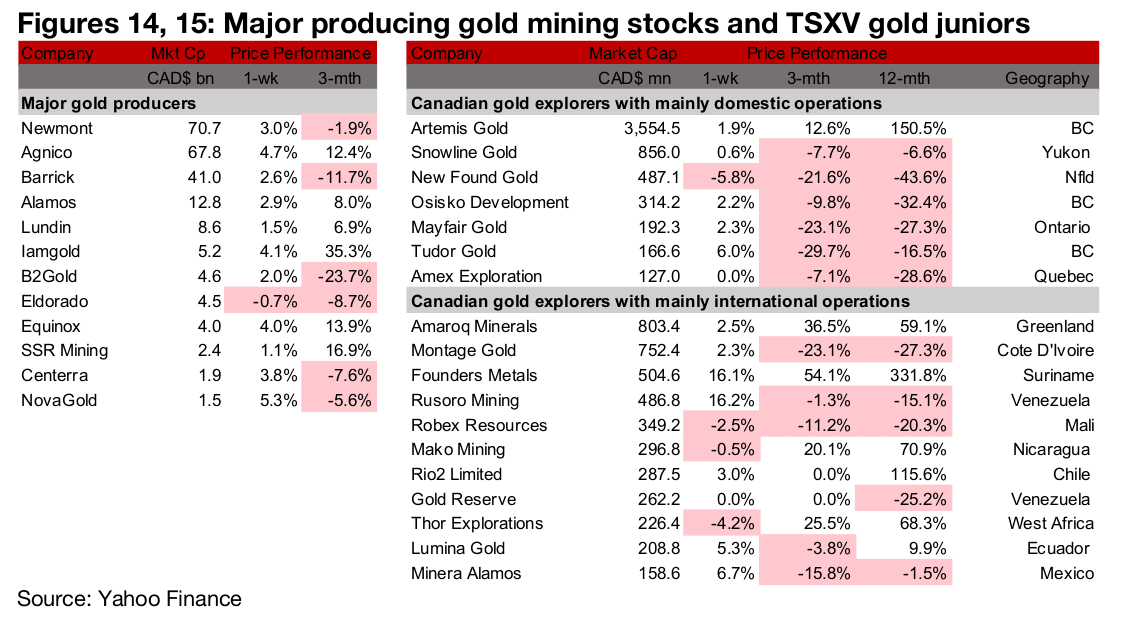
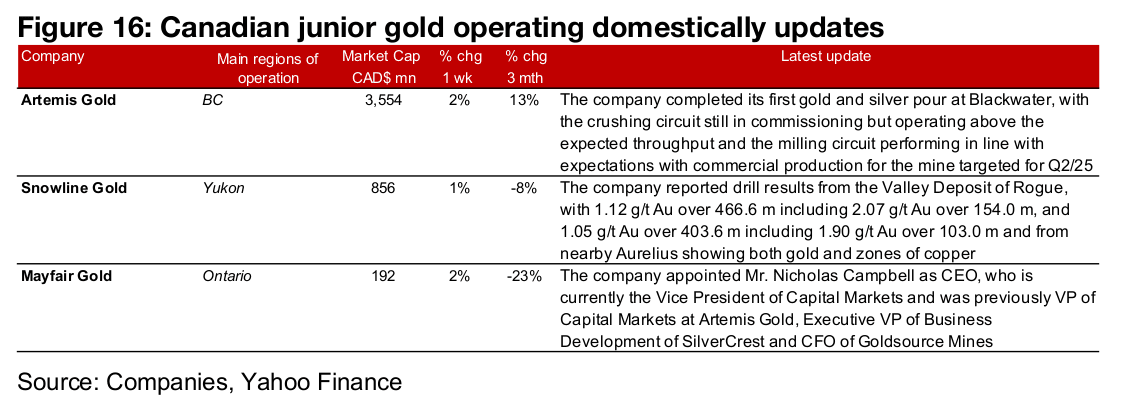
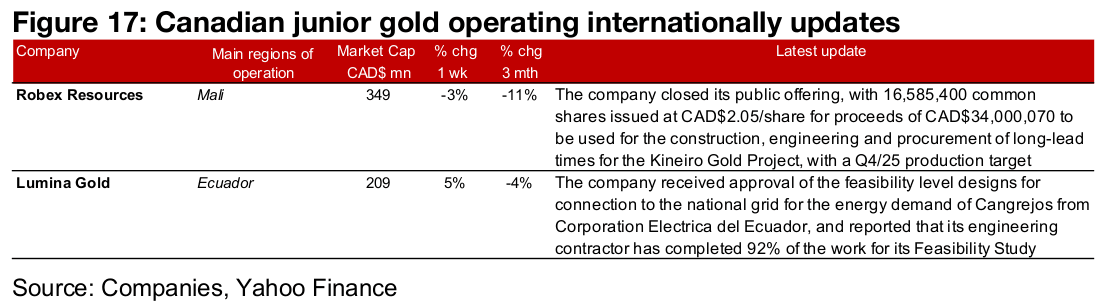
All the large gold producers but one, and most of TSXV gold, rose on the increase in the metal price (Figures 14, 15). For the TSXV gold companies operating domestically, Artemis completed its first gold pour at Blackwater, Snowline reported drill results from Valley at Rogue and Aurelius and Mayfair Gold appointed Mr. Nicholas Campbell as CEO (Figure 16). For the TSXV gold companies operating internationally, Robex closed its public offering and Lumina received approval of feasibility level designs for connection to the national grid in Ecuador (Figure 17).
Disclaimer: This report is for informational use only and should not be used an alternative to the financial and legal advice of a qualified professional in business planning and investment. We do not represent that forecasts in this report will lead to a specific outcome or result, and are not liable in the event of any business action taken in whole or in part as a result of the contents of this report.
Author
Ben McGregor authors the Weekly Roundup at CanadianMiningReport.com, providing sharp analysis of the metals and mining sector. With a talent for spotting trends, Ben distills complex market shifts into clear, engaging insights on TSXV junior miners. His weekly updates cover gold, copper, uranium, and more, blending data-driven perspectives with a knack for identifying opportunities. A vital resource for investors, Ben’s work navigates the dynamic junior mining landscape with precision.