
December 11, 2023
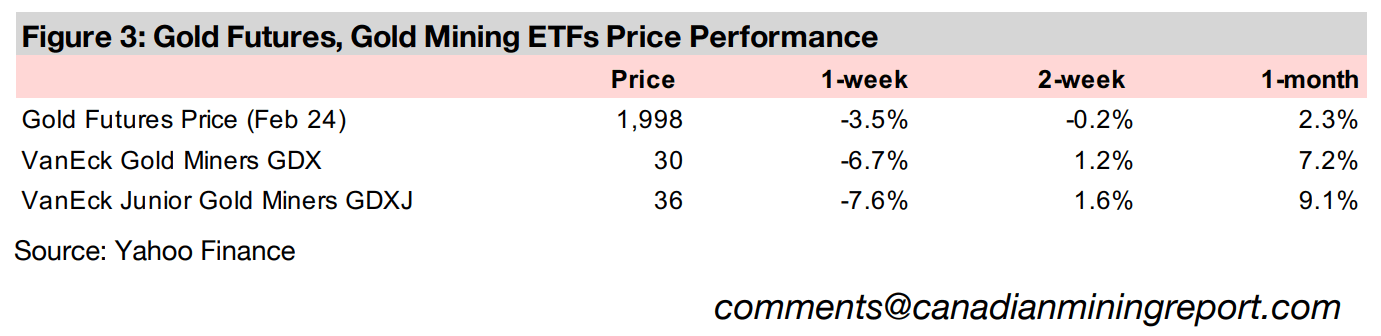
Gold declined -3.5% to US$1,998/oz, but the spot price closed at US$2,030/oz, holding above the critical US$2,000/oz level for eleven consecutive days, its longest stretch ever, with most historical moves above this benchmark lasting a single day.
Gold stocks dropped with the GDX down -6.7% and GDXJ losing -7.6% as the US equity market rose with the S&P 500 gaining 0.88%, the Nasdaq up 0.45% and Russell 2000 adding 1.27%, while TSXV larger gold stocks were mostly down.


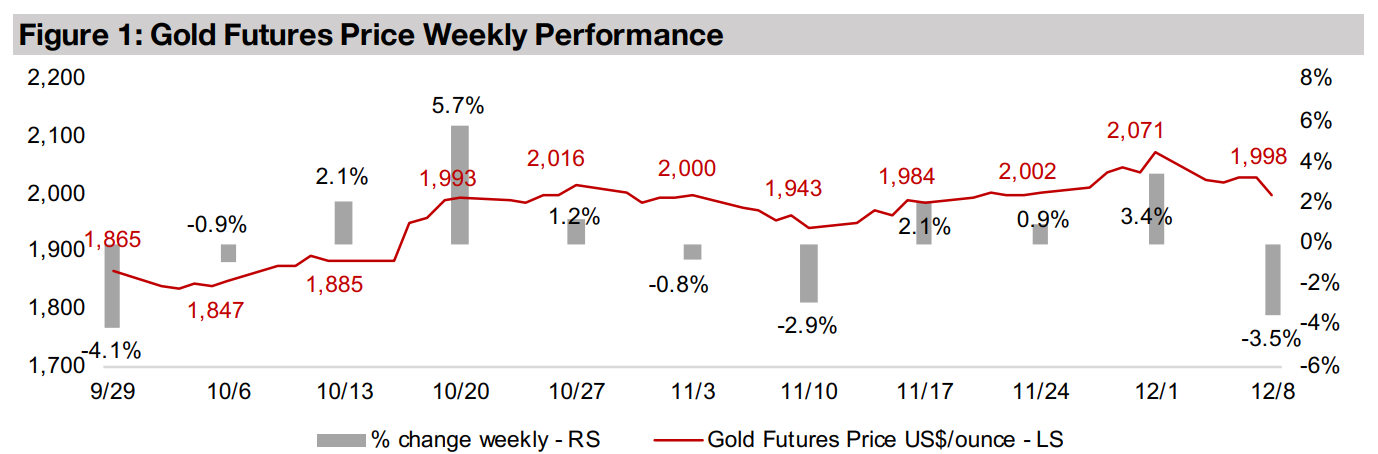
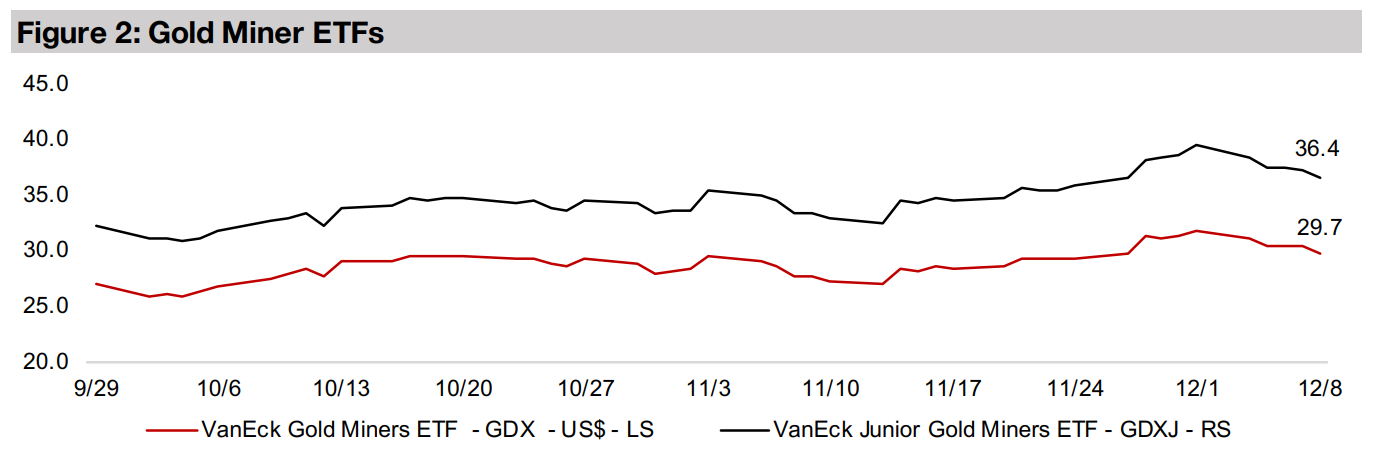
While the gold futures price dipped -3.5% to US$1,998/oz, just below the key US$2,000/oz level, the spot closed at US$2,030/oz, down just -2.0%, making it the longest ever run above this benchmark at eleven consecutive days. The US stock markets rose moderately, and there has been recent evidence of a rotation away from tech which had been leading the equity charge this year. This was reflected in the 0.88% gain in the S&P 500 and 1.27% rise in the Russell 2000 small index, while the Nasdaq was up just 0.45%. For gold stocks, the rise in equities was not enough to offset gold’s drop, with the GDX down -6.7% and the GDXJ losing -7.6%.
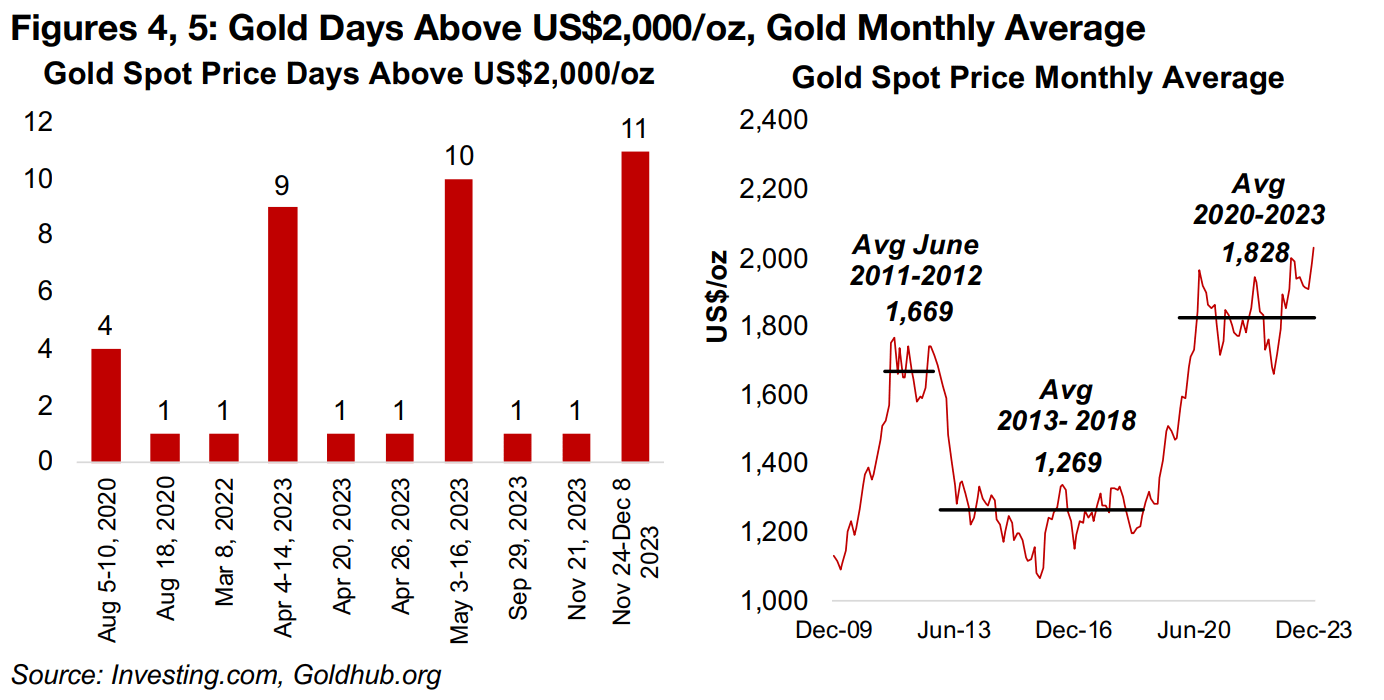
There have only been ten times when the gold spot broke through US$2,000/oz, with
six only lasting a day (Figure 4). The other periods where gold held this level for an
extended time were during extreme crises, with four days at the peak of the global
health crisis fears in August 2020 and a nine and then ten-day run in April and May
2023 in the wake of the banking crisis. The big question is now whether gold can
break out of a four-year trading range around an average of US$1,828/oz, on both
political and economic drivers (Figure 5).
In terms of geopolitical risk, it does not appear that the conflict in the Middle East will
be resolved soon, and it also has scope for a wider contagion outside the region,
which could boost gold. In terms of economic drivers, a period of aggressive rate
hikes from global central banks is widely believed to ending, and gold tends to gain
with easier monetary policy. There are also expectations for a global recession
heading into 2024, which could see gold benefit on a flight to safety.
To the downside for gold would be a resurgence in inflation which would prevent
global central banks from cutting rates significantly. Two negative drivers for gold
would actually come in the form of good news, with one being a global economy that
does not fall into recession but has decent growth with moderate inflation. The other
would be a cooling of geopolitical tensions, which could seek gold lose some of its
risk premium. Overall, we see the probabilities weighted more towards an
economically and geopolitically difficult 2024, and the likelihood of a rise in gold.
In recent weeks we have looked at many indicators showing a market that has turned
very negative on the metals and mining sector over the past year, especially in
contrast to the extreme bullishness and high multiples for the US large cap tech
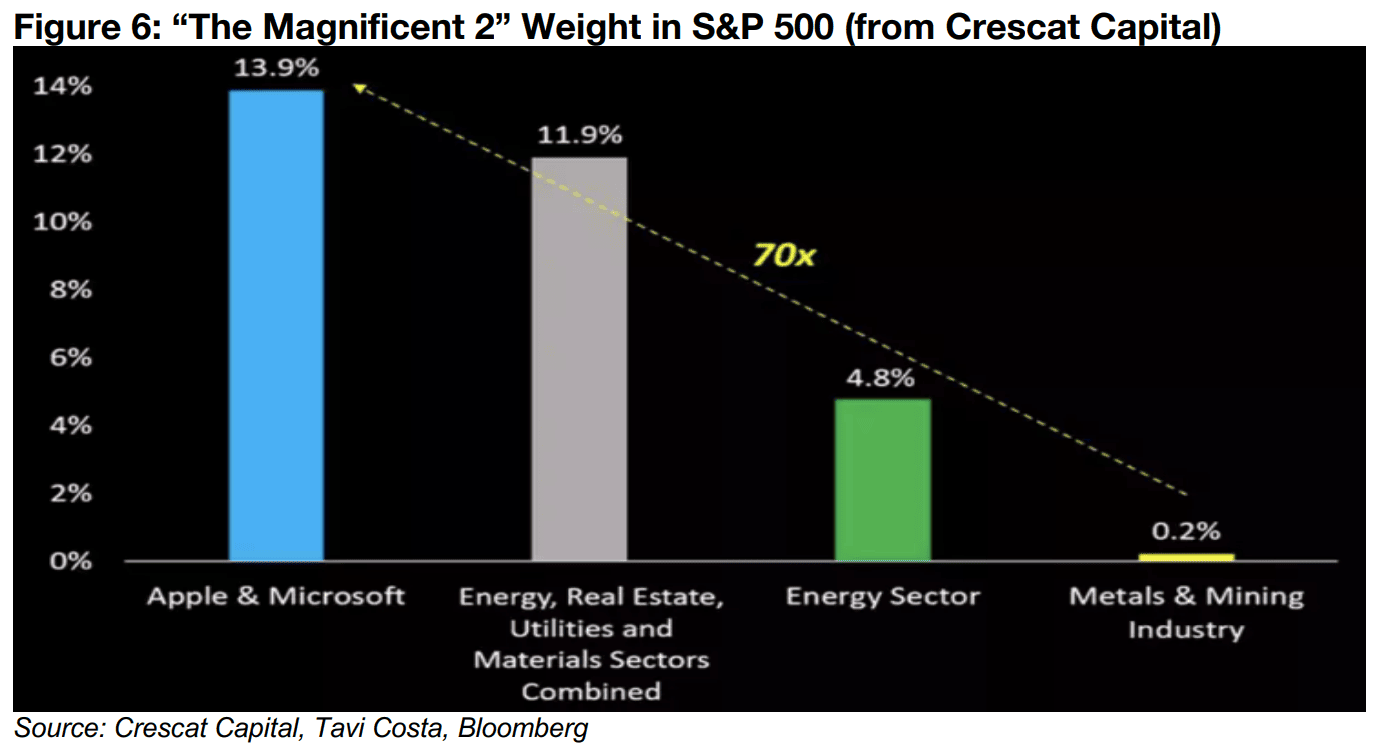
sector. Crescat Capital has provided yet another data point illustrating this extreme
disparity, showing that the weighting of just two tech stocks, Apple and Microsoft,
now comprise 13.9% of the market cap of the S&P 500, or seventy times the 0.2%
weighting of the entire S&P 500 Metals and Mining sector (Figure 6).
The weighting of these two tech stocks is also just above the combined weighting of
the S&P 500 energy, real estate, utilities and materials sectors at 11.9%, and is nearly
three times the weighting of the S&P energy sector at 4.8%. This imbalance seems
likely to be eventually corrected, potentially involving a plunge in the valuation of the
tech stocks. However, it could also involve some rotation into an overlooked metals
and mining sector, with the valuations already seeming to price in a hit to the base
metals side of the industry from a possible recession.
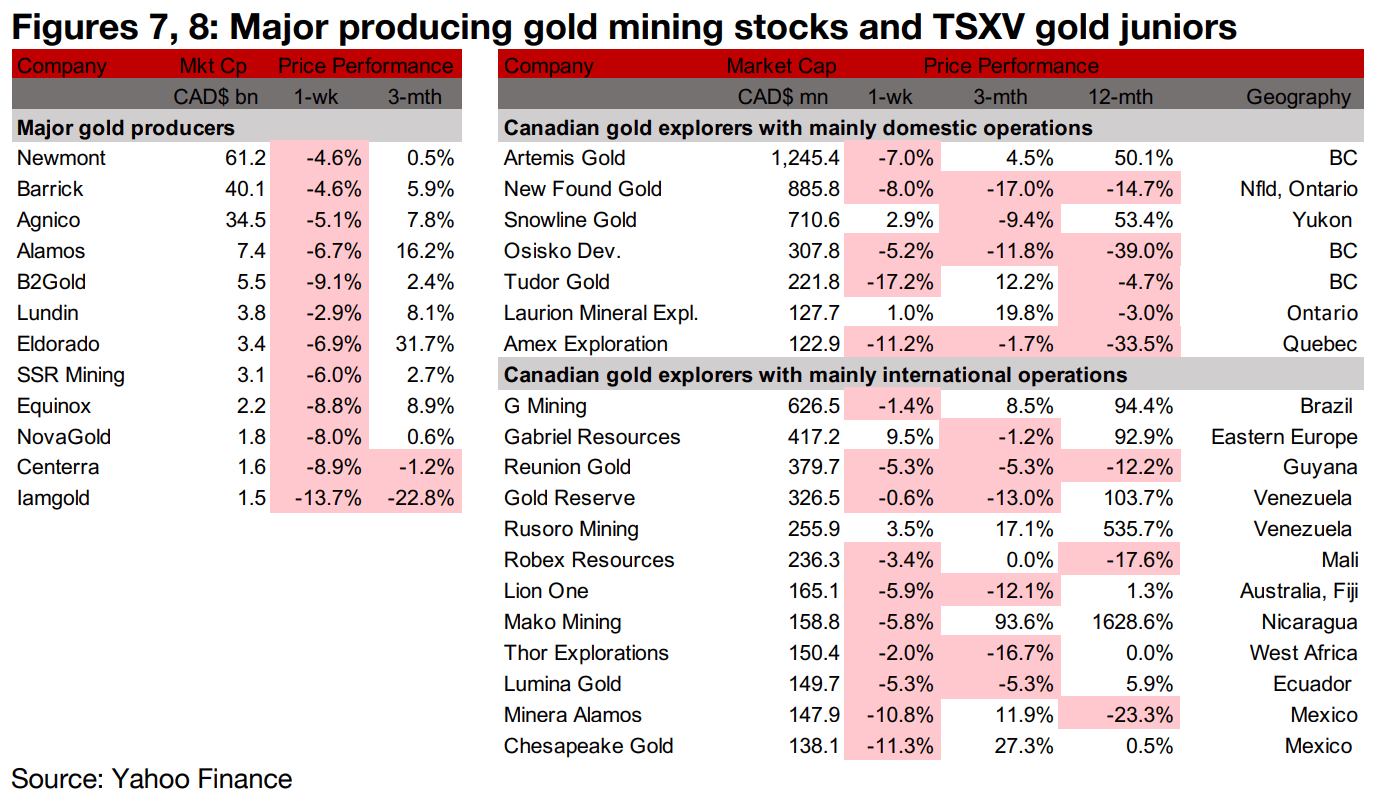
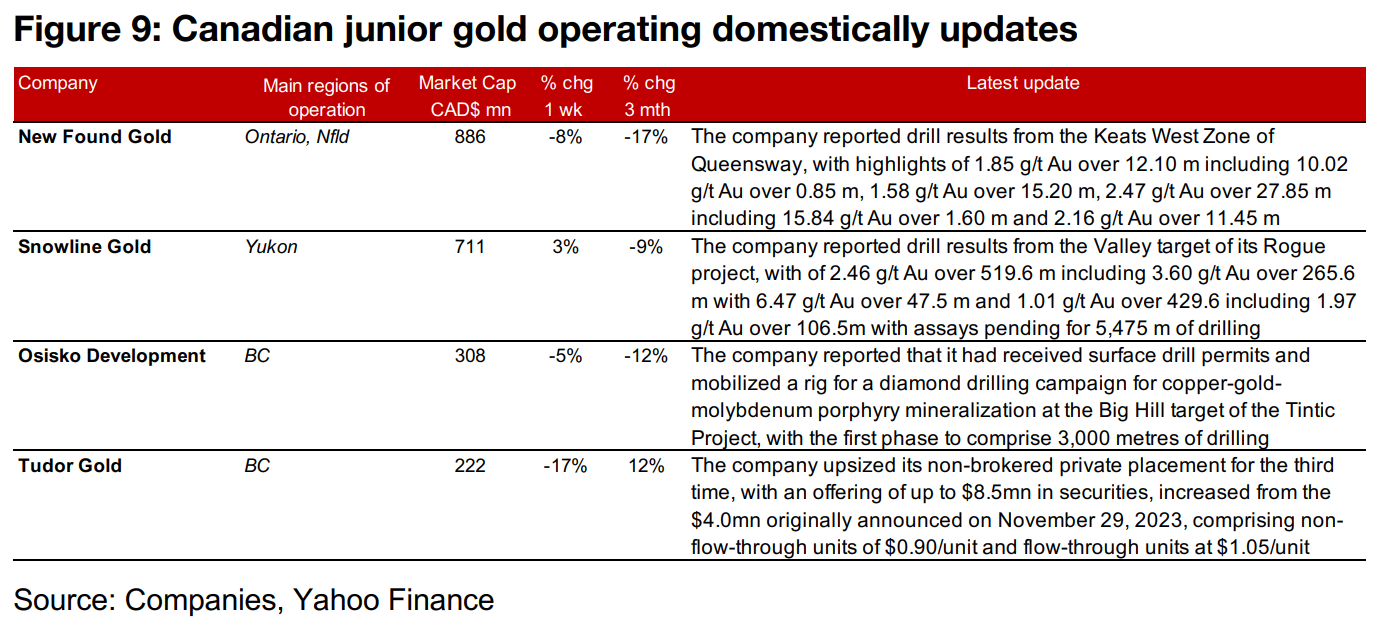
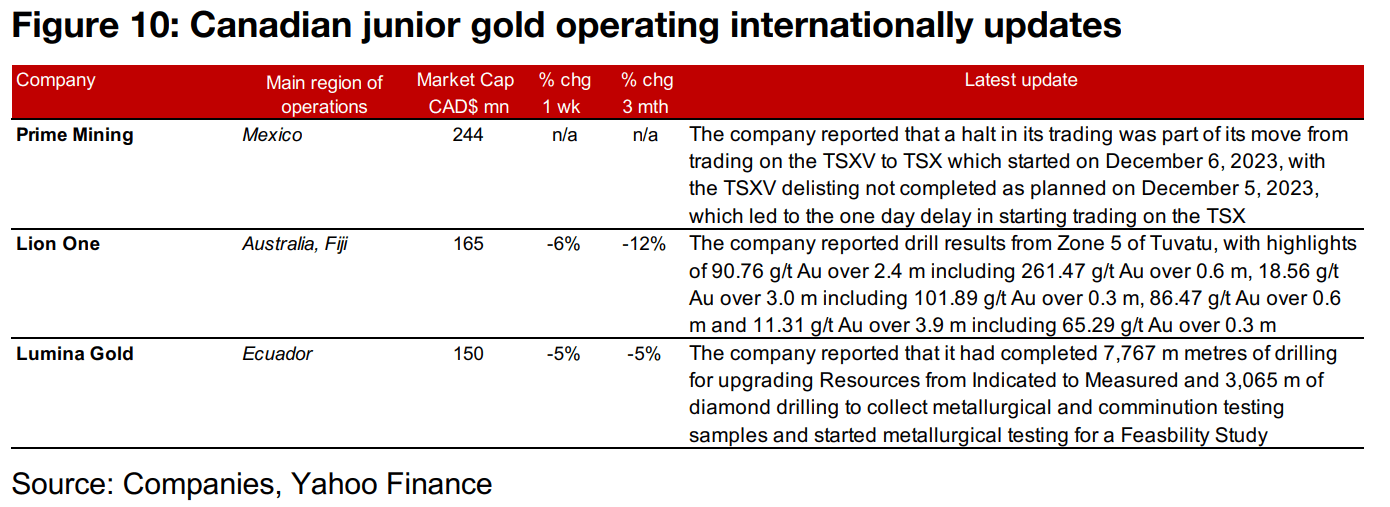
The major gold producers and most larger TSXV gold stocks dropped on the fall in the gold price (Figures 7, 8). For the TSXV gold companies operating domestically, New Found Gold reported drill results from the Keats West zone of Queensway, Snowline reported drill results from the Valley target of Rogue, Osisko Development started a drill program at the Big Hill target of Tintic and Tudor Gold upsized its private placement a third time to CAD$8.5mn (Figure 9). For the TSXV gold companies operating internationally, Prime Mining saw a trading halt related to its shift from the TSXV to the TSX, Lion One reported drill results from Zone 5 of Tuvatu and Lumina announced the completion of a drilling and metallurgical program (Figure 10).
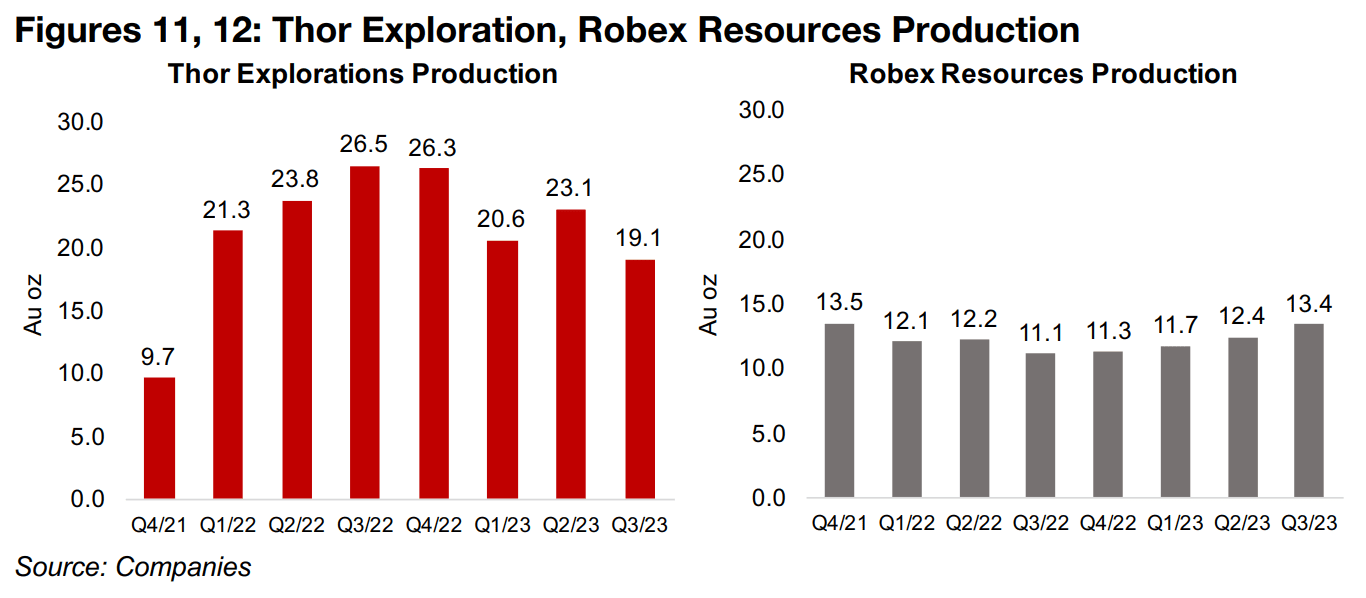
Thor Explorations’ production down, Robex Resources’ output rises
The larger TSXV producers have now all reported Q3/23 results, with a mixed
performance for the group. The largest producer is Thor Explorations, with output
from its Segilola mine in Nigeria at 19.1k oz Au in Q3/23, down -28% year on year
from 26.5k oz Au in Q3/22 (Figure 11). The decline occurred as the company was
mining some more difficult, lower grade, areas during the quarter, which reduced the
grade, but this was expected, and is now complete. Robex Resources has had an
average output around half the level of Thor over the past two years, and production
from its Nampala mine in Mali rose to 13.4k oz Au in Q3/23, up 21% yoy from 11.1k
oz Au in Q3/22 (Figure 12). This was driven by a 25.5% increase in processed tonnage,
with the grade of ore actually declining.
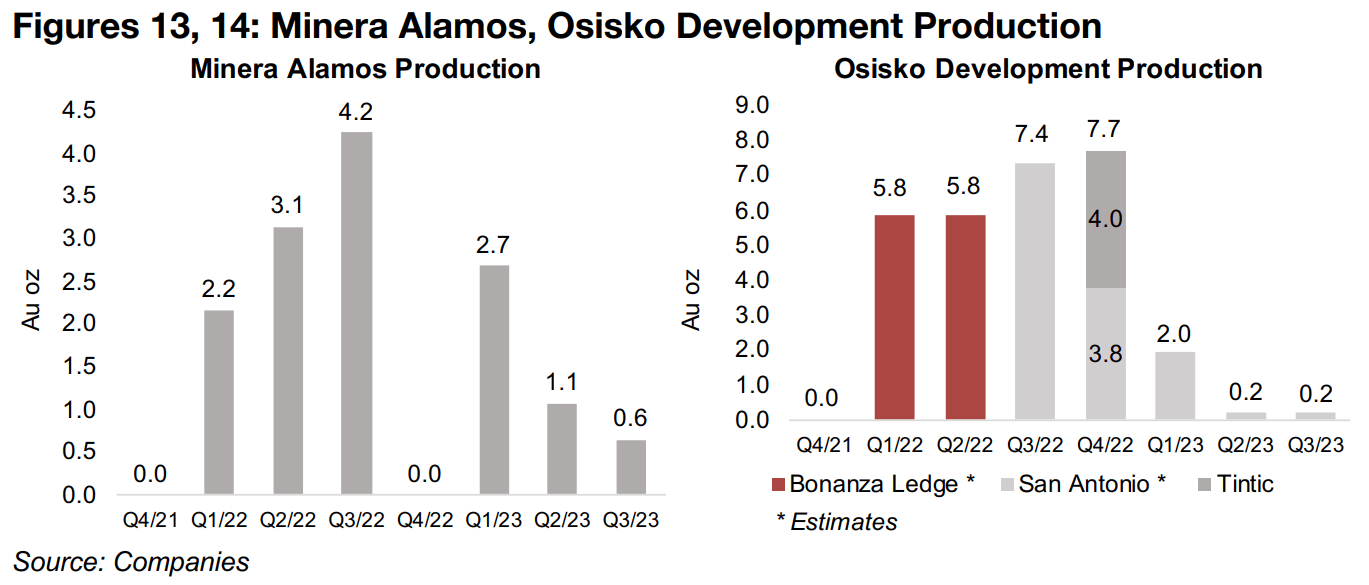
The other two TSXV producers do not actually have major output from any large scale project yet. Minera Alamos has small levels of pre-commercial production from its Santana mine in Mexico as it improves the mine to allow for full commercial operation. Just 636 oz of gold were sold from Santana in Q3/23, down 86% from 4.2k in Q3/22, with production dropping to zero in Q4/22 with an end of year operational shutdown (Figure 13). Osisko Development has reported short runs of production from three different projects recently; Bonanza Ledge from Q1/22 to Q2/22, which is now depleted, San Antonio, which is ongoing, and from Tintic in Q4/22. The exact quarterly amounts were not available for Bonanza Ledge or San Antonio, but we have backed out estimates based on some cumulative data (Figure 14). The cumulative data imply a low level of production from San Antonio over the past two quarters.
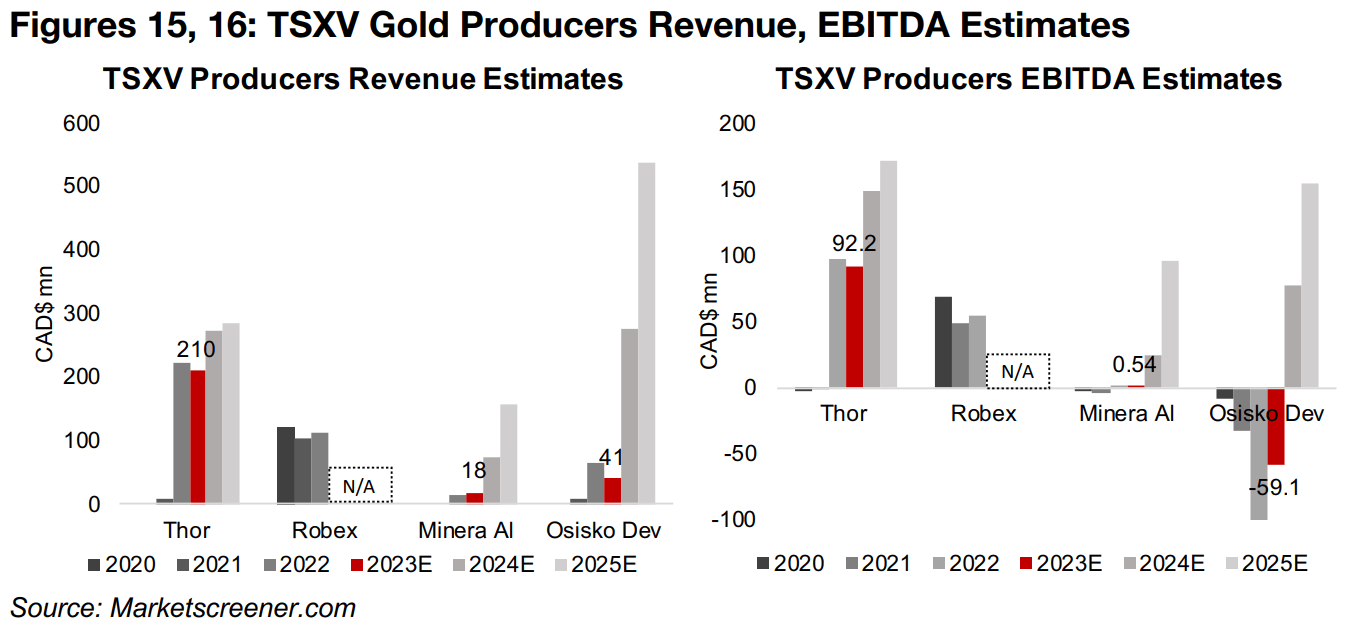
For Thor Explorations, the market is expecting a gradual increase in revenue, but
reasonably large jump in operating earnings (EBITDA) for 2024E and 2025E, from its
operations at Segilola (Figures 15, 16). Longer-term upside is expected from its Douta
project in Senegal, for which an updated Resource Estimate was released this year,
with a construction decision expected by 2024. Robex Resources does not have
consensus forecasts currently.
For Minera Alamos, a decent increase in revenue and profit is expected by 2024 as a
pad expansion for Santana this year is expected to triple the leaching capacity of the
project. However, the big jump in revenue and profit is forecast for 2025, as its Cerro
De Oro project in Mexico, with a 35% higher expected annual gold output than
Santana at full capacity, is expected to start production. For Osisko Development
there is an even bigger jump in revenue and operating profit expected for 2025, as its
large Cariboo project is forecast to have it first full year of production.
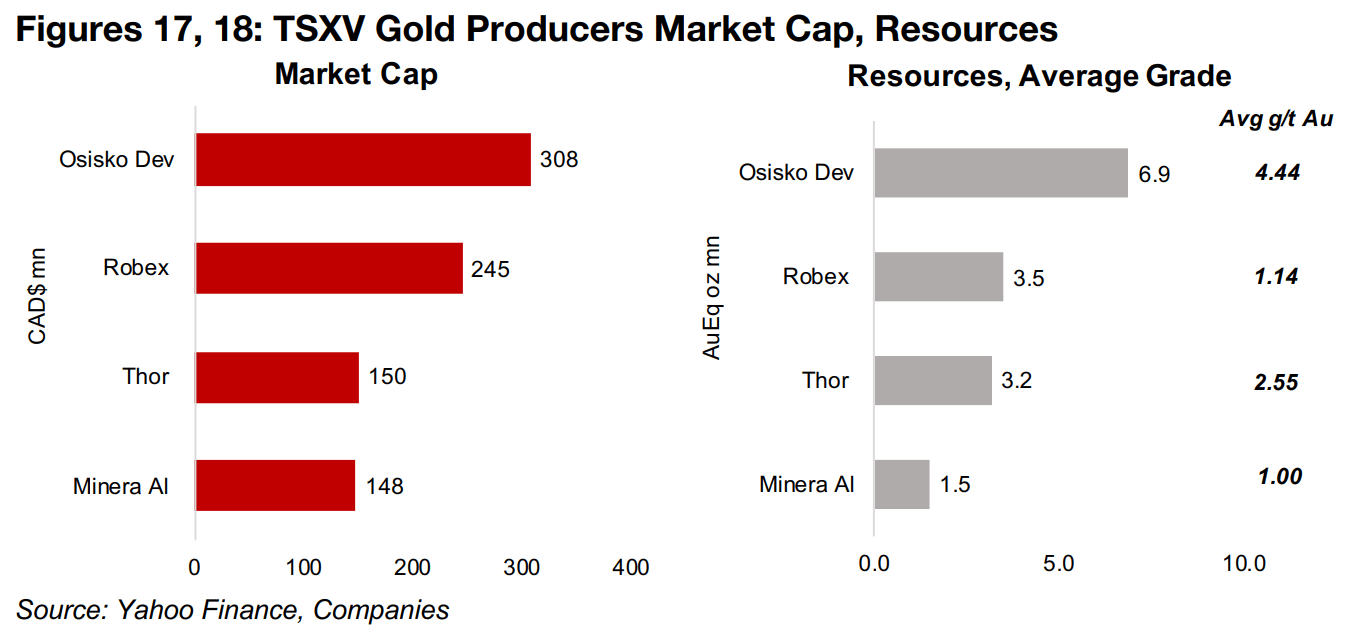
Osisko Development has the highest market cap of the TSXV producers at CAD$308mn, even with its low current output, given the high expected value for the Cariboo project and a more moderate potential contribution from the Trixie Mine (Figure 17). These projects give it the highest total resources of the group, at 6.9 m oz Au (Figure 18). Robex has the second largest market cap, at CAD$245mn and resources, at 3.5 mn oz, comprising the Nampala mine and the Kiniero project. Although Thor and Minera Alamos have similar market caps, at CAD$150mn and CAD$148mn, there is a large spread between their Resources of 3.2mn oz Au and 1.5mn oz Au, and average grades, of 2.55 g/t Au and 1.00 g/t Au.
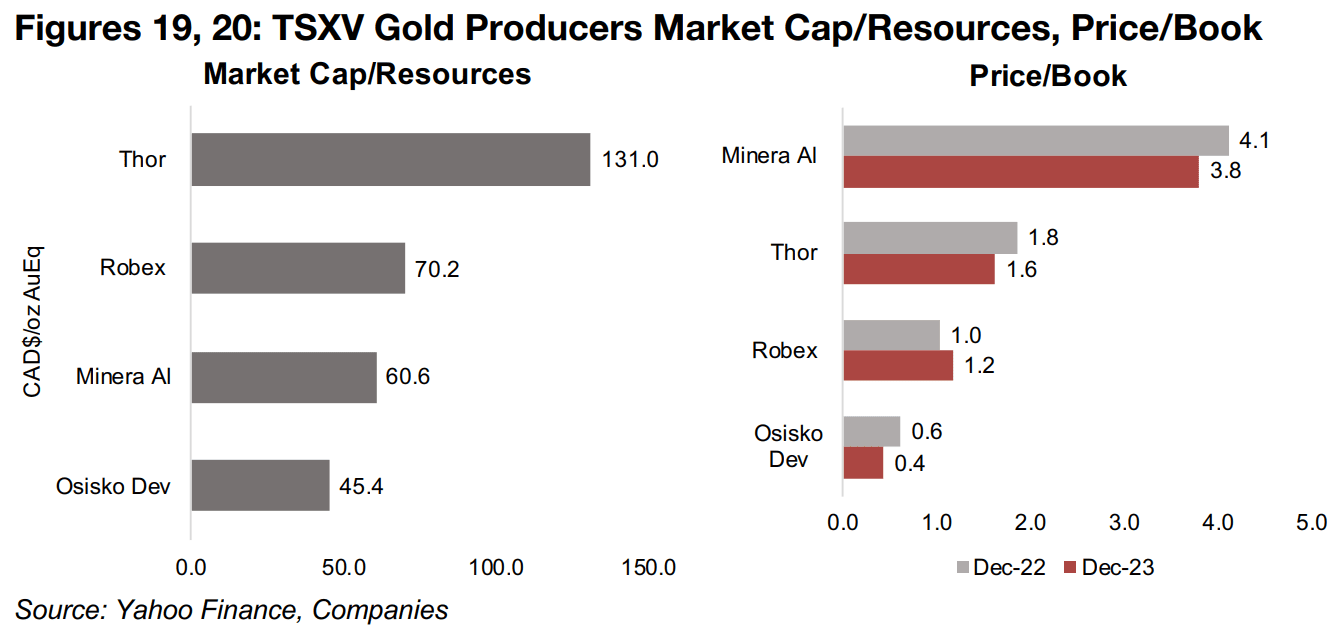
In terms of valuations, the market is paying the most for Thor by far, at CAD$131/oz
Au, given its reasonably high grade of 2.55 g/t Au and high current production levels.
Robex and Minera Alamos are in a closer range, at CAD$70.2/oz Au and
CAD$60.6/oz Au, given similar average grades of their Resources just above 1.0 g/t
Au (Figure 19). Osisko has the lowest Market Cap/Resource at CAD$45.4/oz, even
though it has a high average grade of 4.44 g/t Au. This figure has been skewed up by
a very high grade of Tintic project, which has much lower total resources than Cariboo.
While many TSXV gold stocks have struggled this year with considerable declines in
their share prices and valuations, the price to book (P/B) valuations of the large TSXV
gold producers have moved only moderately. The P/Bs of Minera Alamos, Thor and
Osisko Development have declined, but only slightly, while Robex’s multiple has
actually risen on its increase in production this year (Figure 20). These valuations have
likely been supported to varying degrees by these companies’ cash generation, giving
them a lower risk of continuing to fund their operations compared to entirely pre-production junior miners that must raise funds in increasingly difficult capital markets
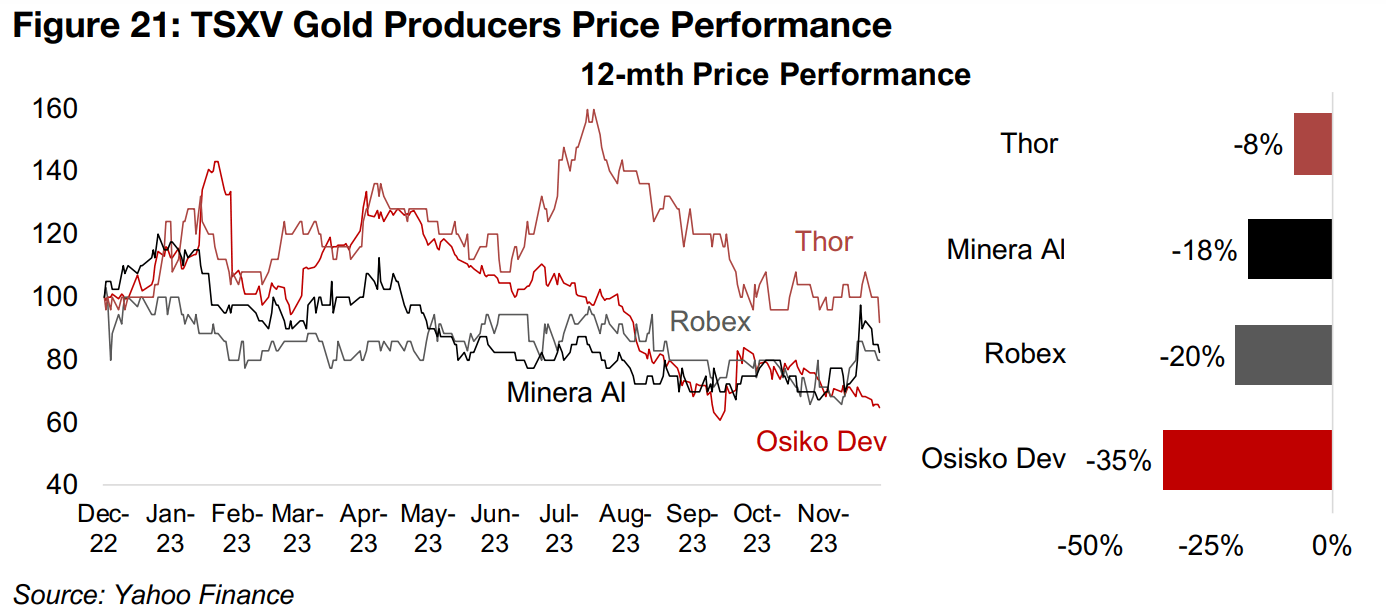
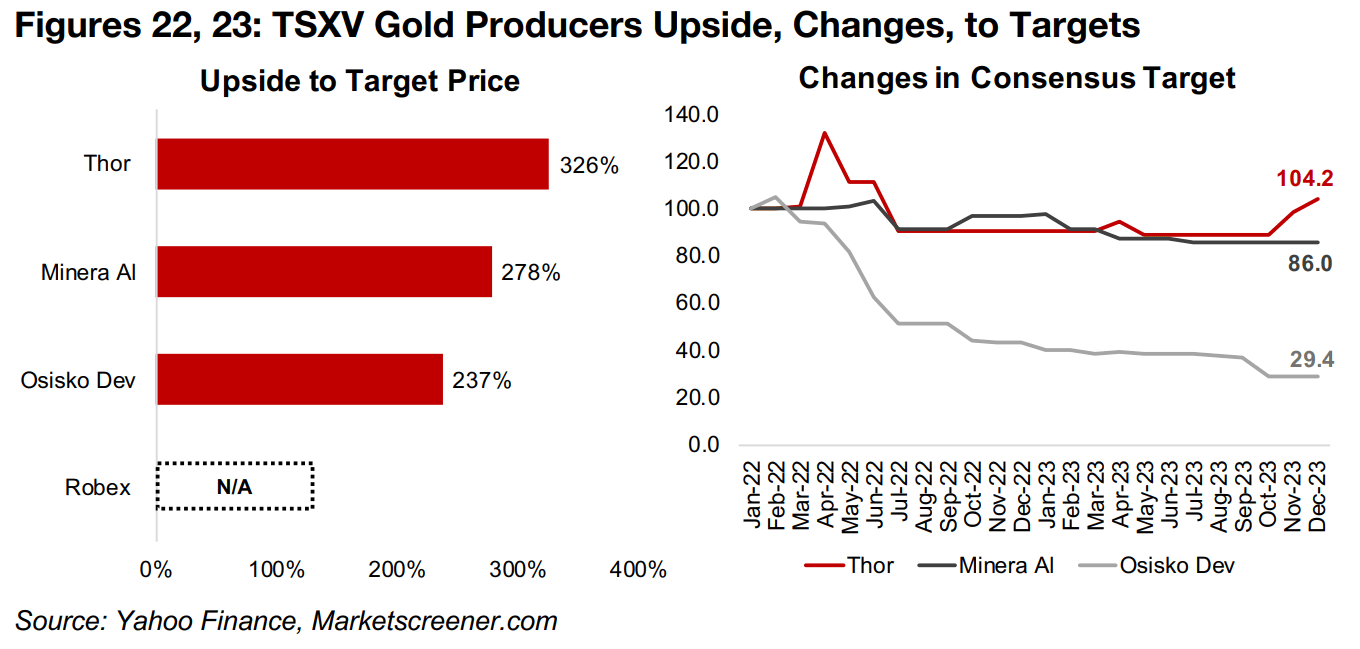
Even with these comparably strong operations and prospects the share prices of the group have all declined over the past year, driven by a cooling macro picture. Thor has held up best, down just -8%, and was up nearly 60% as of July 2023 (Figure 21). It has the highest upside to its target price at 326% (Figure 22), and its consensus target price has remained steady since 2022, up 4.0% (Figure 23). Minera Alamos and Robex Resources trended down over most of the past twelve months, dropping -18% and -20%. Minera has a 278% upside to its target and has faced a -14% downgrade to its target over the past two years, while Robex has no consensus target. Osisko Development has 237% upside to its target, but only after about a -70% drop in its price target over the past two years.
Disclaimer: This report is for informational use only and should not be used an alternative to the financial and legal advice of a qualified professional in business planning and investment. We do not represent that forecasts in this report will lead to a specific outcome or result, and are not liable in the event of any business action taken in whole or in part as a result of the contents of this report.
Author
Ben McGregor authors the Weekly Roundup at CanadianMiningReport.com, providing sharp analysis of the metals and mining sector. With a talent for spotting trends, Ben distills complex market shifts into clear, engaging insights on TSXV junior miners. His weekly updates cover gold, copper, uranium, and more, blending data-driven perspectives with a knack for identifying opportunities. A vital resource for investors, Ben’s work navigates the dynamic junior mining landscape with precision.