July 17, 2023
Gold Stocks Surge
Author - Ben McGregor
Gold boosted by low inflation, US$ and new gold-backed currency
The gold price rose 1.8% to US$1,960/oz, the strongest gain in over three months, driven by a combination of a continued decline in US inflation and the US$ and the planned introduction of a new gold-backed currency by the BRICs countries.
Lithium forecasts decline on moderating EV sales growth
Lithium demand forecasts have been cut further than supply for 2023 as electric vehicle sales growth moderates, leading to a decline in the lithium price forecasts for this year and next, while large TSXV lithium stocks have seen a mixed performance.


Gold Stocks Surge
Gold rose 1.8% to US$1,960/oz this week, its biggest gain in over three months, and the first substantial rise in ten weeks, as multiple drivers for the metal converged, including a continued fall in US inflation and the US$ and further moves towards establishing a new gold-backed currency by the BRICs countries. This rise in gold combined with a surge in small cap equity as the Russell 2000 rose 3.70% also drove gold stocks to their best gains since the first week of 2023, with the GDX ETF of gold producers up 8.5% and the GDXJ ETF of gold juniors up 9.4%.
Overall US inflation continues to plummet, but core inflation persists
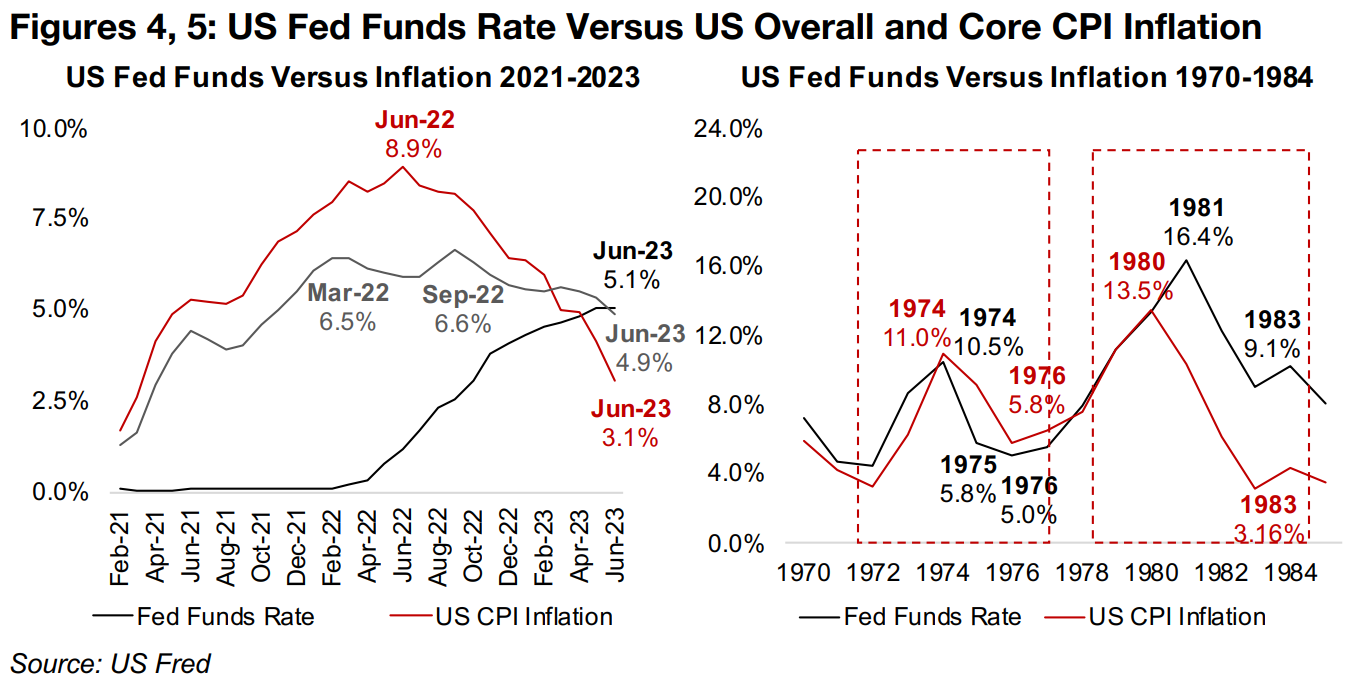
The big economic number this week was US CPI inflation, which surprised the market
to the downside, dropping to 3.1% in June 2023 (Figure 4). However, this was mainly
because of declining energy costs, and the US Fed's preferred core inflation gauge,
which excludes more volatile energy and food costs, only edged down to 4.9%. When
the Fed points to a 2.0% inflation target for inflation, they are indicating this core
number, meaning that the CPI is still about 3.0% above the Fed's target.
Core inflation hasn't come down that much, declining -1.7% from a peak at 6.6% in
September 2022, in contrast to the -5.8% plunge in overall inflation from its 8.9%
peak in June 2022. This implies that the Fed's fight against inflation is still far from
over, and at least another 25-basis point rate hike is expected for September, and
some Fed Board Members are calling for two more rate hikes this year. This would
send interest rates well towards their highs for the past two decades, and we believe
that this could put severe downward pressure on the economy heading in 2024.
Fed looking to avoid repeat of late-1970s inflation resurgence
While the Fed may well have reached a peak in their base rate after one or two more
hikes, they have been quite clear that they would maintain rates at elevated levels for
an extended period to ensure that inflation, and perhaps more importantly, inflation
expectations, have been purged. This is because of the Fed's focus on the
experience of the 1970s and early 1980s, when inflation was only temporarily curbed,
before rising abruptly again.
While inflation had reached 11.0% in 1974 on the first oil price shock, the Fed Funds
rate was just behind it, at 10.5% (Figure 5). This was enough to reduce inflation to
5.8% by 1976, and the Fed quickly cut rates to 5.8% in 1975 and 5.0% in 1976.
However, inflation expectations remained, and when the second oil price shock hit,
US inflation surged to an even higher peak of 13.5%. This time around, the US Fed
was prepared for more aggressive measures to wrench inflation out of the system,
and the Fed Funds rates peaked at 16.4%. Even as late as 1983, the Fed Funds rate
was still at an aggressive 9.1%, even though inflation had plummeted to 3.2%.
The general rule that emerged from this incident, and subsequent more moderate
increases in inflation, is that the Fed Funds rate has had to meet or exceed US CPI
inflation to curb rising prices, and the higher and longer the gap, the better.
Considering recent data in this context, the Fed Funds rate at 5.1% only just edged
above core inflation of 4.9% in June 2023. Given that the Fed is only finally getting
on top of the core inflation fight over the past month, we do not expect it to pull back
on rates now, and they could maintain high rates well into 2024.
The market may therefore be overestimating, in our view, the potential relief from any
Fed rate cuts next year, and therefore possibly overallocating funds so far this year
into riskier equity sectors. At the same time they may be underestimating the need
for protection from economic downside in the form of safe-havens like gold and even
gold stocks, if the metal's gains can offset likely downside pressure on small caps
overall. The declining inflation and the market's expectation for a more dovish Fed
does of course also have a positive read across for gold too, with lower rates meaning
a rising money supply, which will tend to drive up gold in the long-term.
BRICs plan a gold-backed currency
Another upward driver of the gold price has been a decline in the US$, with the dollar
index dropping to 99.96, below 100 for the first time since April 2022, and down from
a peak of 113.31 in October 2022. This has partly been related to the rest of world
catching up with the US on rates hikes. A major interest rate differential had opened
up between the US, which charged ahead with aggressive hikes in 2022, and other
countries, which were slower to raise rates. Countries with higher rates tend to draw
in fund flows and see their currencies appreciate, which happened in the US in 2022.
However, the interest rates of other major nations have started to catch up with the
US, contracting the differential and drawing fund flows back to their countries,
boosting their currencies and putting downward pressure on the dollar. While this
type of movement is typical in a world with free-floating currencies, there has been
other recent news which could mark a major change in the structure of the global
financial system. This has been a plan for the BRICs countries, Brazil, Russia, India
and China, to create a new gold-backed currency to use in their burgeoning intra-country trade, replacing the US$.
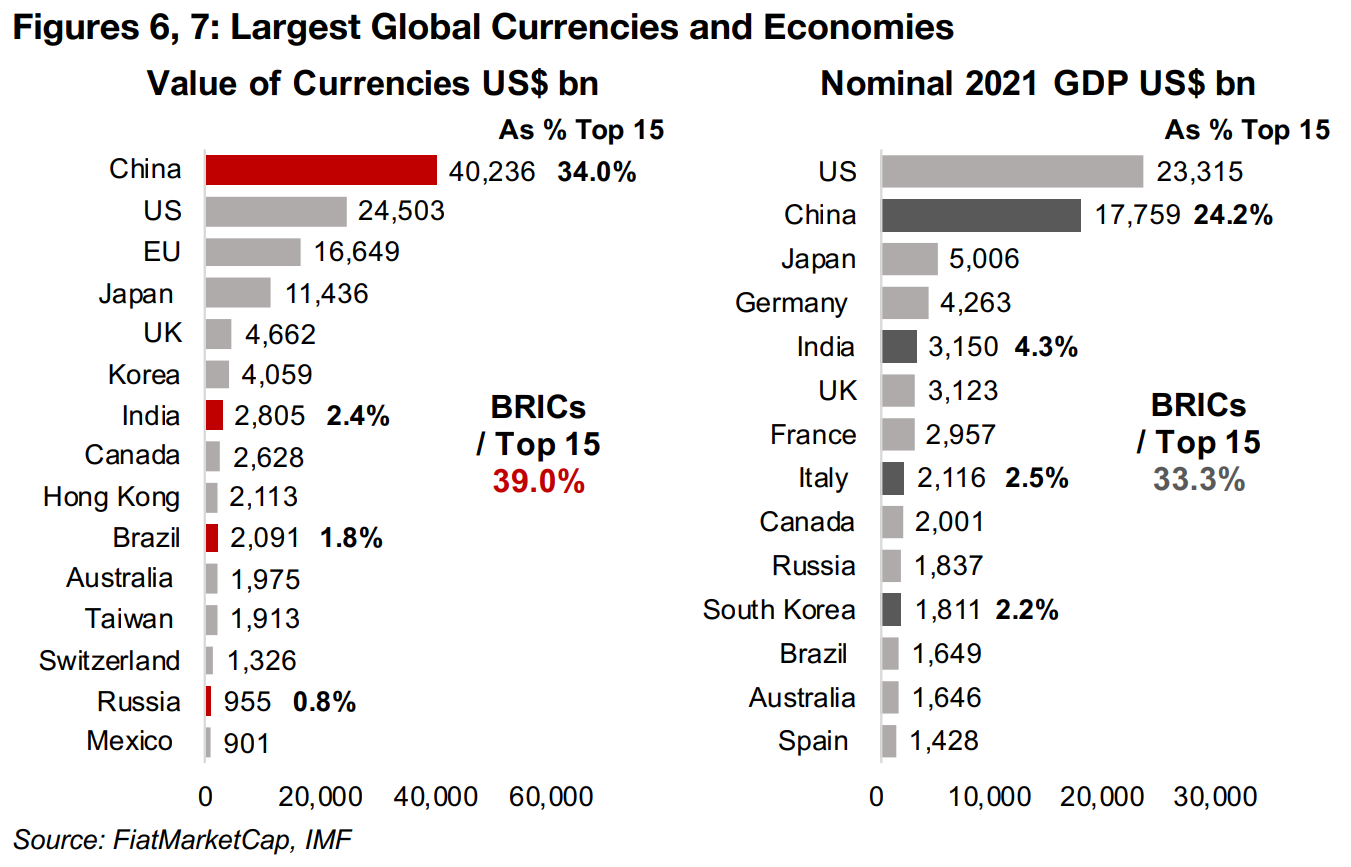
This could be a major boost for gold and hit to the US$ as the BRICs combined
account for 39.0% of the total value of the world's top fifteen currencies (Figure 6),
and 33.3% of the aggregate GDP of the world's top fifteen countries (Figure 7). The
the majority comes from China, which is 34.0% and 24.2% of the value of the top
fifteen currencies and countries' GDP, respectively. However, Brazil, Russia and India
are expected to gain an increasing global economic share in the coming decades.
If this gold-backed currency is established, it would be the first major gold backed
currency in over fifty years, since 1971, which marked the collapse of the Bretton
Woods global financial regime which had operated since the end of the World War II.
It would be very likely to mark a major boost in the demand for gold and could hurt
the dollar long-term as it would become less used in a huge proportion of global trade,
with the BRICs expected to reach fifty percent world GDP by the end of this decade.
Lithium
Lithium price forecasts decline as EV sales growth moderates
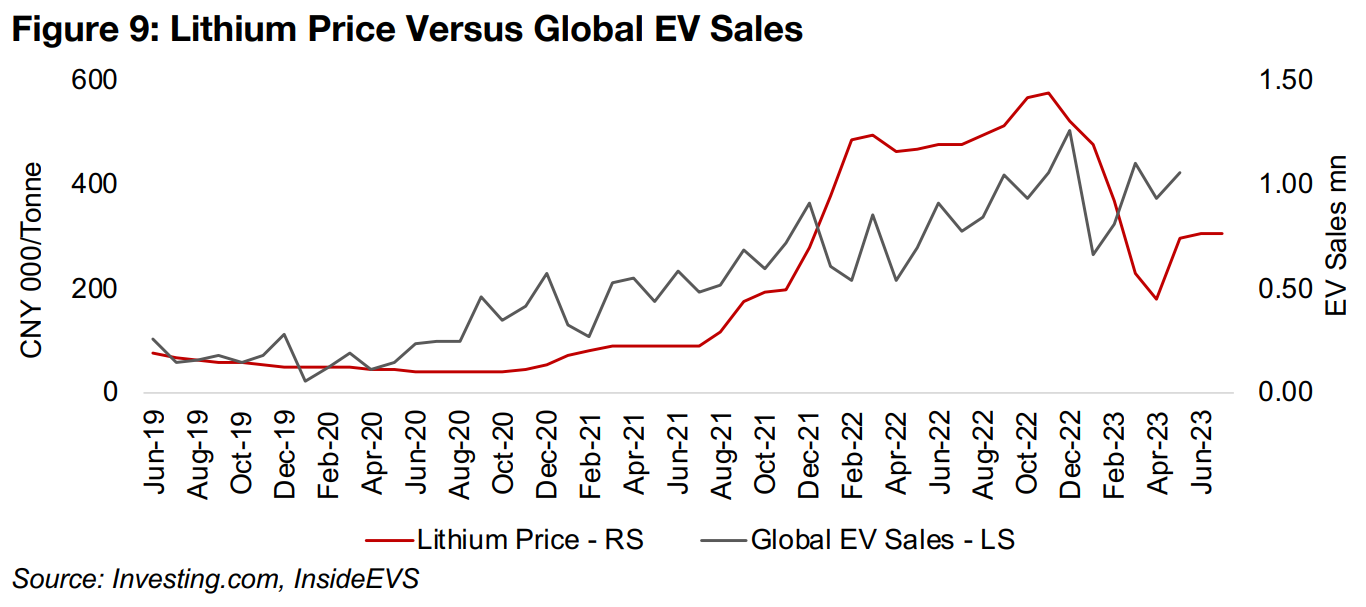
Lithium prices have flattened over the past two months after a volatile period with a twelvefold rise from the start of 2022 to a CNY597.5k/tonne peak in November 2022, a -71% plunge to CNY71.5k/tonne by April 2023 and then 79% recovery to an average CNY309.3/tonne since June 2023. There have been substantial downgrades to lithium demand for this year and lithium prices for 2023 and 2024 by Australia's Office of the Chief Economist (AOCE), which provides quarterly estimates for the industry. This has been driven by moderating global EV sales growth, which is already 30% of lithium demand in 2020, and expected to rise to 68% by 2030.
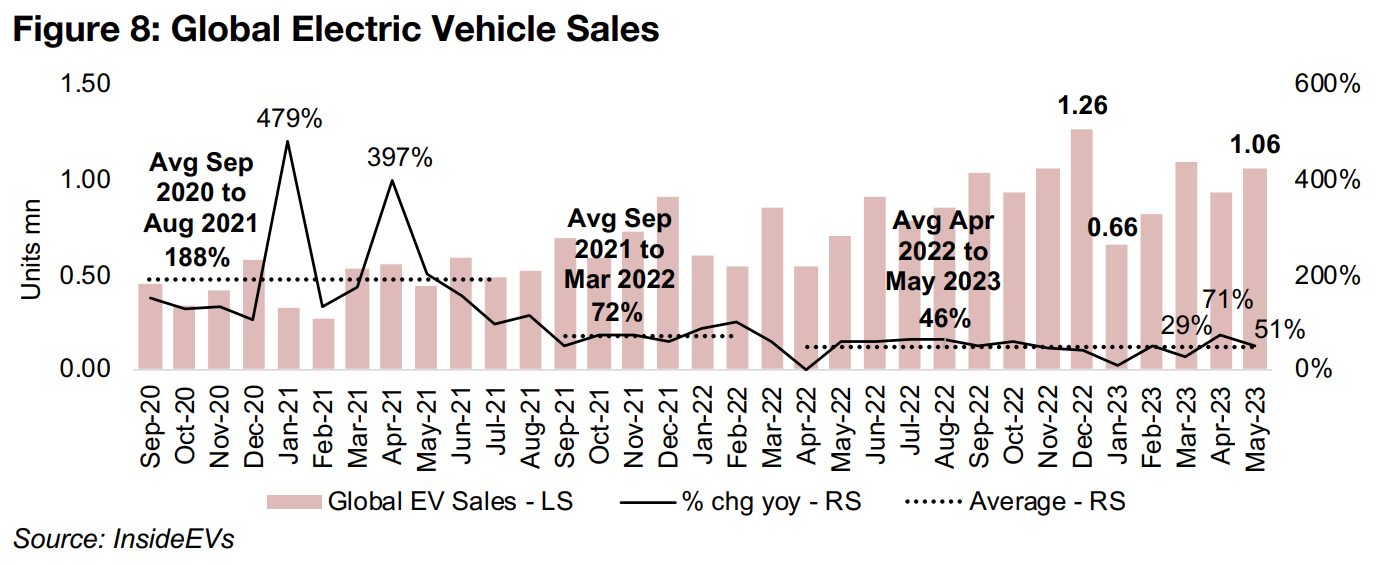
The most recent global electric vehicle sales data reported by InsideEVs shows year on year growth of 51% in May 2023, down from 71% in April and 29% in March 2023 (Figure 8). While in absolute terms, this is hardly weak, the average growth since April 2022 of 46% is down substantially from an average of 72% from September 2021 to March 2022 and about a quarter the 188% average from September 2020 to August 2021 which may have marked the peak of the electric vehicle sales growth rate.
Lithium supply finally catching up with demand
While the lithium price has generally followed the trend in global EV sales, it has not been an exact relationship especially short-term (Figure 9). One major shift this year is that lithium chemicals supply, which is 70% from China, has finally started to catch up with demand, with substantial new supply expected to come online this year from the country. While the lithium price lagged the rise in EV sales from mid-2020 to end-2021, it surged ahead of EV demand through the first nine months of 2022. This was because the industry had not foreseen the boom in EV demand and it takes several years to bring new capacity online, an effort which had been hampered by lockdowns in China. However, with the lockdowns over at the end of 2022 and capacity increasing closer to the increased demand, the lithium price and EV sales trends are likely to once again come more inline.
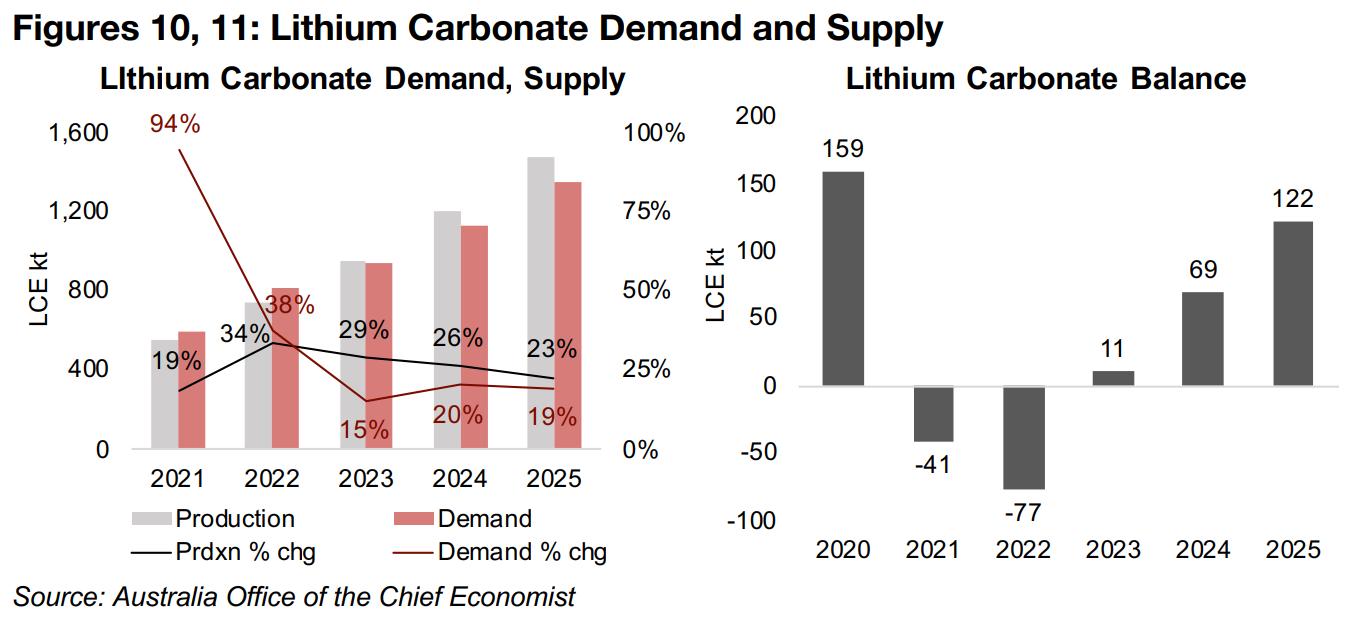
The lithium demand and supply growth reported by AOCE has converged from a huge split in 2021 when demand spiked 94% but supply rose just 19%, driving a deficit in the market of -41 kt, to a 38% rise in demand and 34% rise in supply in 2022, with the deficit expected to widen to -77 kt (Figures 10, 11). However, production growth, at 29% in 2023 and 26% in 2024 is forecast to outpace demand growth of just 15% and 20%, driving a 11 kt surplus in 2023, forecast to widen to 69 kt by 2024. Such rising surpluses could put further downward pressure on the lithium price.
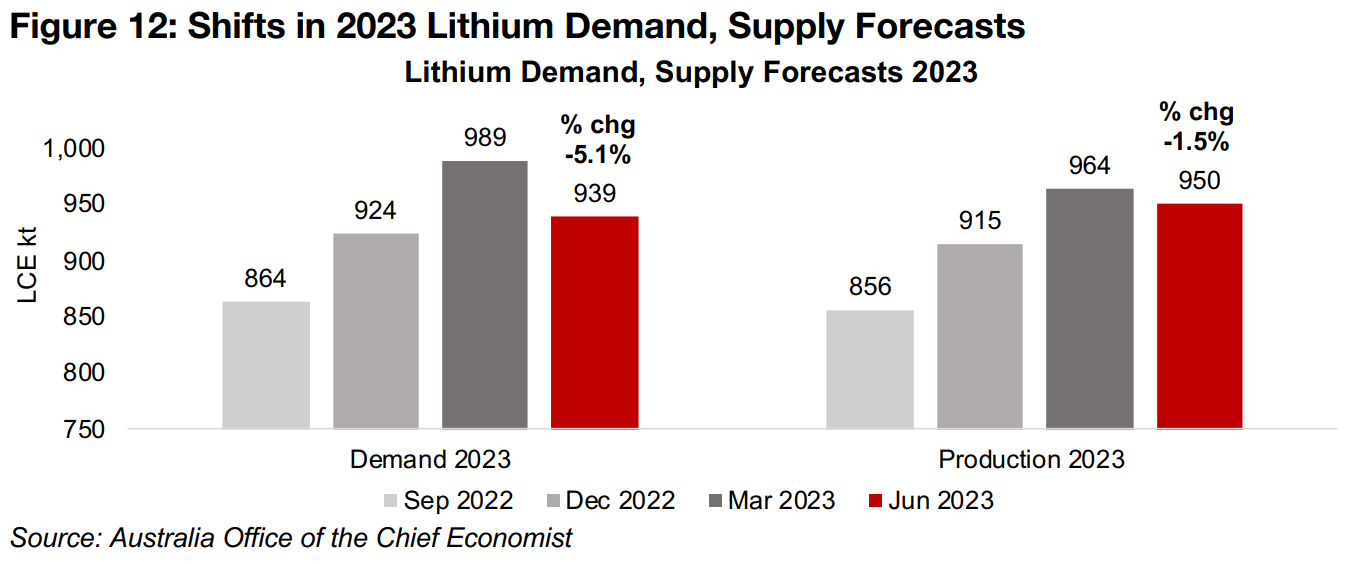
The surplus in 2023 has been driven by a substantial downgrade in the AOCE demand
forecast by -5.1% to 939 kt in their June 2023 quarterly, from their 989 kt March 2023
estimate, versus only a -1.5% reduction in supply to 950 kt (Figure 12). This is the
first reduction in the demand and supply forecast for lithium after two consecutive
quarters of increases, indicating an only recent downward shift in the AOCE's outlook
for the industry.
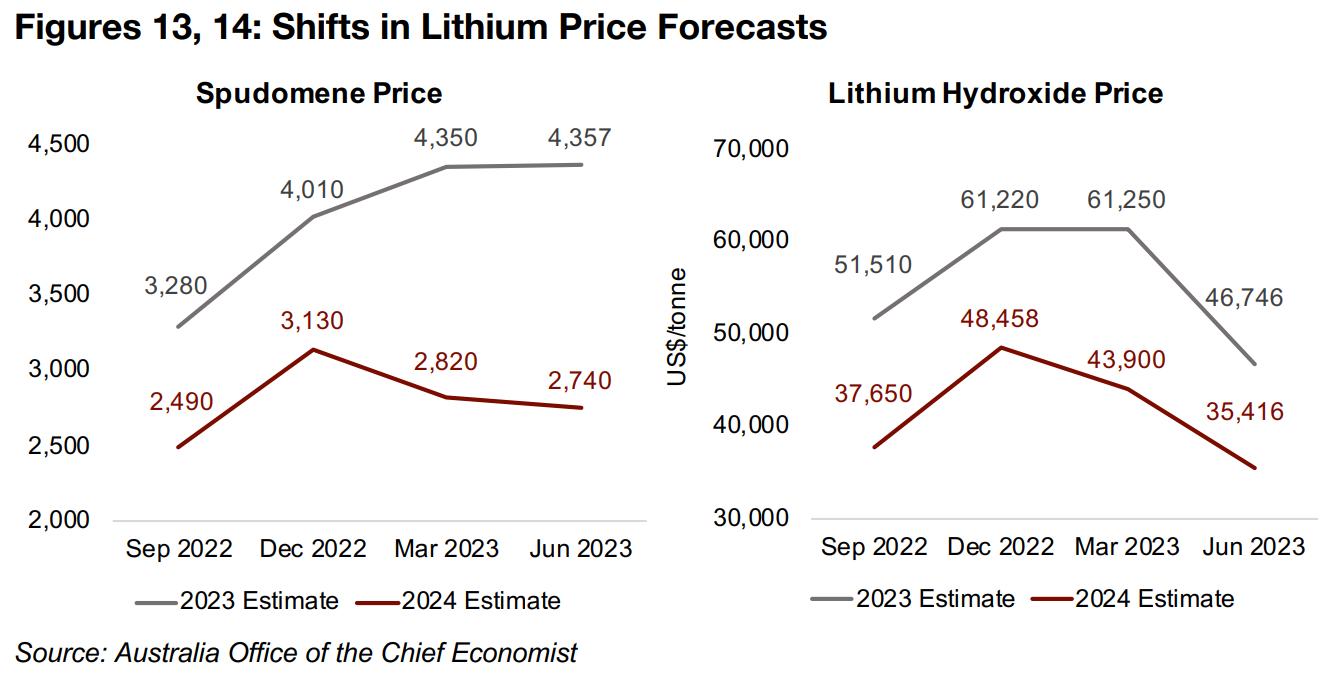
The forecast adjustments have led the AOCE to downgrade their 2023 lithium
hydroxide target a substantial -23.7% to US$46,746/tonne in the June 2023 report,
although their spudomene estimate remained flat (Figures 13, 14). However, AOCE
expects a major drop in both spudomene and lithium hydroxide in 2024 by -37.1%
and -24.2%, or to US$2,740/tonne and US$35,416/tonne, respectively. There were
also cuts to 2024 estimates for spudomene and lithium hydroxide in March 2023, and
further reductions in June 2023, suggesting an increasingly bearish outlook for lithium
next year from the AOCE.
TSXV lithium stocks mixed as metal declines
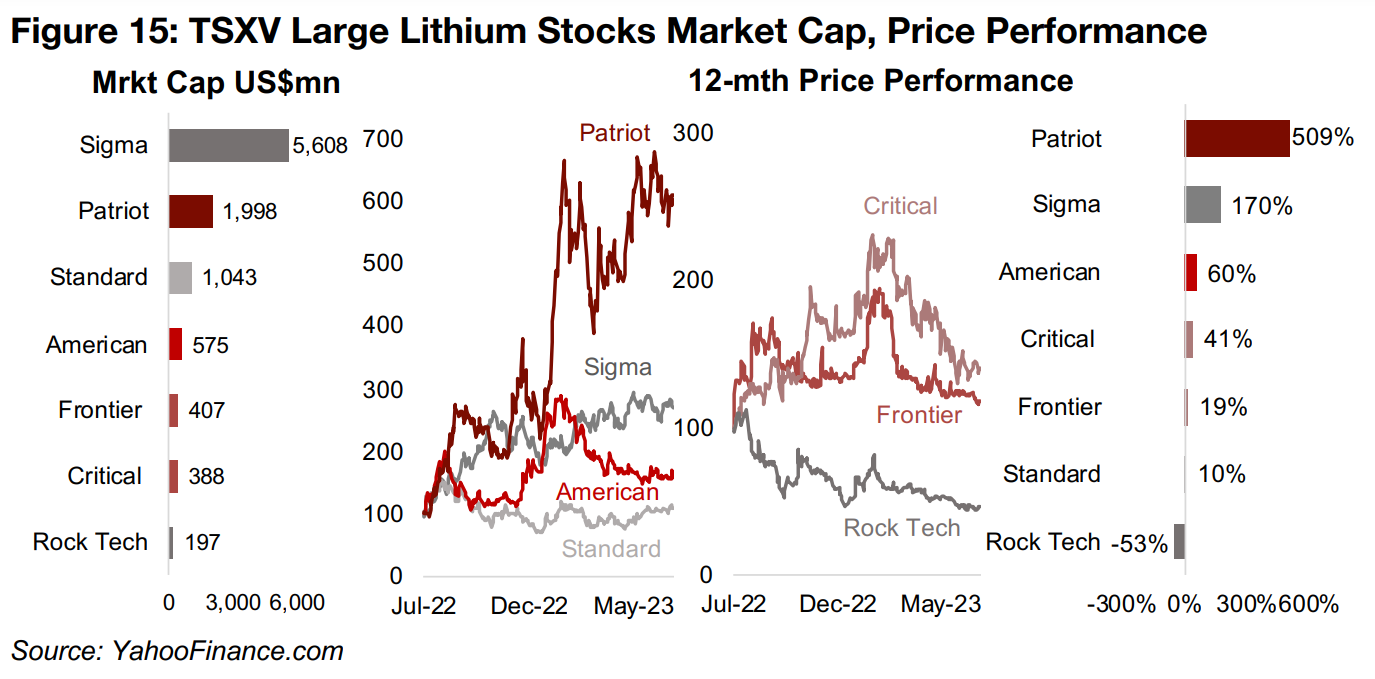
The TSXV lithium stocks price performance over the past twelve months has been
mixed even as the metal declines. Most of the group, including Patriot Battery Metals,
American Lithium, Critical Elements Lithium and Frontier Lithium peaked in late
January 2023 to early February 2023, well after the November 2022 peak in the lithium
price (Figure 15). American, Critical and Frontier have all declined off their peak as
the lithium price has eased, but not been boosted by lithium's rebound off its lows.
Patriot set new highs in June 2023, but was driven more by strong drill results than
the rebound in lithium. Sigma Lithium has seen a more gradual uptrend, being the
largest of the group, and the largest TSXV mining stock by far at $5.6bn, with a huge
project on the verge of production. Standard Lithium has seen a relatively flat
performance over the past year, and Rock Tech a decline over most of the period,
and has posted the only loss of the group.
All producers and most large TSXV gold stocks up
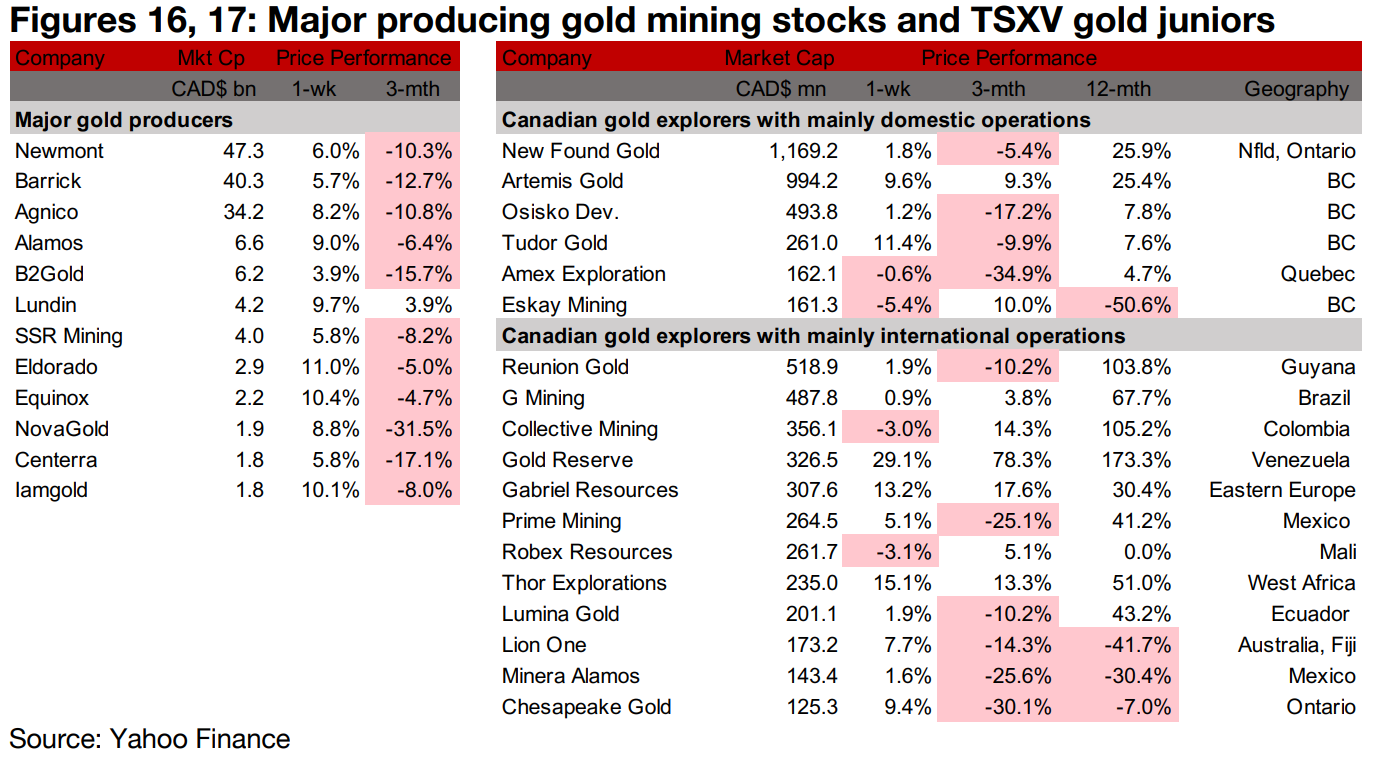
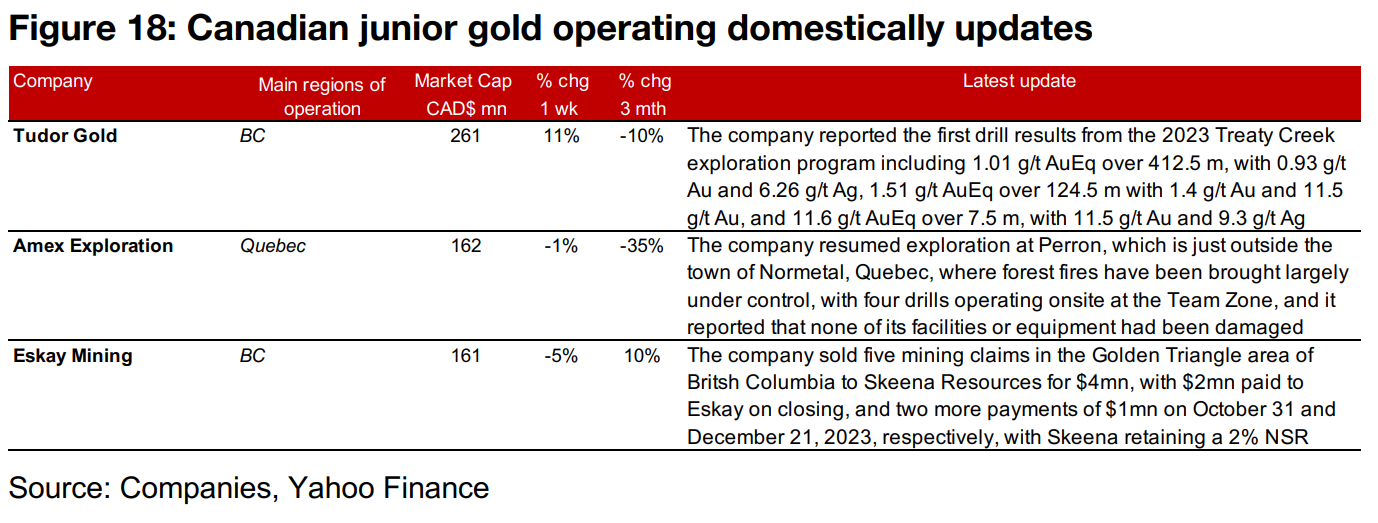
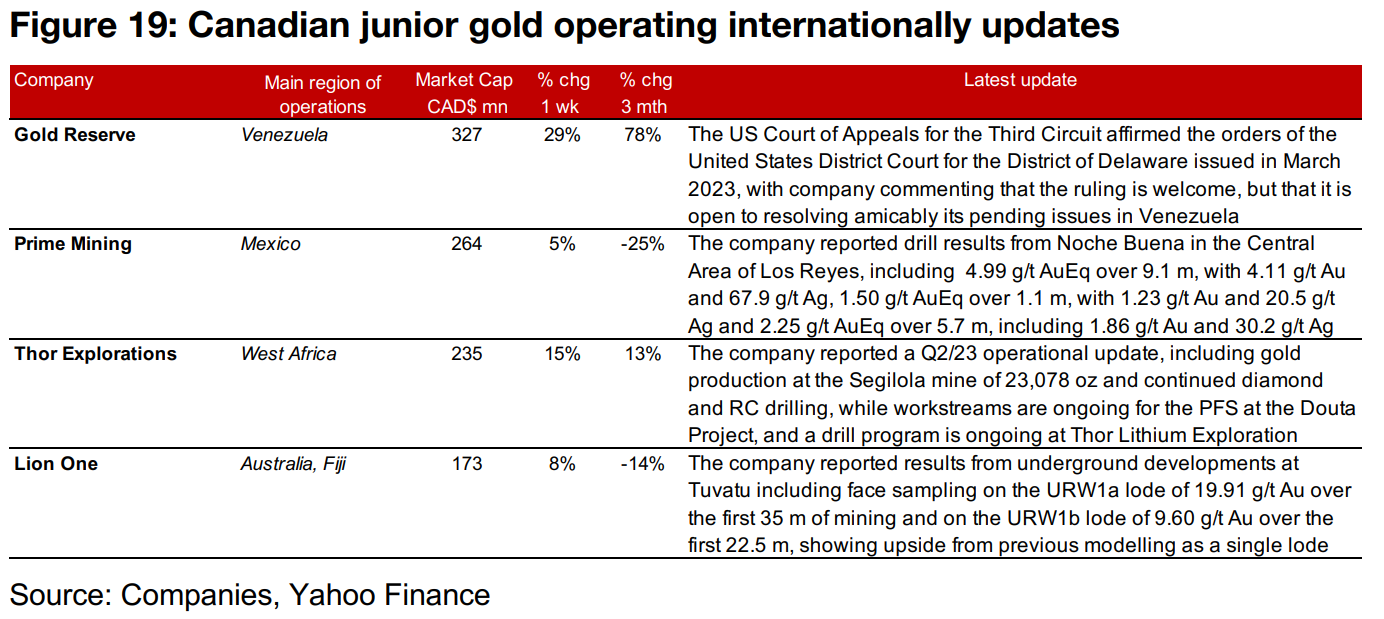
The large gold producers all gained over 5.0% and most of the larger TSXV gold stocks rose (Figures 16, 17). For the TSXV gold companies operating domestically, Tudor Gold reported drill results from Treaty Creek, Amex resumed exploration at Perron and Eskay Mining sold five claims in B.C.'s Golden Triangle to Seabridge for $4mn (Figure 18). For the TSXV gold companies operating internationally, Gold Reserve saw a US court affirm the orders of another US court regarding its issues in Venezuela, Prime Mining reported drill results from Los Reyes, Thor Explorations provided a Q2/23 operational update and Lion One reported results from underground developments at Tuvatu (Figure 19).
Disclaimer: This report is for informational use only and should not be used an alternative to the financial and legal advice of a qualified professional in business planning and investment. We do not represent that forecasts in this report will lead to a specific outcome or result, and are not liable in the event of any business action taken in whole or in part as a result of the contents of this report.


