
April 14, 2025
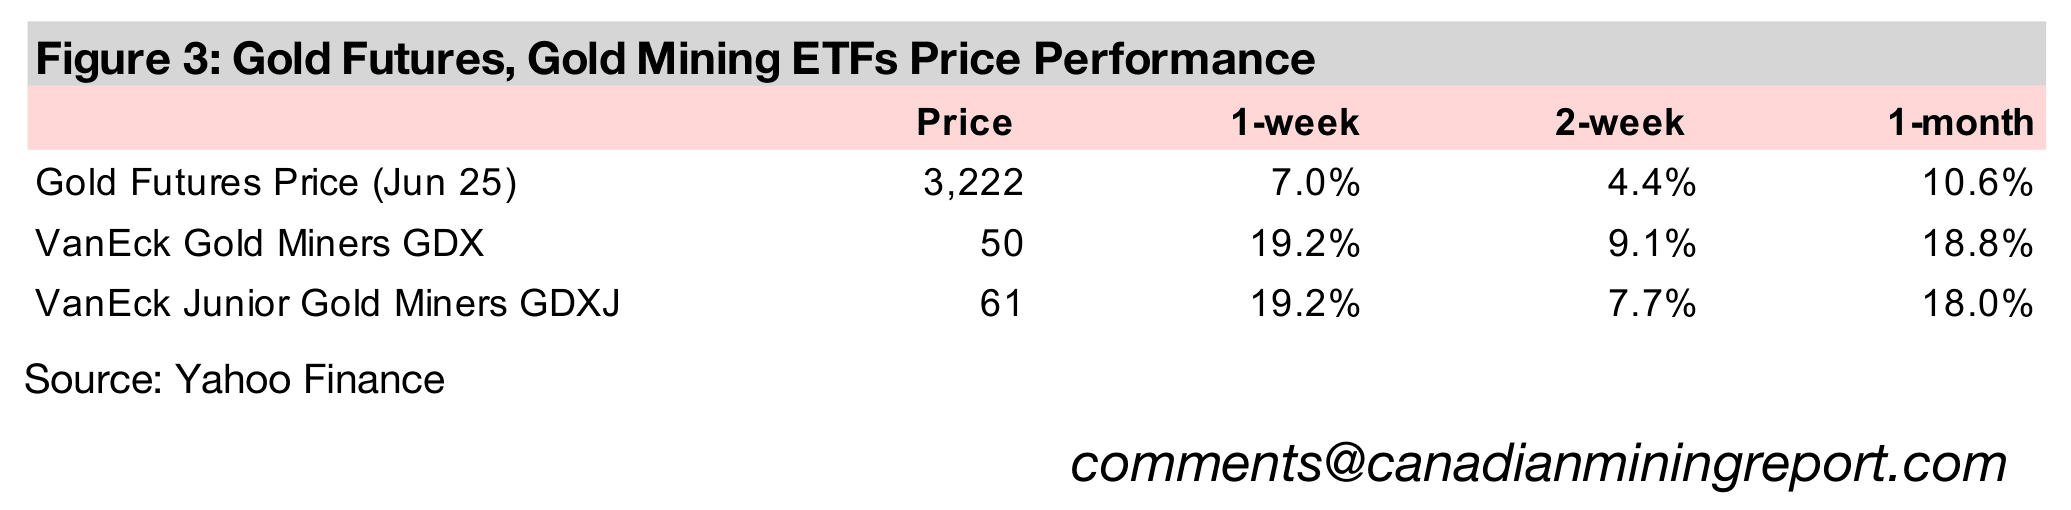
The gold price saw a massive rebound, rising 7.0% to US$3,222/oz, gaining US$200/oz in just a few trading days after dipping briefly below US$3,000/oz earlier in the week as severe turmoil drove the market into the safe haven.
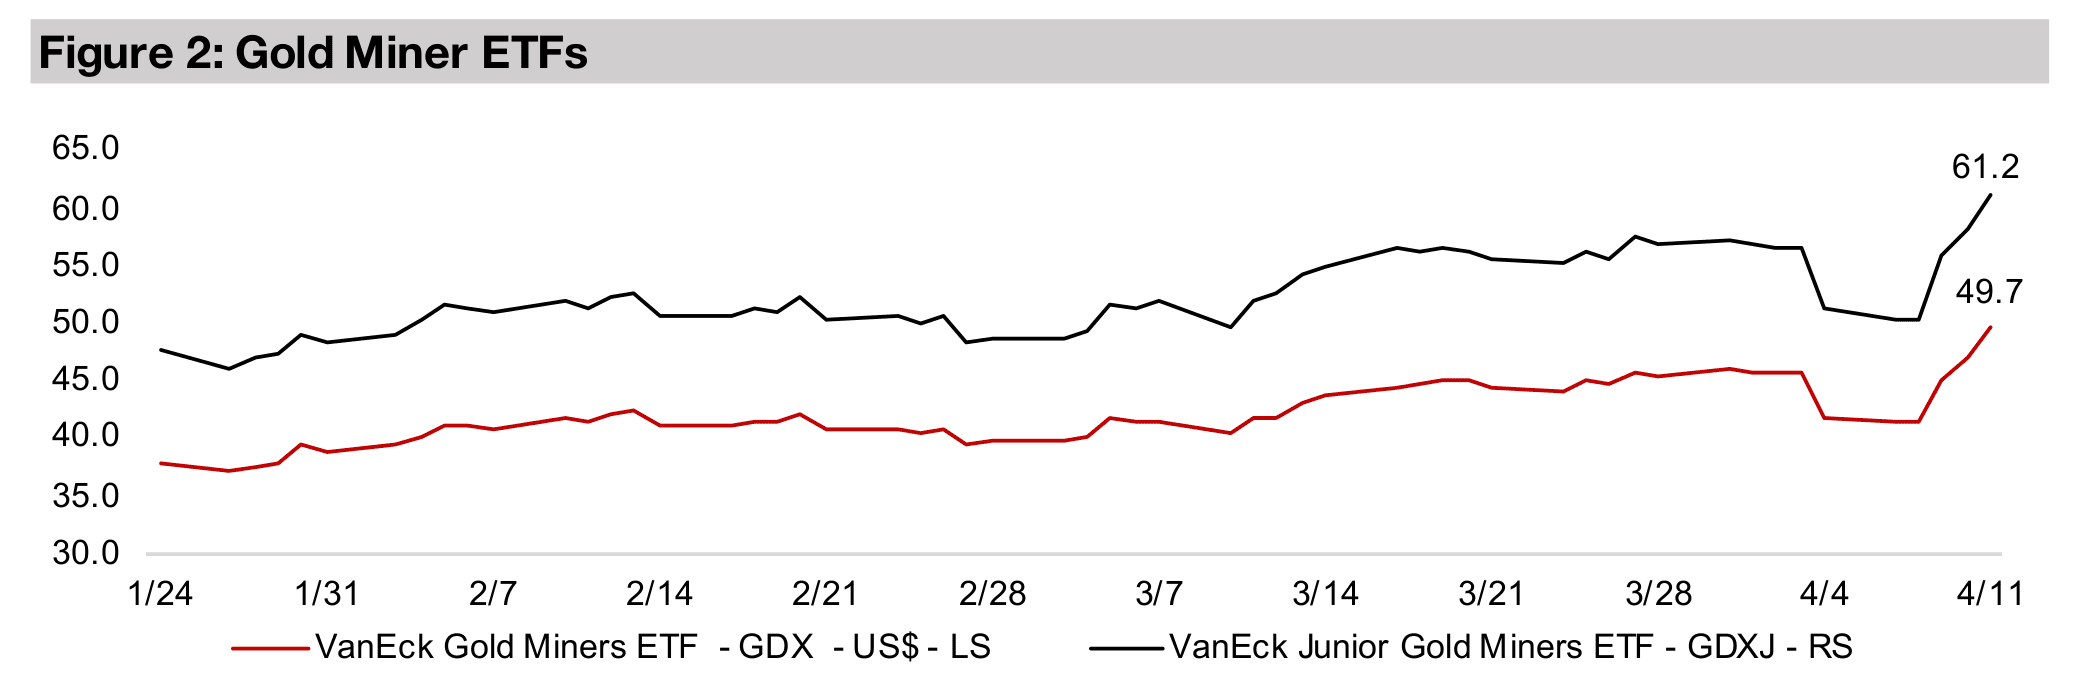
While many markets still remained below their pre-crash levels, the gold stocks had a huge week with GDX and GDXJ both up 19.2% and surging far above their pre-crisis highs, driven by the rise in the metal, equities, and overall risk.


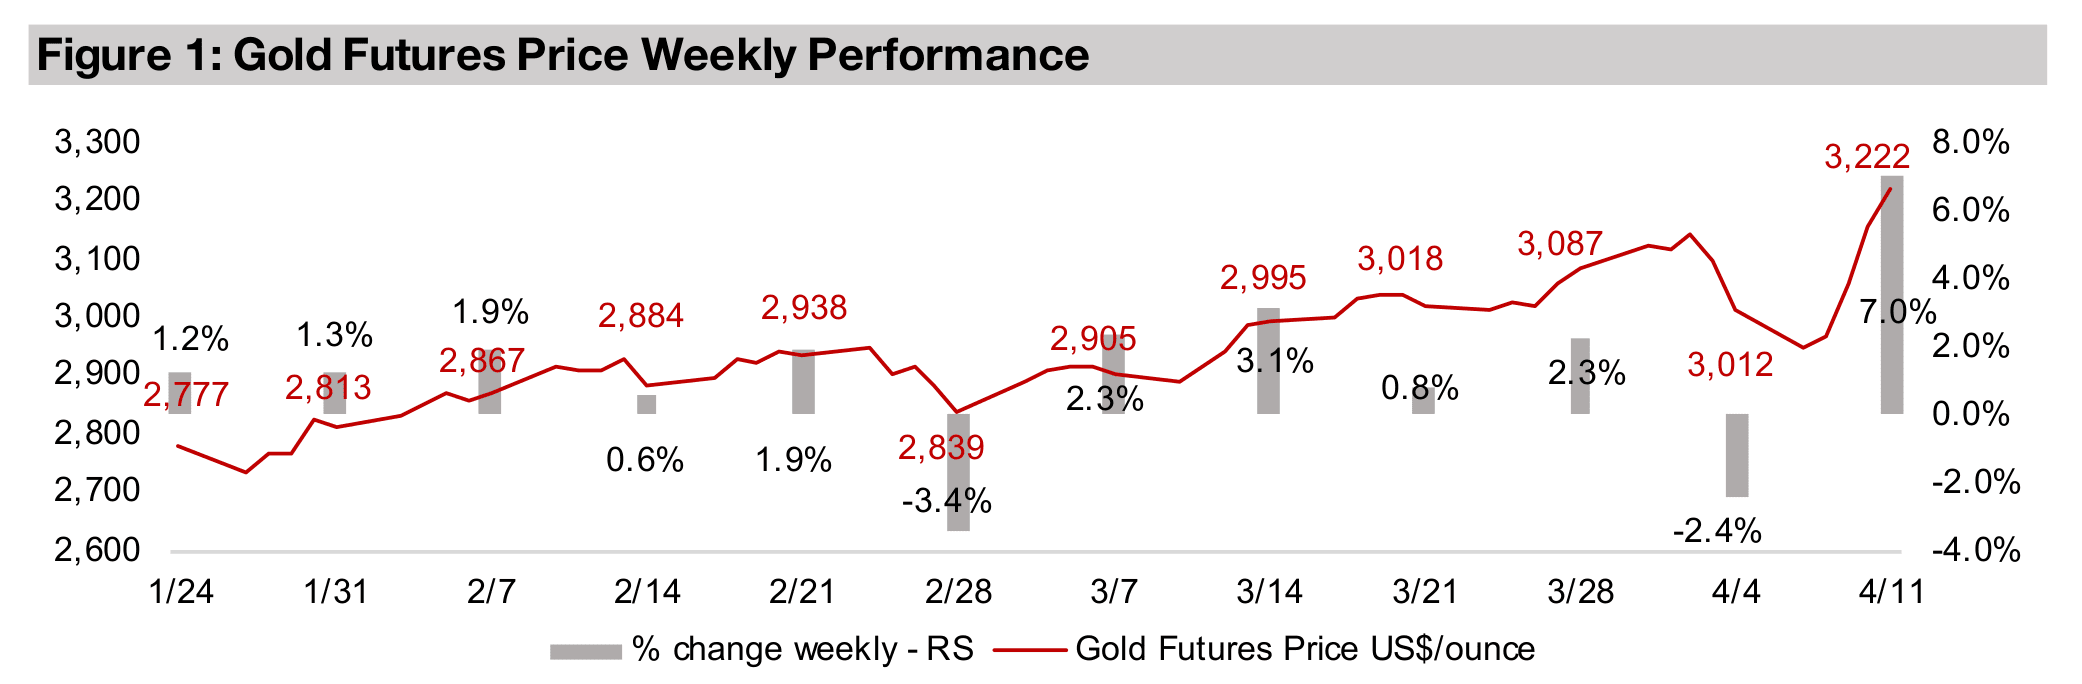
Gold blasted up 7.0% to US$3,222/oz as global markets saw a second week of
historically huge moves, with a major recovery from the previous week’s severe global
crash. This came as the US announced it would pull back from its extremely stringent
stance on tariffs, which had been the main catalyst driving the decline. The US
announced a 90-day hiatus for many countries on new tariffs ranging from 11% to
104%, only a day after they briefly went into effect on April 9, 2024, reducing them to
just 10% in many cases, and leaving an open door for negotiations.
However, these reductions did not include China, which had reacted to the original
tariffs on the country of up 104% with 84% retaliatory tariffs on the US. This was
followed by an increase in tariffs on China by the US to 125%, with the former soon
matching this level on the latter. In contrast to many countries which are already in
talks with the US, China has so far not announced any intentions to negotiate on
trade. However, the country said that it would ignore any further tariff hikes by the
US, and not respond with further increases from its side.
With the markets finally calmer by the end of this week, its appears that the first wild
round of what could prove to be an extended bear market may now be over. With
both a slump and reversal now having played themselves out it is possible to take
stock of the overall fallout, with the volatility likely now to be more subdued as the
levels of the past two weeks would be hard to beat. We look at the performance in
the three weeks from March 21, 2025, as this was when several assets and markets
started to wobble, before the full-blown collapse erupted in the second week. This
plunge continued over into the first two days of a third week of turmoil before the US
stance on tariffs softened, precipitating the huge market rebound.
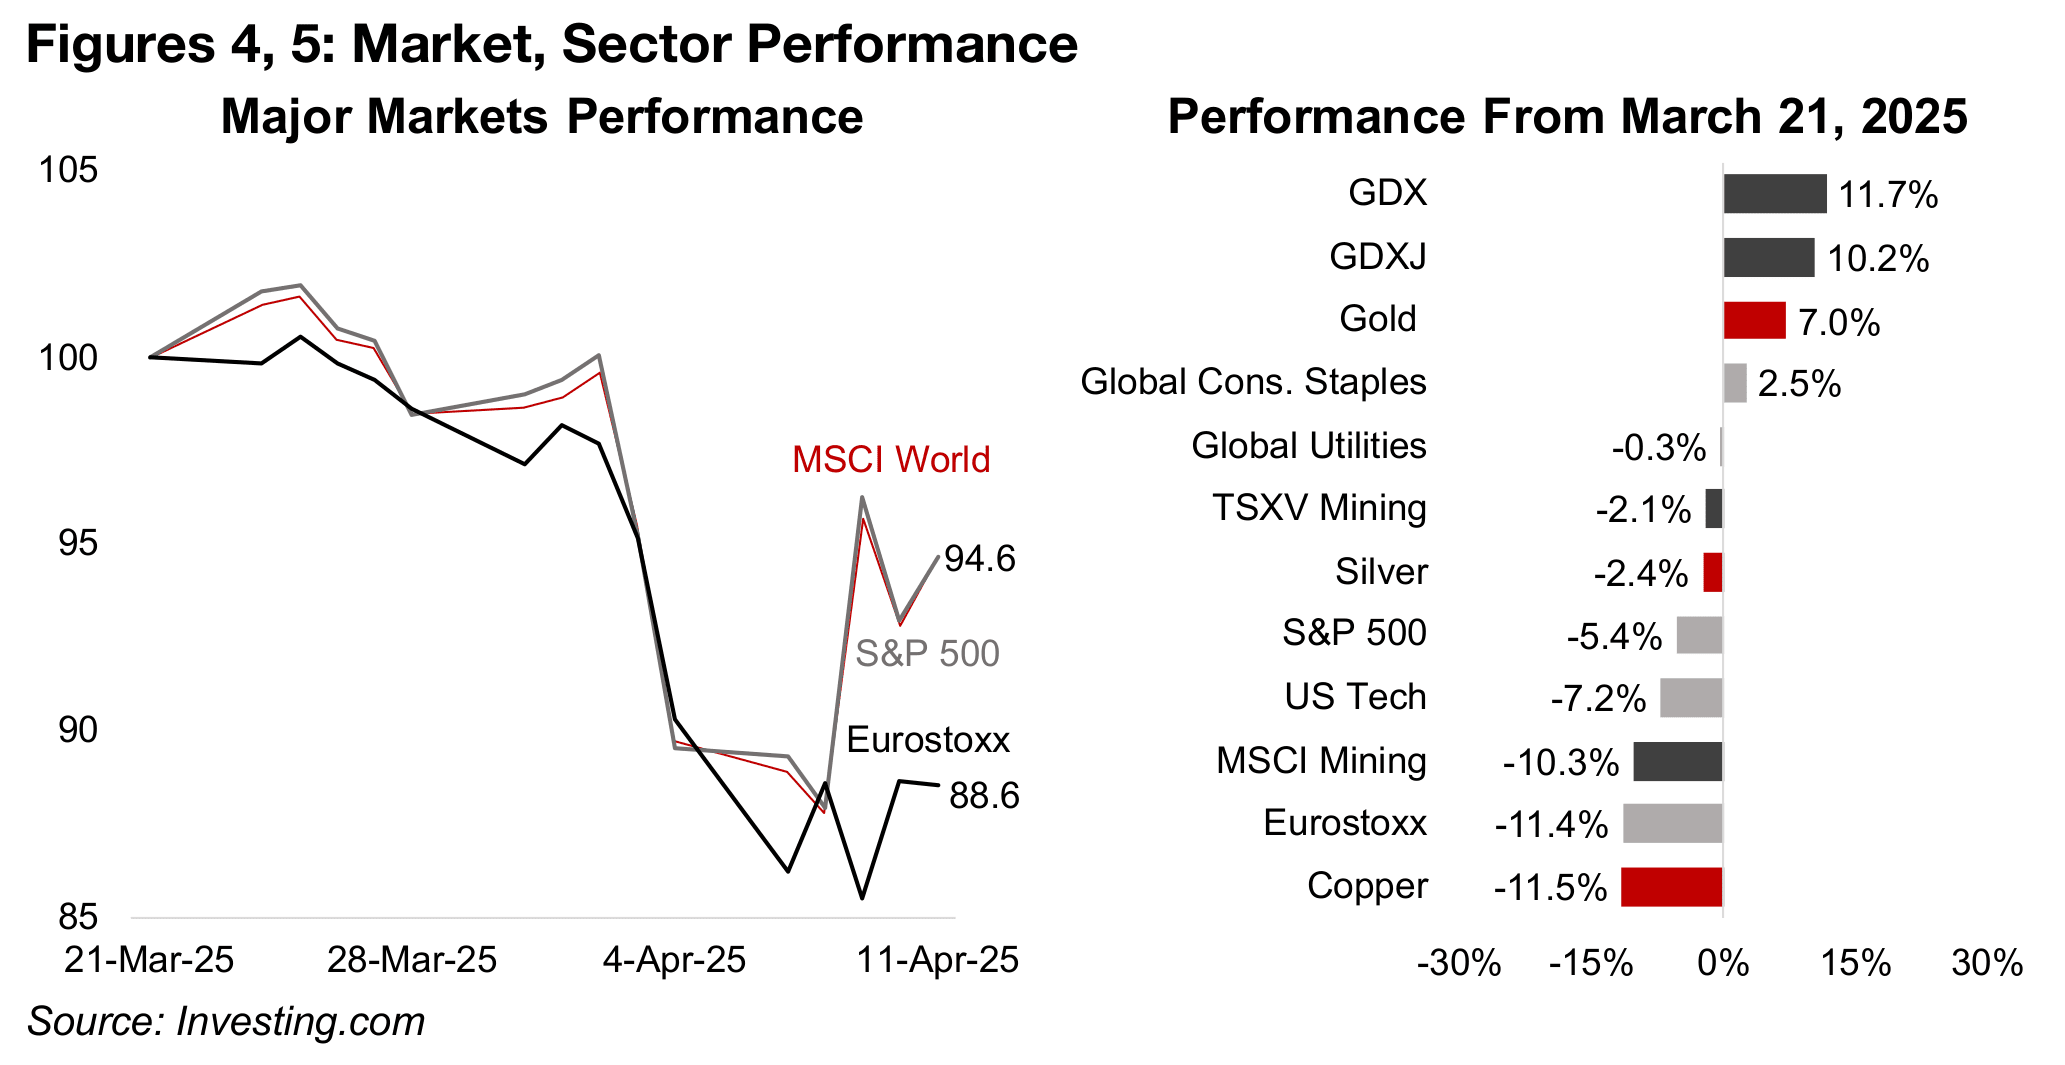
As the crash was global, the MSCI World is a proxy for the overall price action, with
it down well over -10% at its lows versus March 21, 2025, but having reversed to
losses just over -5% (Figure 4). However, the heavy weighting of the S&P 500 in the
MSCI World is shown by the almost identical performances of the two indices,
suggesting this may mask the performance of other international markets. This was
shown by the Eurostoxx 600, which fared worse in the crash, down nearly -15% at
its lows, and which is still down by over -11.0%. This was partly because of a strong
run in the European markets just prior to the crash.
Key safe havens outperformed, with global utilities near flat, down -0.3% from March
21, 2025, while global consumer staples rose 2.5%, far ahead of the declines in the
US and European markets. This contrasted with a -7.2% slump in tech, with the
sector having had risen to a disproportionate share of global markets, with excessive
valuations versus other sectors. While a correction of this imbalance and gradual shift
into defensives has been ongoing as early as mid-2024, the crash obviously catalyzed
this trend, which still has room to run given the still very high global differential
between tech’s valuations versus other sectors.
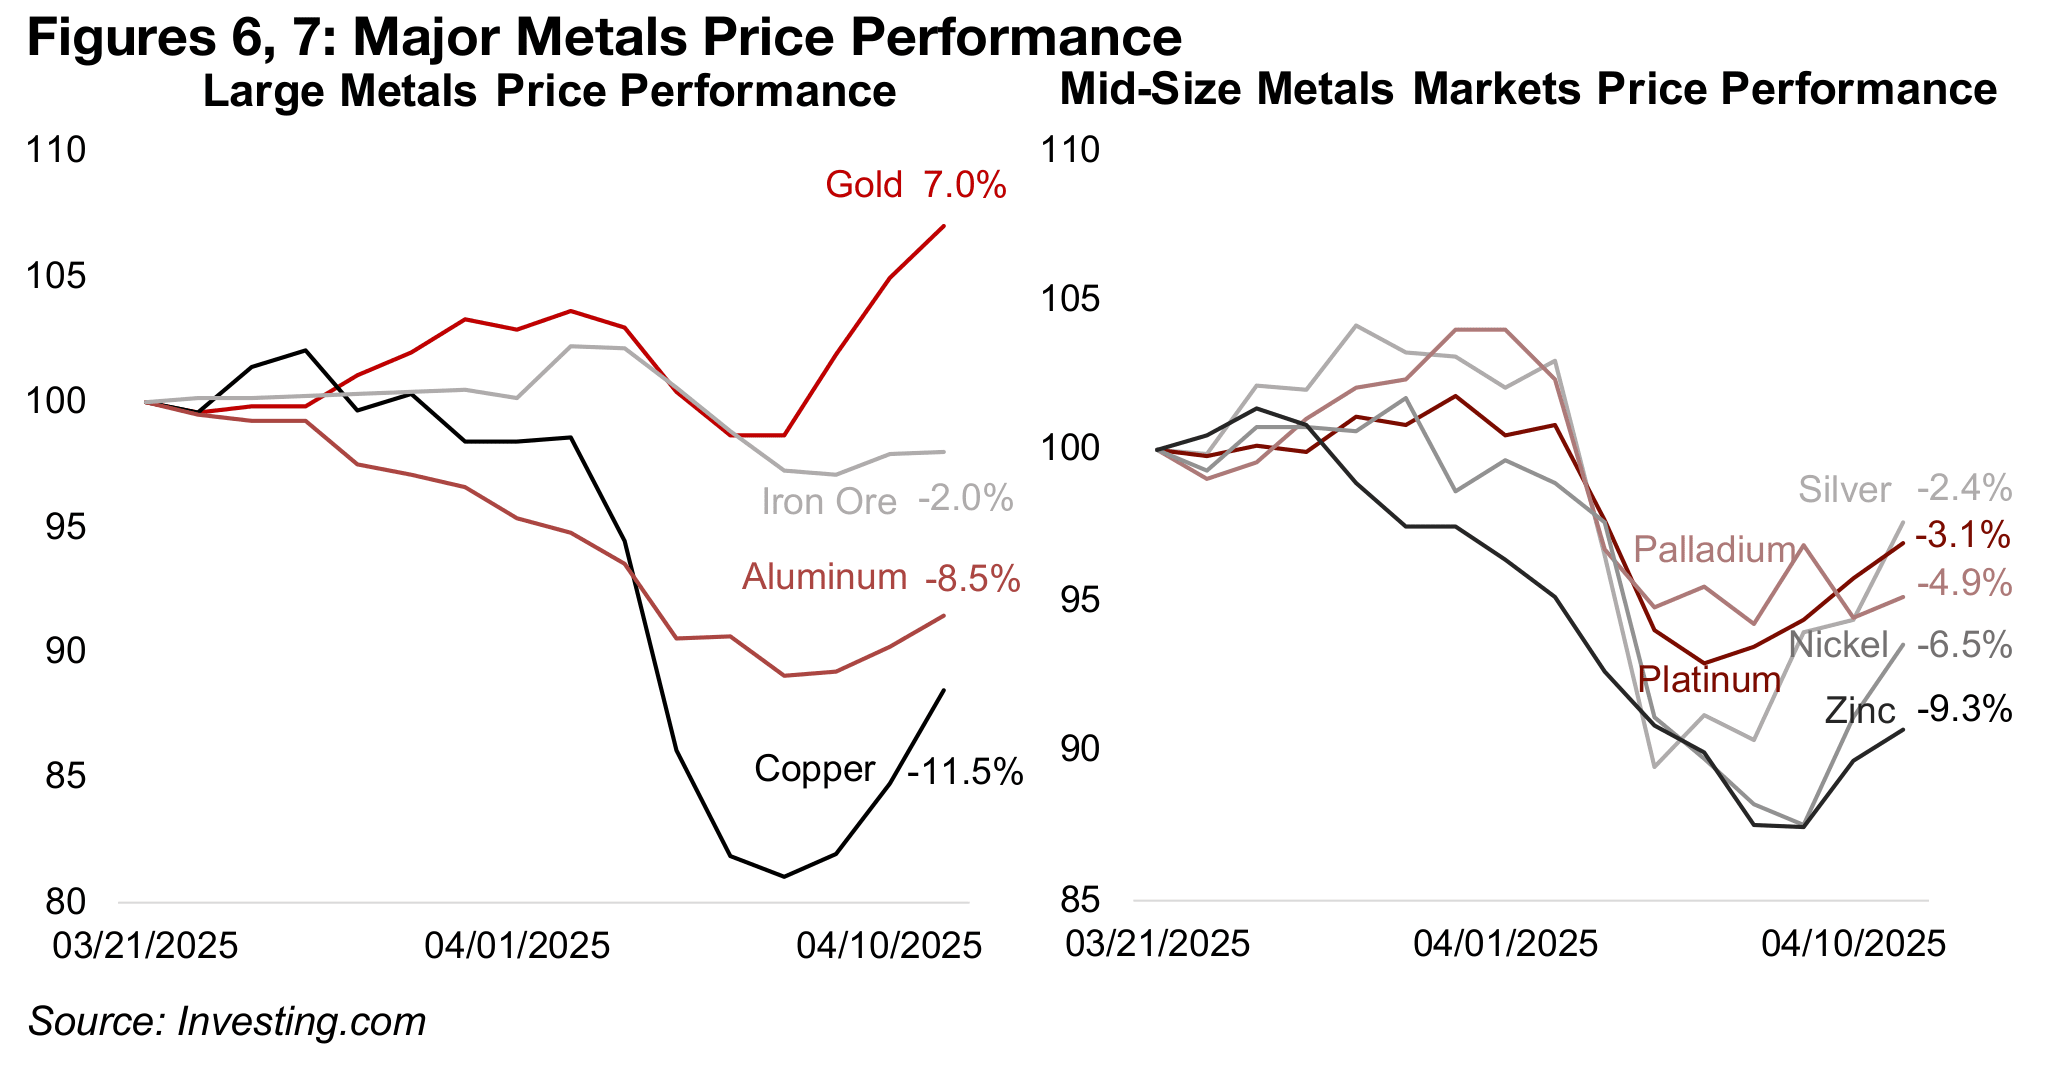
Gold proved itself to be the safe haven that was widely expected, gaining 7.0% over
the three-week period from March 21, 2025 (Figure 5). While it did decline slightly
during the crash, this was only after a rise in during first week of the crash when other
assets and markets were starting to decline (Figure 6). The drop was also not that far
out of the range of typical volatility for the metal. This contrasted with major slumps
for the largest base metals markets, with copper collapsing nearly -20% at its lowest
point, and now still down -11.5%, and aluminum, hitting trough losses of nearly -10%
before rebounding to a -8.5% decline (Figure 8).
Iron ore interestingly did not face a major dip along with the other major base metals,
being down just -2.0% since late March, and did not reach even a -5.0% loss at its
lows. This is because the price had already declined substantially over the past year
and the market may already have priced considerable negative news. Iron ore
demand comes mainly from steel, which is in turn driven heavily by property and
construction demand in China, the troubles of which are well known to the market.
This contrasts with copper and aluminum prices, which had been trading near their
highs for the year, and the sudden slump in demand expectations could have been a
surprise to the market. Both are proxies for global industrial demand, the
expectations for which may have been downgraded as markets finally accepted a
period of higher tariffs had really arrived, even if their originally anticipated severity
may be reduced by US negotiations with many countries.
The mid-sized base metals markets nickel and zinc also saw extreme declines of well
over -10% at the lows, and were still down -6.5% and -9.3%, respectively, even after
the recovery. For the other precious metals, silver and platinum held up relatively well,
and are down just -2.4% and -3.1%, respectively. Both are partly driven by monetary
factors, similar to gold, which likely has offset some of the downward pressure on the
industrial factors that are the main drivers for these metals. Palladium was weaker,
down -4.9%, as it is more driven by industrial versus monetary factors than platinum.
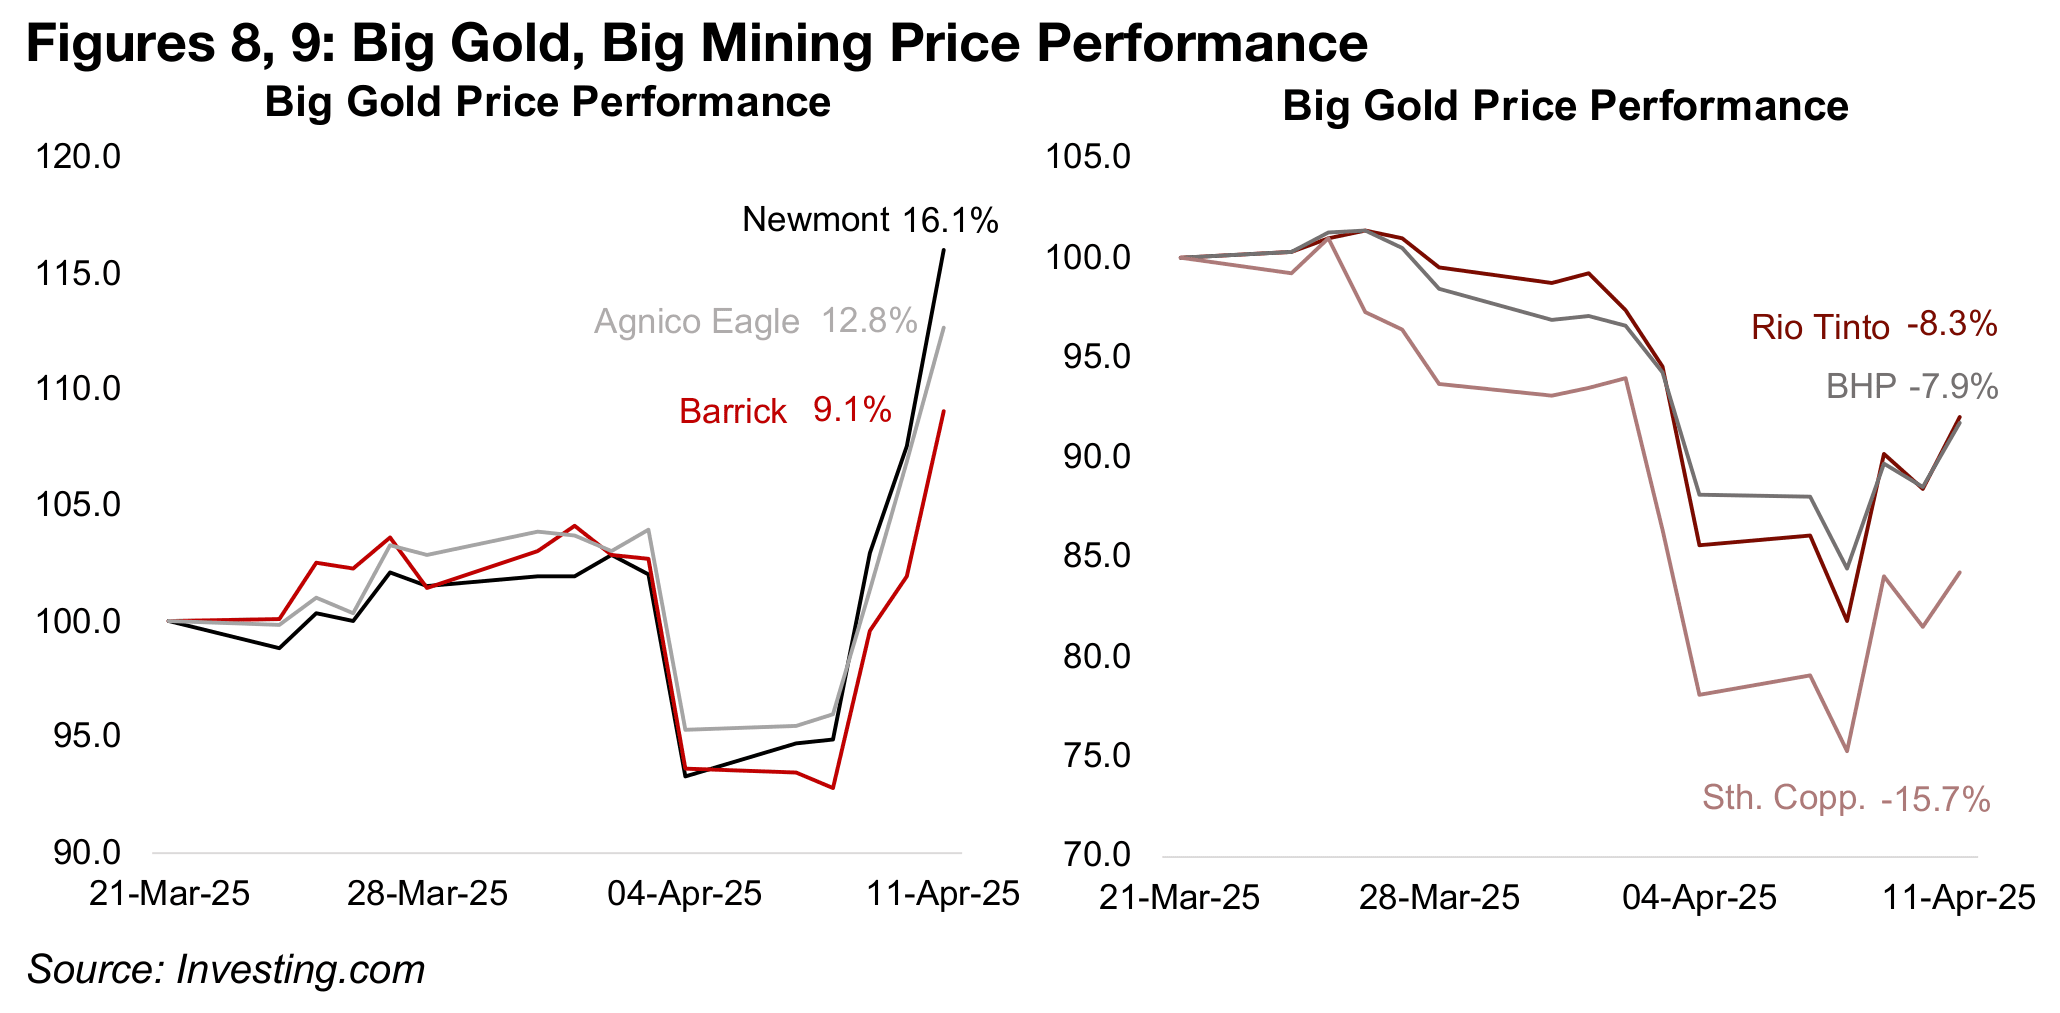
The three Big Gold stocks were key drivers of the gain in the GDX, given their large market caps and high weightings, with Newmont up 16.1%, Agnico Eagle 12.8% and Barrick 9.1% (Figure 8). Even at their lows they had only dropped by moderately over -5%, which was far above major global markets hit by declines of -10% or more at that point. This initial dip could have been driven by some forced selling of assets that had seen strong gains to cover losses in leverage positions in other sectors.
However, the market stormed back into the gold sector in the rebound based on
several factors. A key one was likely expectations that a tariff-driven economic
downturn could drive a major monetary expansion in response by global central
banks, with a rising money supply tending to drive up gold. Also there was the overall
rise in economic risk over the past two weeks, against which gold is considered a
major hedge. The gold stocks are also a leveraged play on a rise the metal price, and
the sector still trades at moderate valuations versus historical averages, especially in
contrast to tech, where multiples remain high even after the market decline.
The gold sector strength was in distinct contrast to weakness in Big Mining, with Rio
Tinto down -8.3%, BHP declining -7.9%, and Southern Copper losing -15.7% in the
crash. Southern Copper was off nearly -25% at its lows, as its price to book (P/B)
valuation had risen far above the sector after a long outperformance, increasing the
risk of an eventual reversal. BHP’s P/B remains moderate and Rio Tinto’s is quite low,
which may have provided a cushion for both during the crash. Southern Copper’s
earnings are almost entirely from copper, leaving it highly exposed to the plunge in
the metal. While BHP and Rio Tinto also have large copper segments, a major
proportion of their earnings is from iron ore, which held up in the crash.
While gold delivered as a safe haven in the crash, two other sectors that would have
normally also been expected to play this role, the US$ and US bonds,
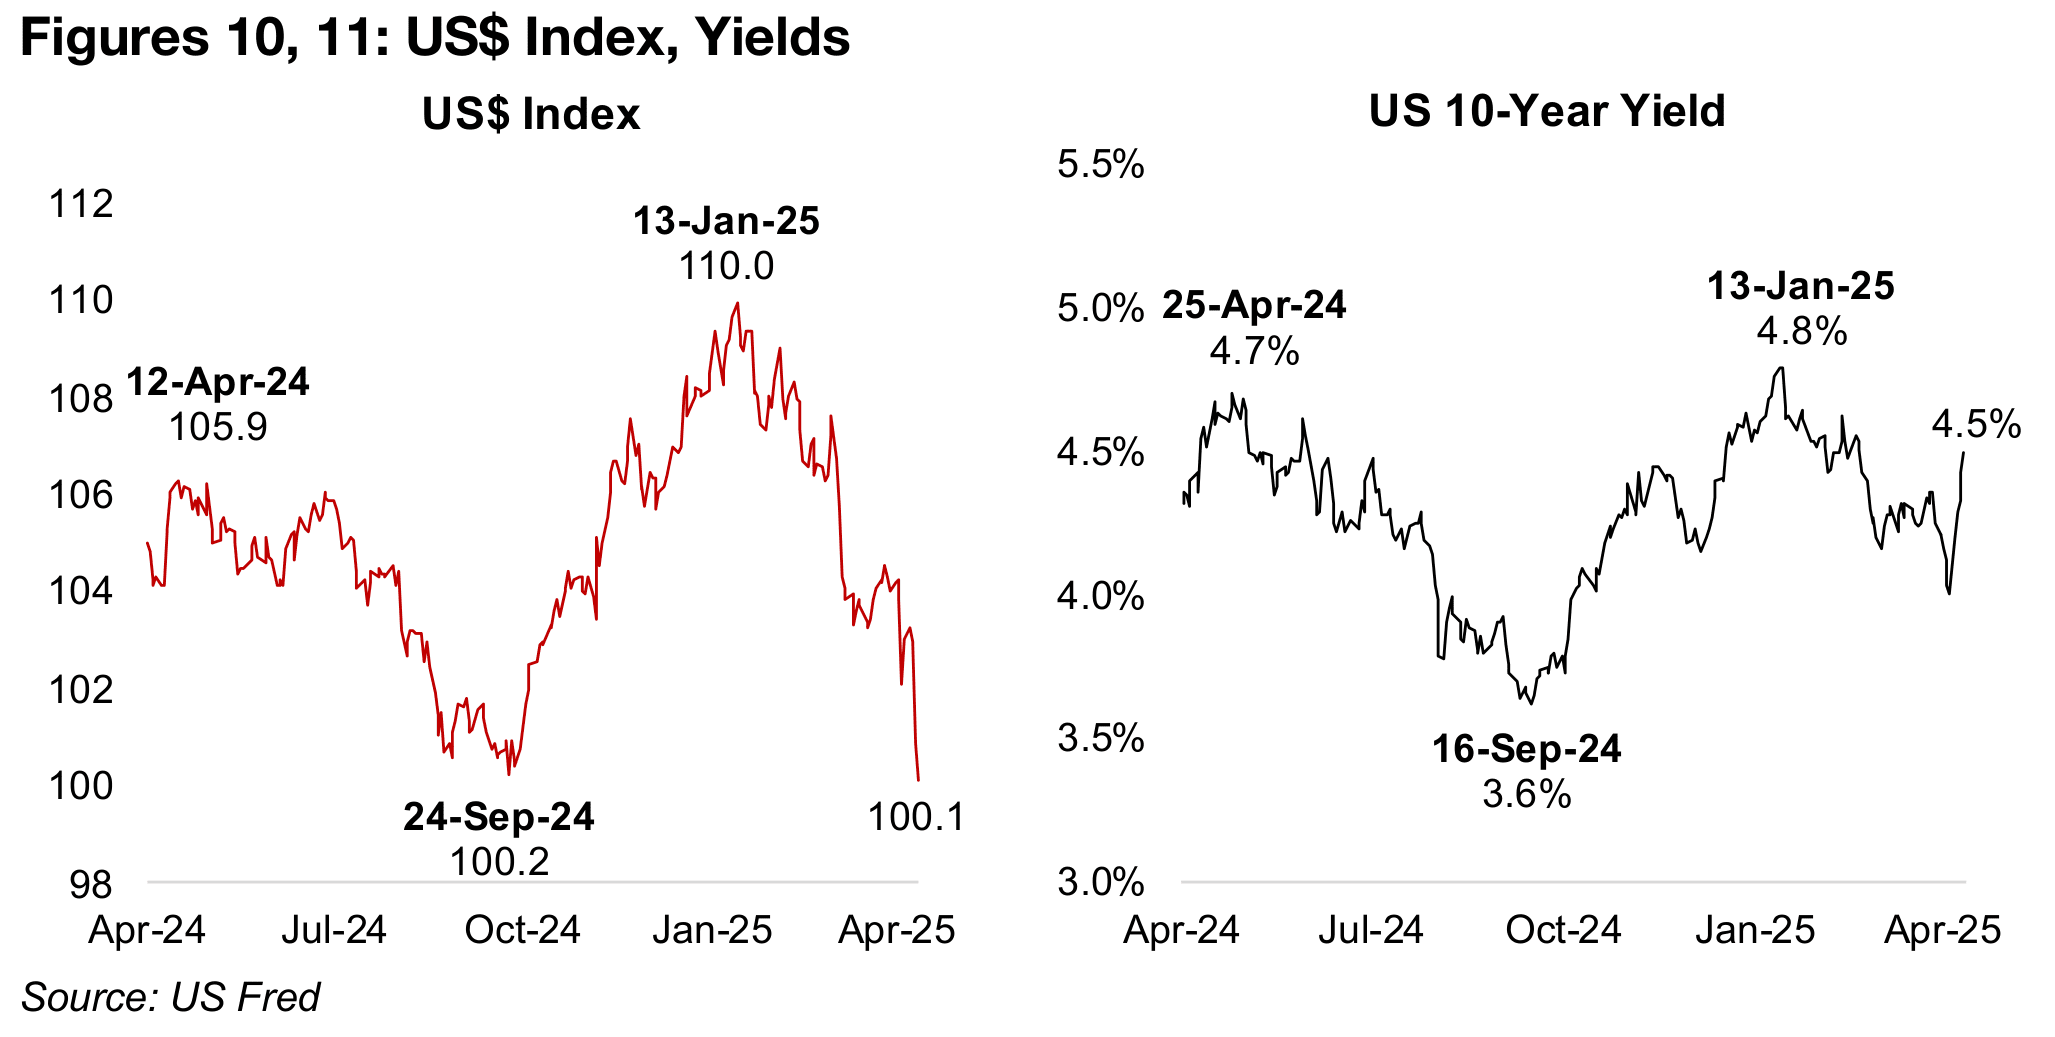
underperformed significantly. The US$ index had already been in decline from its
highs for the year on January 13, 2025 at 110 to around 104 just before the crash,
during which it plummeted to just 100.1, just under the previous lows of the past year
of 100.2 on September 24, 2024 (Figure 10).
As previous crashes often saw a major flight into the US$, this decline raised
concerns issues over the dollar’s role as a global reserve currency. We do believe it
is a bit early to be calling for the end of long-term US$ strength based on what has
been a very volatile period for many assets. However, a rise in global protectionism
looks set to continue, which could see some trading blocks move gradually more
towards leading regional currencies and substitute away from the US$. However, the
sheer size of the US economy ensures the US$ will remain a critical global currency.
While there has historically also often been a move into US bonds during periods of
extreme volatility, these assets were actually sold off heavily during the recent crash.
The US 10-year bond yield spiked to 4.5% from six months lows near 4.0% just prior
to the crash. This was heading for the highs of 4.7%-4.8% over the past year and
implies rising borrowing costs for global business which will also be starting to face
increased financial pressure from the rise in global tariffs. This could drive a more
conservative stance on investment and expansion by industry which in turn could see
broader economic activity start to slow.
While there has been fear of a global recession for nearly two years, one has still not actually erupted, although is widely expected that the recent crash could be the start of a downturn. As of March 2025, the Real Time Sahm Rule Recession Indicator actually showed subdued expectations of a US recession, with a decline to 0.3 from recent highs of 0.6 (Figure 12). However, the events of the past week imply this measure will likely have jumped in April 2025, and a level above 1.0 has historically indicated an almost certain economic downturn. Spikes to near 4.0 have occurred only twice, during the mid-1970s stagflation and in 2009 global financial crisis, and the high of 7.3 was in May 2020 during the extremely exceptional global health crisis.
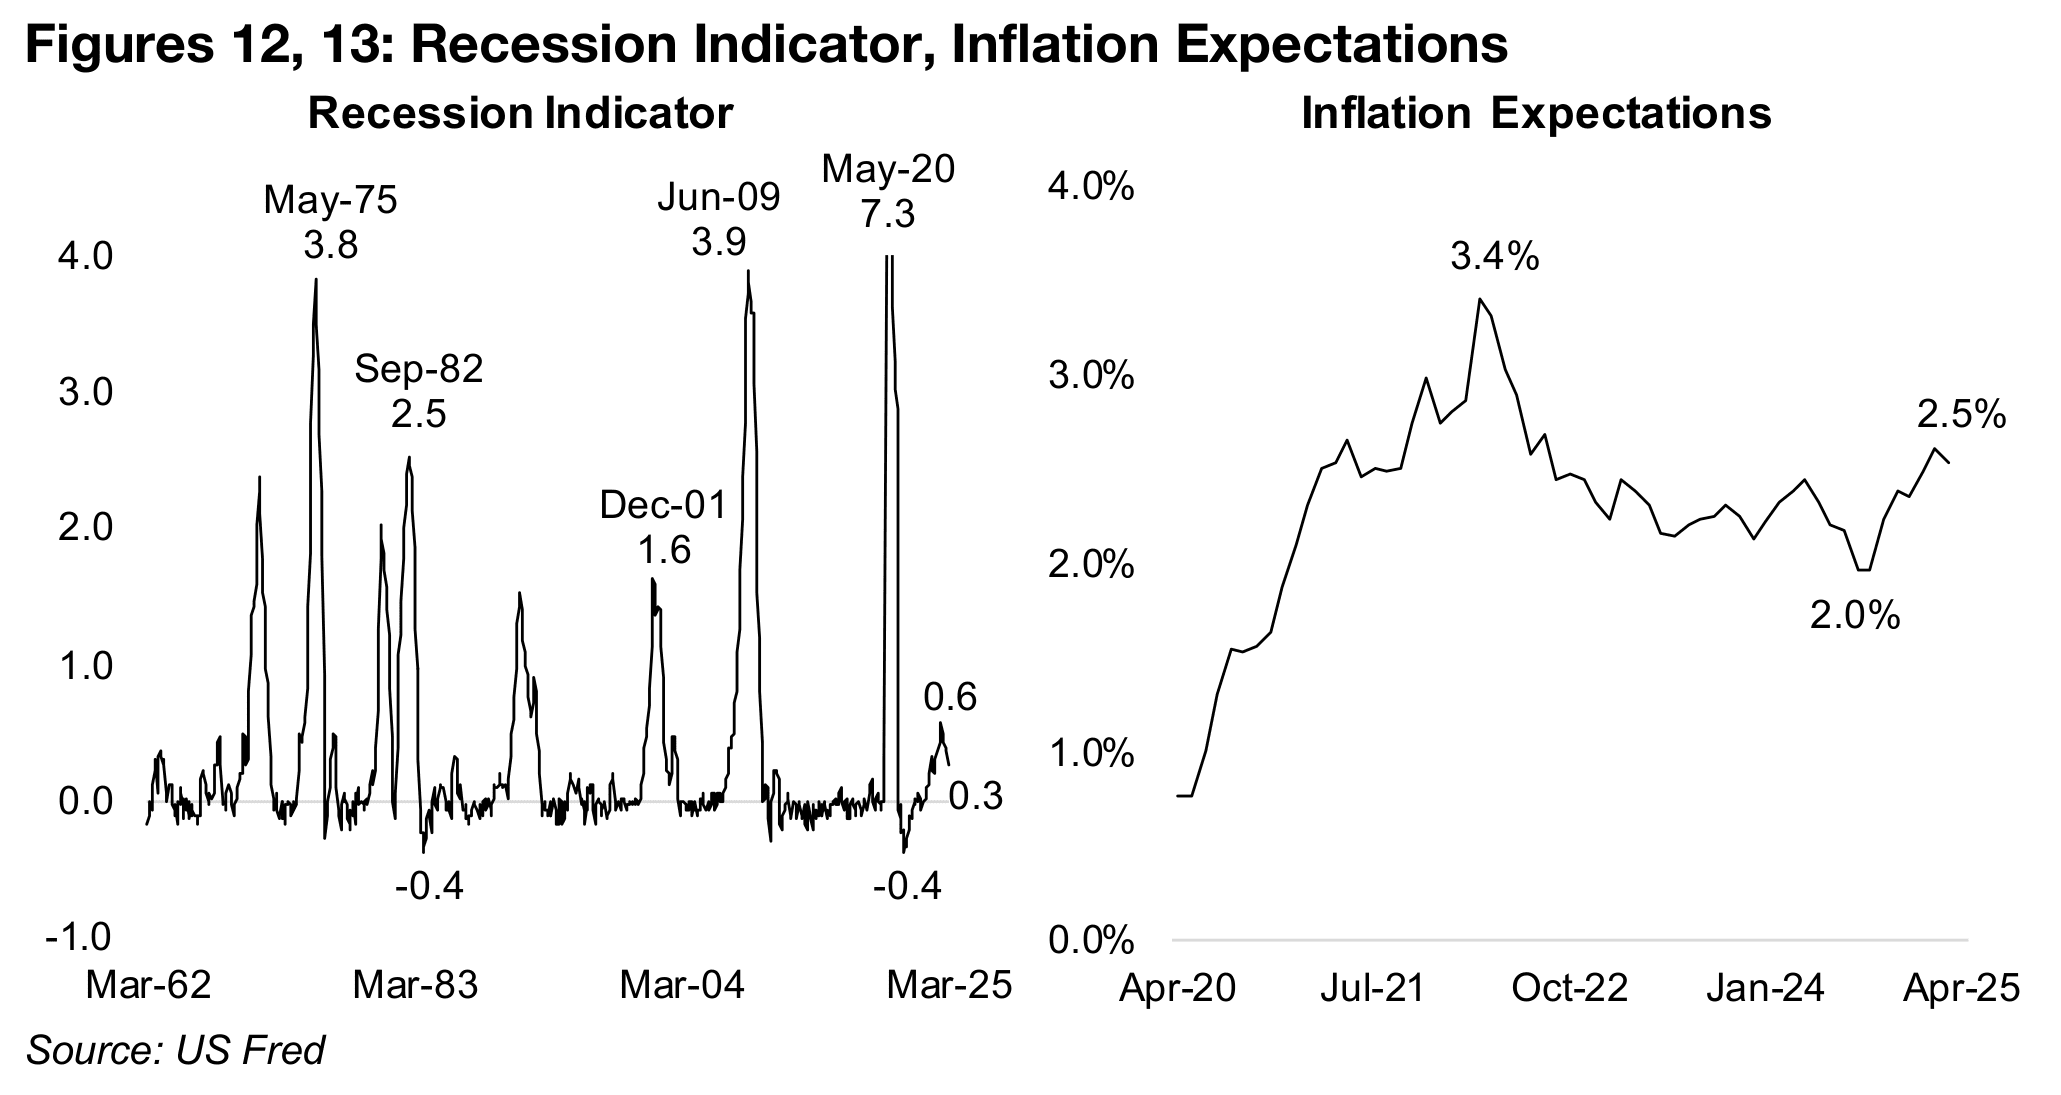
At the same time as there are fears of flagging global economic growth, there has also been a rise in US inflation expectations, to 2.5% from just 2.0% near the start of 2025 (Figure 13). This is based on the five-year breakeven rate, which compares the yield on five-year constant maturity treasuries to the five-year inflation-indexed constant maturity securities, which gives the market’s implied expectations for the inflation rate. A combination of declining growth and rising inflation would indicate a stagflationary scenario, which can be very negative for markets overall, but has historically been an upward driver for the gold price.
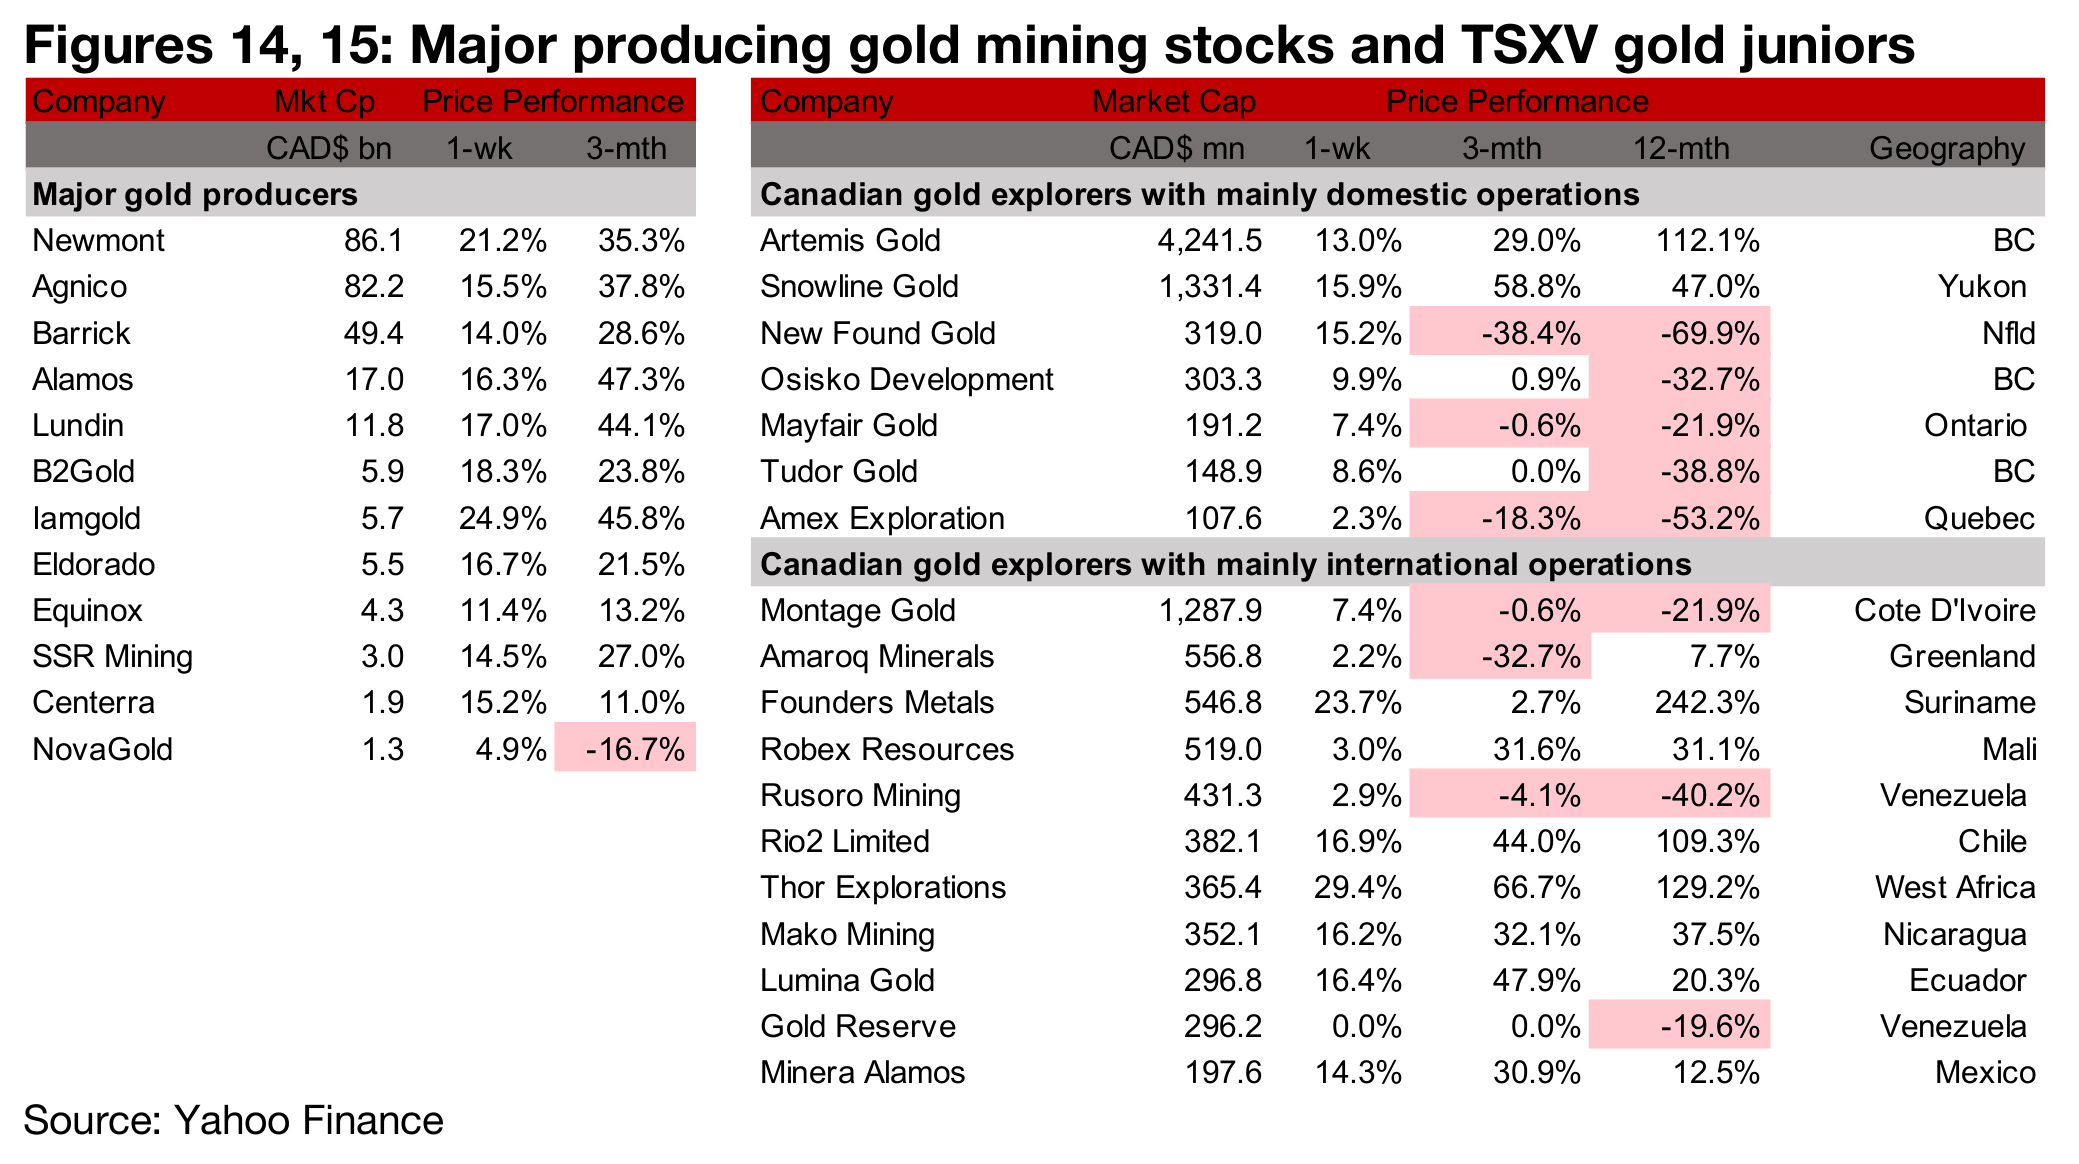
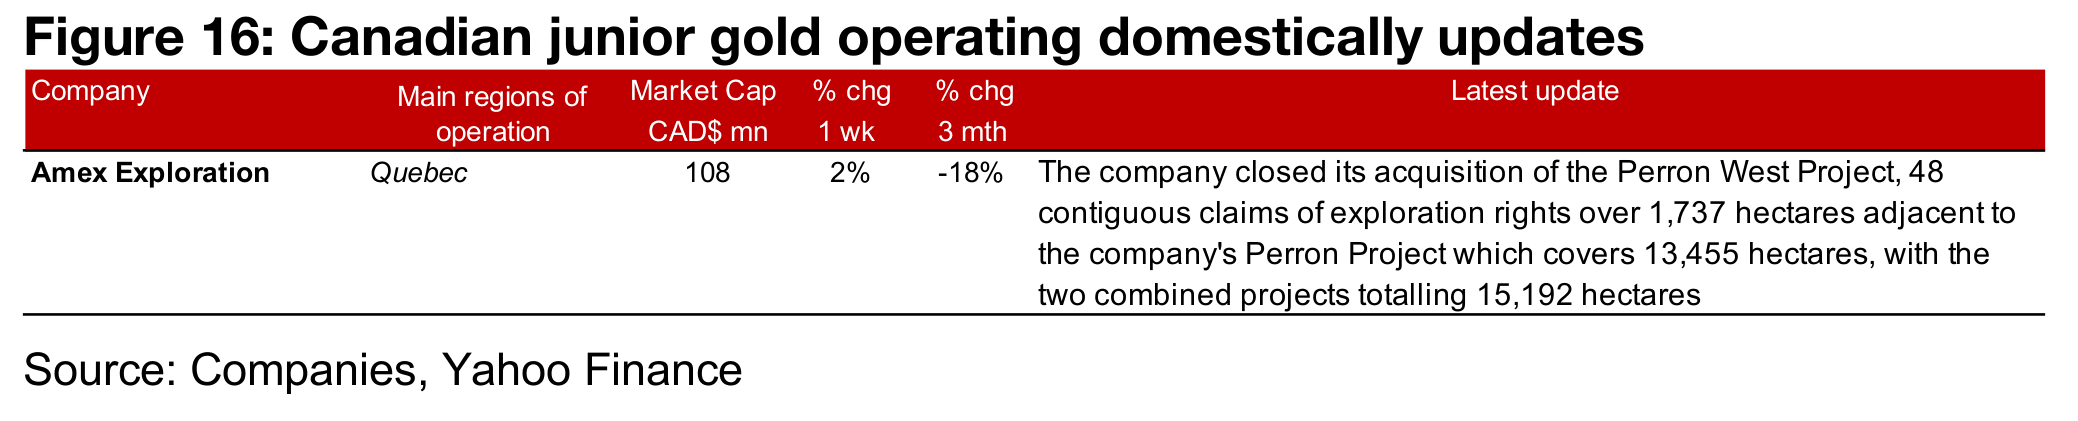
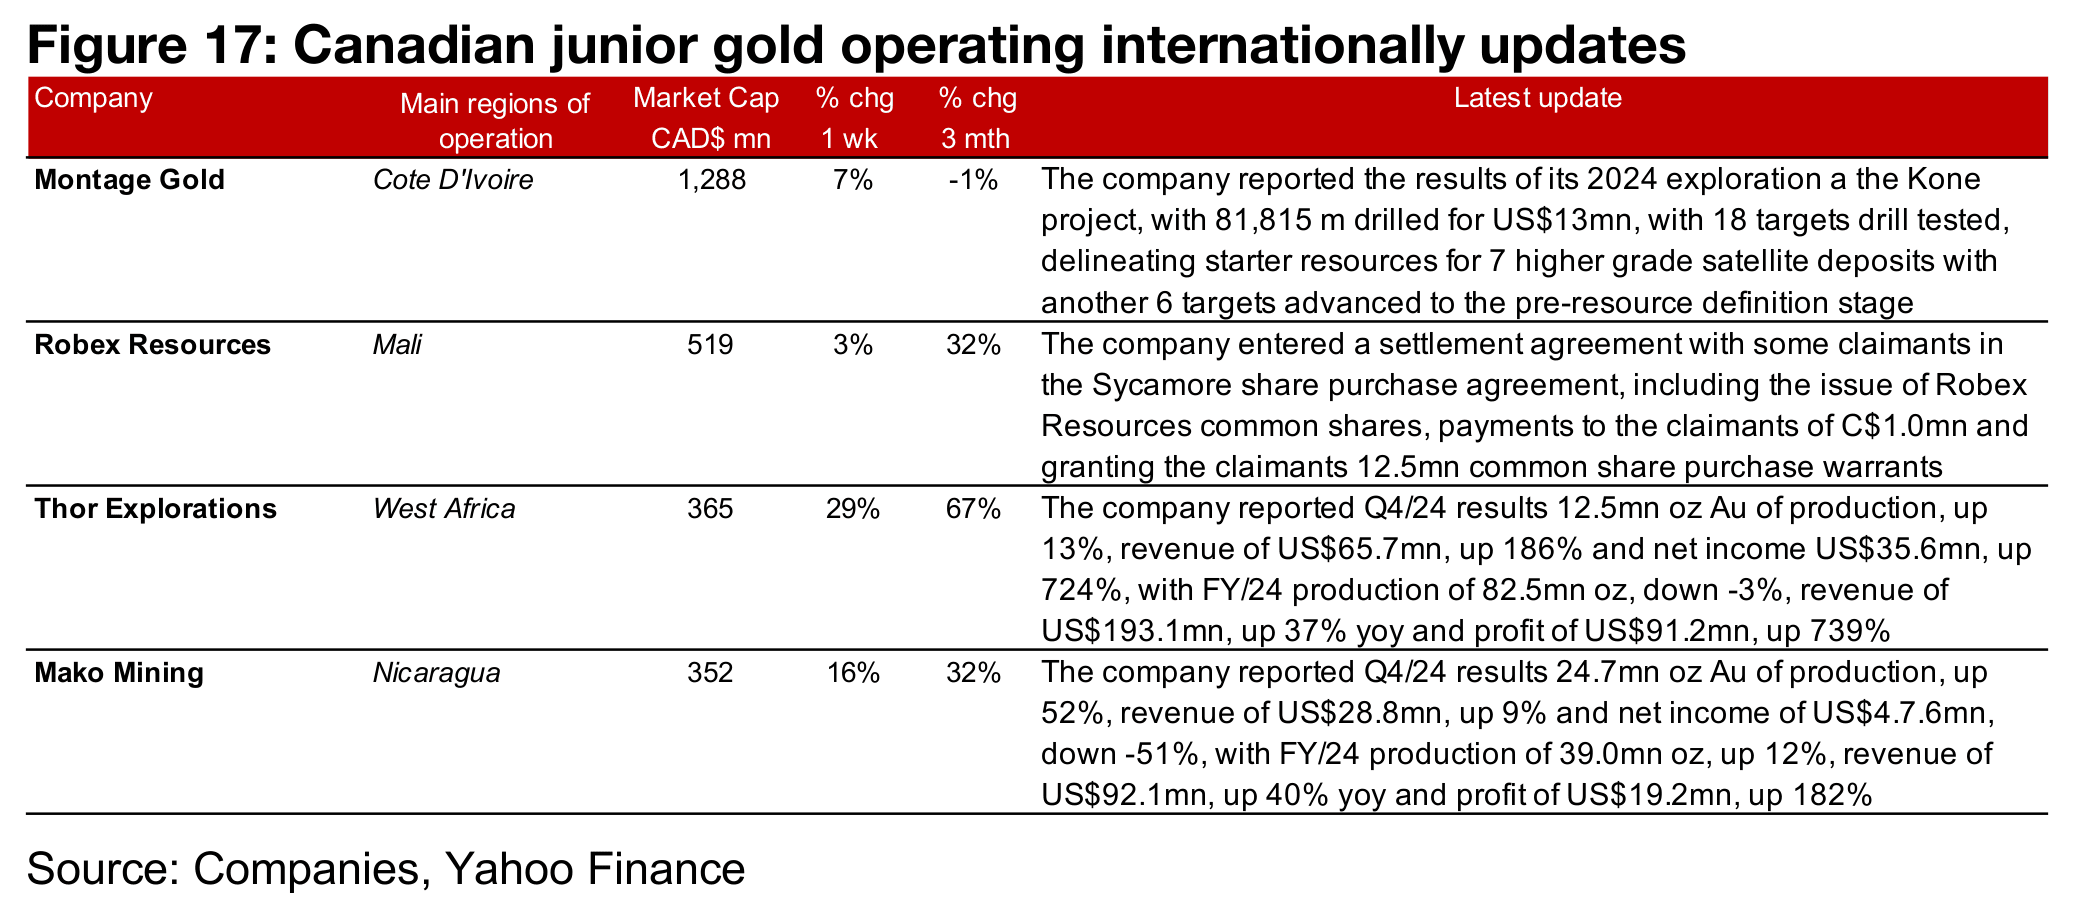
Almost of the major gold producers rose over 10%, and all of the TSXV large gold saw gains, with about half up by double digits on the rise in metal price, equities and overall risk (Figures 14, 15). For the TSXV gold companies operating mainly domestically, Amex closed its acquisition of the Perron West Project, adding 1,737 hectares to the 13,455 hectares of Perron for a total 15,192 hectares. (Figure 16). For the TSXV gold companies operating mainly internationally, Montage Gold reported the results of its 2024 exploration at Kone, Robex Resources entered a settlement with some claimants in the Sycamore share purchase agreement, and Thor Explorations and Mako Mining reported Q4/24 results (Figure 17).
Disclaimer: This report is for informational use only and should not be used an alternative to the financial and legal advice of a qualified professional in business planning and investment. We do not represent that forecasts in this report will lead to a specific outcome or result, and are not liable in the event of any business action taken in whole or in part as a result of the contents of this report.
Author
Ben McGregor authors the Weekly Roundup at CanadianMiningReport.com, providing sharp analysis of the metals and mining sector. With a talent for spotting trends, Ben distills complex market shifts into clear, engaging insights on TSXV junior miners. His weekly updates cover gold, copper, uranium, and more, blending data-driven perspectives with a knack for identifying opportunities. A vital resource for investors, Ben’s work navigates the dynamic junior mining landscape with precision.