
September 03, 2021
The gold price rose 0.9% this week to US$1,808/oz, and had trended up for a month from its most recent lows of US$1,723/oz as the market seems to be expecting a less than aggressive Fed, given mixed signals from recent inflation and growth data.
While there has been a slowdown the in monetary and public debt expansion in the US from historically exorbitant rates earlier this year, growth is still high, and given the lagged effect of these drivers, inflation could remain high even well into next year.
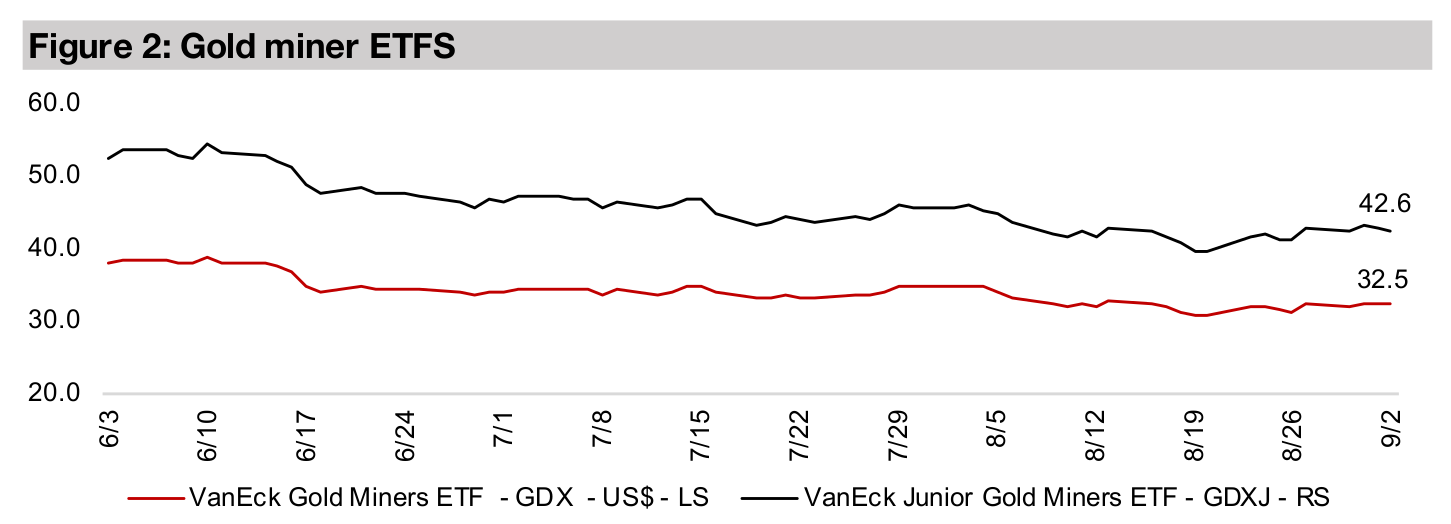
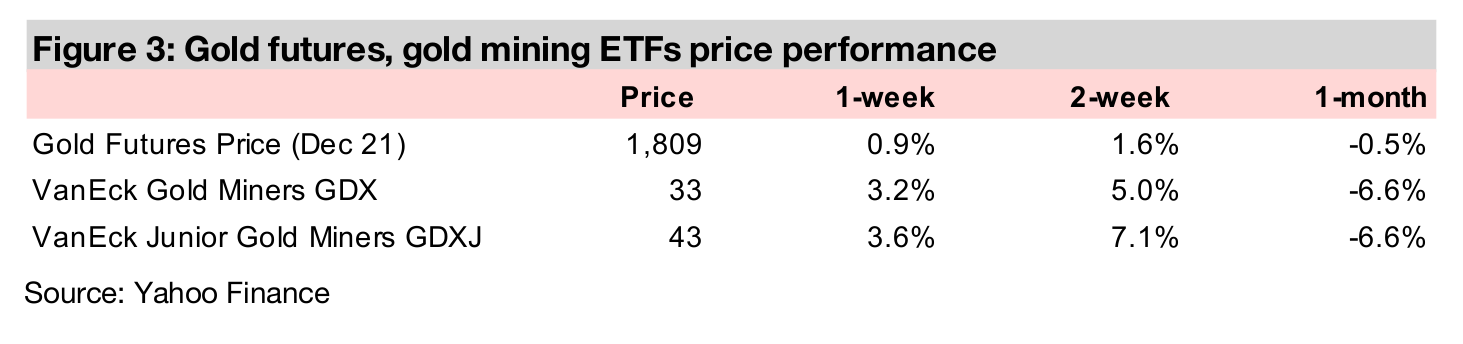
The producers and juniors rose, with the GDX up 3.2%, GDXJ up 3.6% and Canadian juniors mixed. In Focus this week are two early-stage explorers currently drilling, Eskay Mining, focused on gold in B.C, and Eloro Resources, silver-zinc in Bolivia.


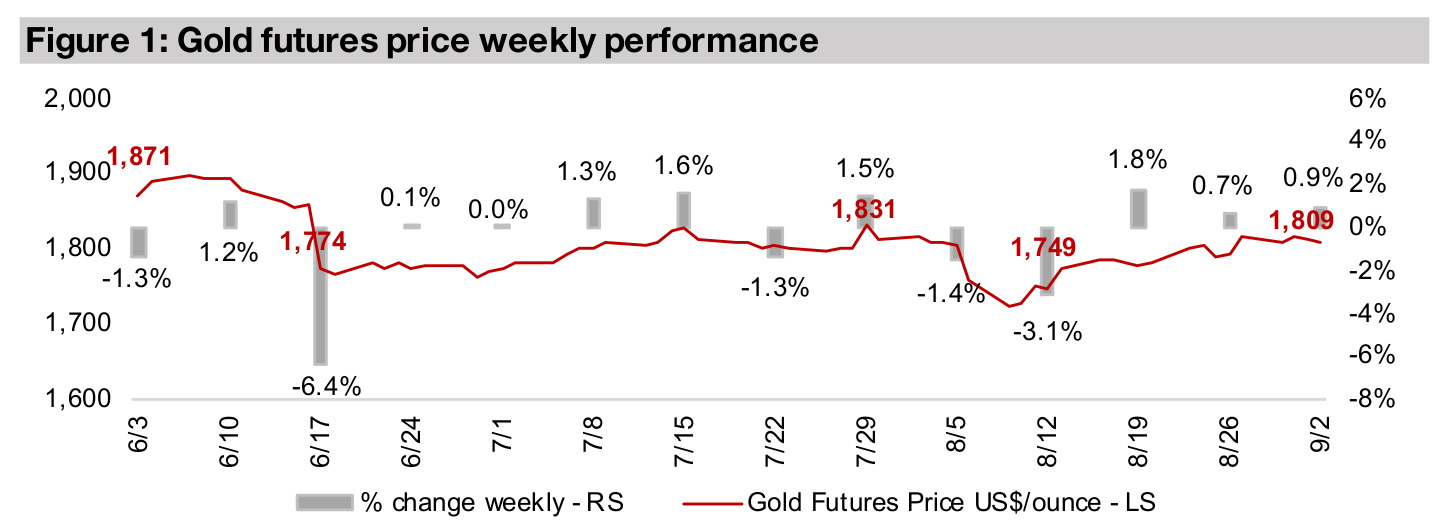
Gold was up 0.9% this week to US$1,809/oz, and continues to trend up over the past
month from its most recent lows of $1,723/oz, with the market remaining focused on
the potential for inflation, especially in the US, as a major driver for gold. This is
because inflation will be the big factor in determining what course the Fed takes,
whether to remain accommodative, or to pullback on its stimulus, and is in turn likely
have a strong effect on the gold price. Aggressive tightening would ostensibly put
downward pressure on gold, as investors would theoretically buy bonds in a rising
yield environment over yield-less gold, while loose monetary policy should support
gold, given its role as an inflation hedge.
The Fed's decisions will be based on its two core mandates; 1) keeping inflation from
getting out of control, while 2) keeping interest rates low enough to promote 'steady'
growth for the economy. Especially in the current situation, this has become a tricky
balancing act. The US and global economies are recovering, but inflation has also
been persistently high. So the question becomes, is this a truly strong recovery,
rooted in economic fundamentals, or has it mainly been generated by extremely
aggressive monetary expansion? If it is a solid recovery, then the Fed can safely start
to ease off on its monetary expansion, and growth will remain robust, but not overheat,
and inflation can be kept under control. If, instead, the recovery proves fragile, and
mainly propelled by easy money, the Fed could be endangering growth by pulling
back its stimulus.
We lean towards the latter view, and believe that given the distortions and disruption
to the economy caused by the global health crisis over the past year and half, that
the recovery is precarious. This would imply that aggressive tightening by the Fed
could easily burst the economic recovery, not to mention global stock markets at all-
time highs, and a booming US housing market which is extremely reliant on low
interest rates. Given all of this, we believe that even if the Fed does start to tighten it
will only be a very gradual process, and that actual rates hikes will still be well over a
year away, and that even then, they are likely to be gradual. The net result is that
inflation likely still has substantial room to run, in our view.
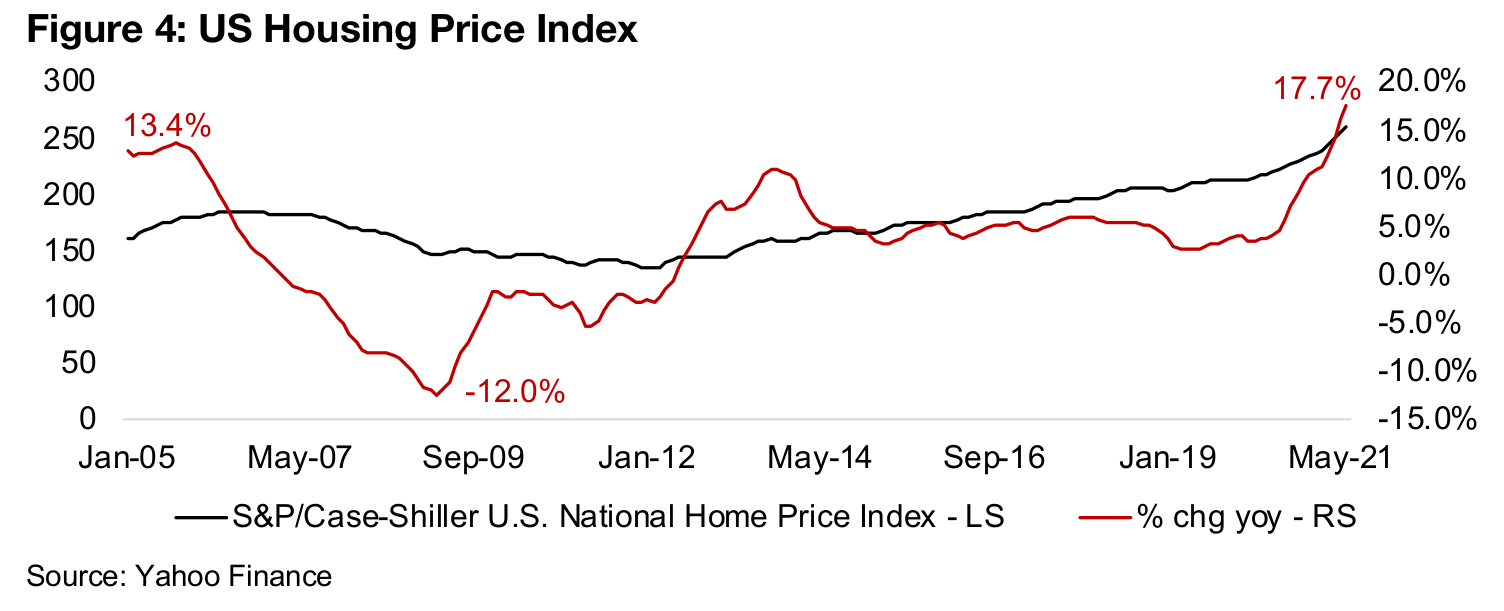
Recent data on inflation remains mixed for now, and we show the most recently
updated data on the US Housing Price Index (Figure 4), US public and private debt
(Figure 5), and US, Europe and Japan M3 money supply (Figure 6), below. The US
Housing Price Index was up 17.7% yoy, showing that the monetary expansion of the
past year continues to flow through strongly into the housing market, and the growth
is above even the peak 13.4% reached in the 2005 housing bubble. If the 2008 crash
taught us anything, it is that pumping up housing bubbles through easy money can
have dire consequences that can ripple out far beyond the real estate sector.
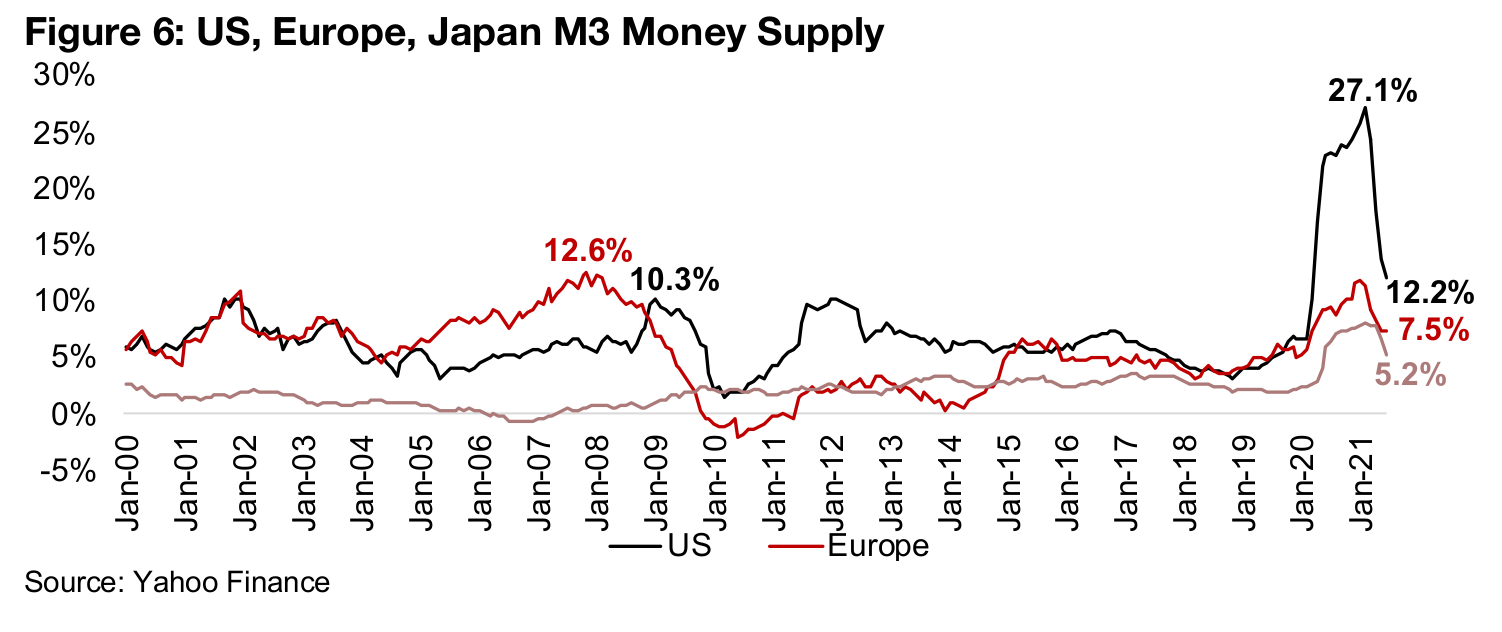
While global money supply growth is looking less egregious than the
hyperinflationary-esque numbers earlier this year, especially from the US, it is still
very high in historical terms. US M3 money supply growth peaked at 27.1% in
February 2021, and while it has pulled back to 12.2% as of the most recently reported
June 2021 data, this is still very high in the context of the past several decades, and
well above the 10.3% peak reached during the financial crisis in January 2009.
We have also seen M3 money supply growth pull back in Europe, from a peak at 11.4%
in February 2021 to 7.5% in June 2021, and in Japan from a peak of 7.8% in April
2021 to 5.2%. While the growth in Europe is now below the 12.6% peak set in
November 2007, it is still well above the average growth over the past twenty years
of 5.3%, and the average from 2011-2019 of just 3.6%. Japan's money supply growth
is still at very high levels compared to the last two decades, when M3 money supply
growth was just 1.8%.
While these M3 Money Supply growth figures are easing, we still need to consider the lag between money supply growth and its effect on consumer prices, as it takes time to get from the monetary authorities to the banks, and then out into the wider economy. This process can take well over a year, and therefore the current jump in US home prices could be driven by money originally unleashed as long ago as mid- last year. This would also suggest that the money supply growth, which was still spiking as recently as February 2021, could still be affecting consumer prices well into 2022. Meanwhile, with the M3 growth rate still high, and enough to be quite inflationary, we would probably need to see a decline to at least single-digits before we could consider the money supply growth to have returned to 'reasonable' levels.
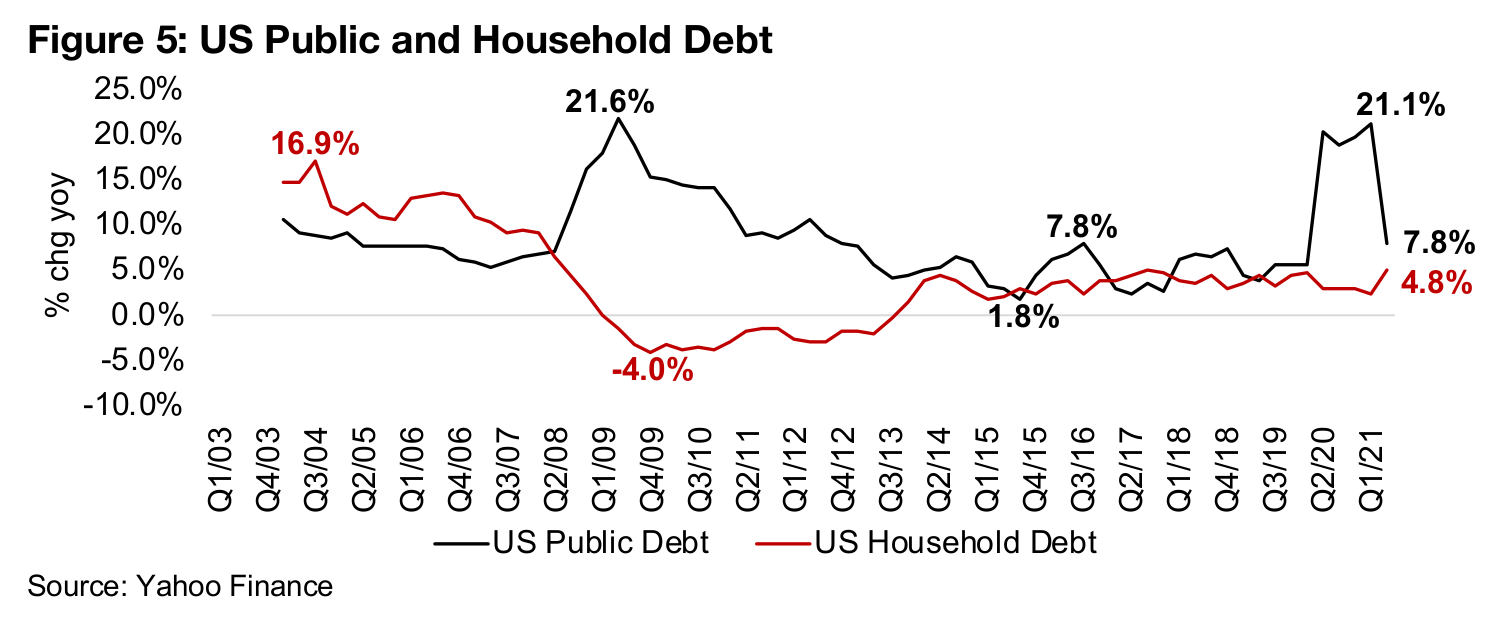
US public and private debt is also showing some mixed signals. Public debt growth
has come down considerably, to 7.8% in Q2/21 from a peak at 21.1% in Q4/20. This
could be expected given the decline in the money supply, given that government
bonds are issued to increase the money supply, and so the two are highly correlated.
However, the current rate of public debt growth is still reasonably high in the context
of the past five to six years. Private debt shows a different story, up 4.8% in Q2/21,
the highest rate since before the 2008 crash, and off lows of -4.0% reached in Q4/09.
As private borrowing will tend to encourage purchases by consumers such an
expansion of debt can be a driver of inflation.
The public debt and money supply increase of the past year is making its way through
to consumers and driving inflation, with CPI Index growth in the US over the past two
months at its highest levels since the 2008-2009 financial crisis. While the growth of
both of these indicators are off their highs, they are still both growing rapidly, and
private debt growth is running hot. This suggests that inflation could persist for some
time, and may not have peaked, and there could be a long lag before the recent
slowdown in these indicators leads to a pullback inflation. Given that we expect that
Fed action will not be aggressive, and that inflation could surprise to the upside, this
should at least support the current gold range, if not sending it significantly higher.
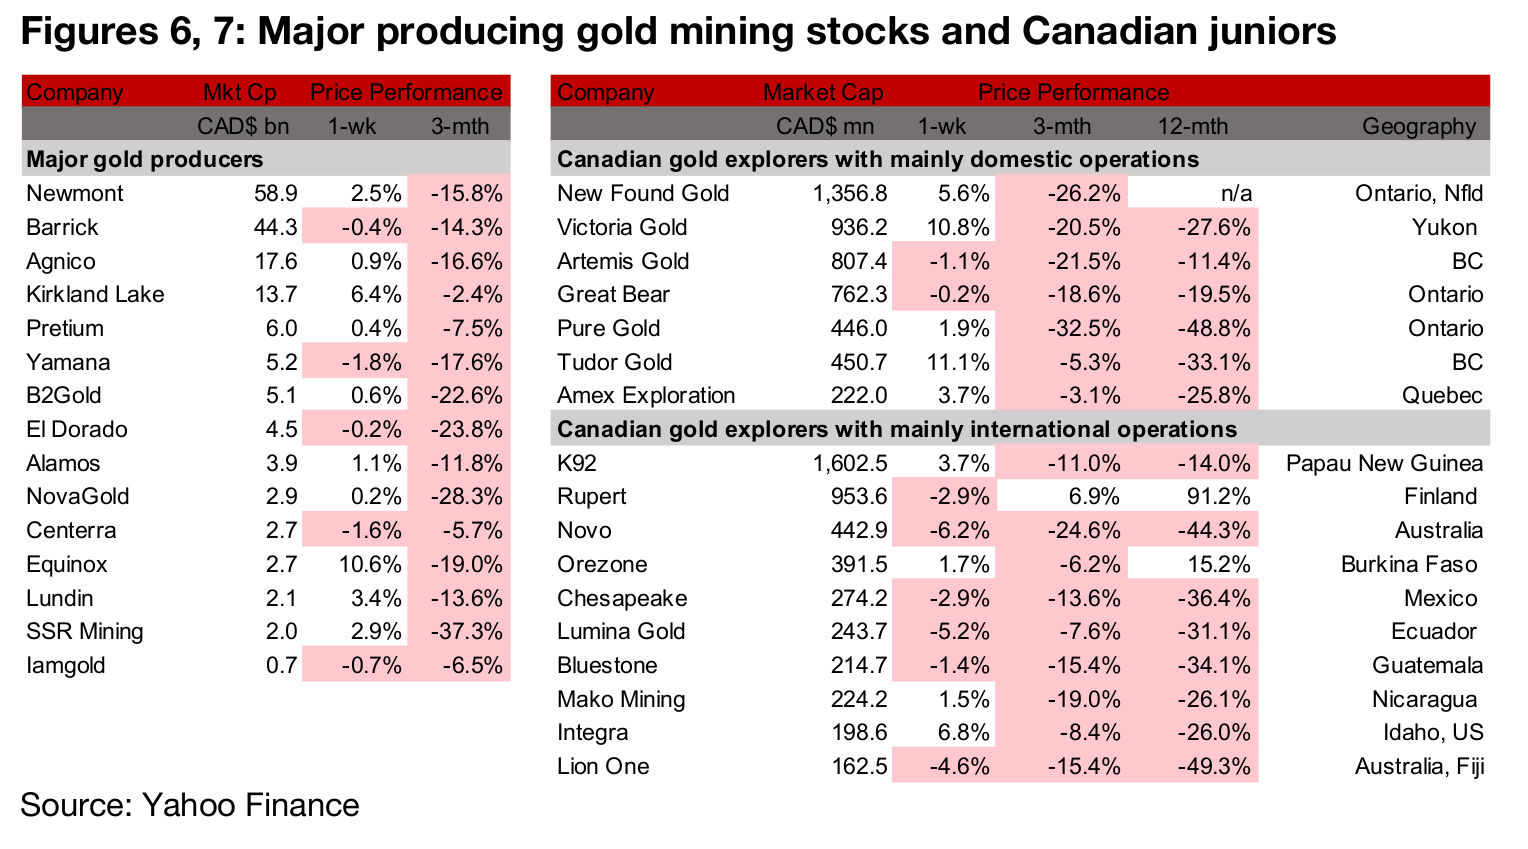
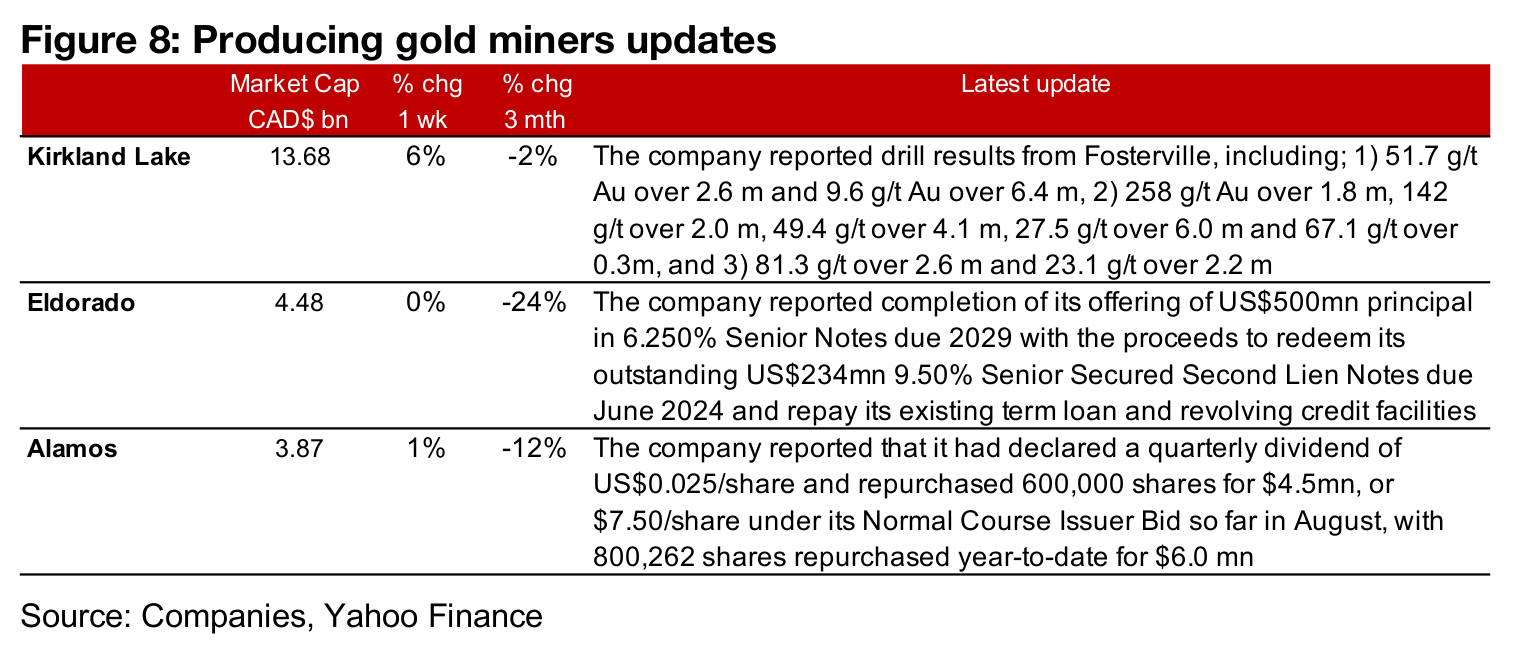
The producing gold miners mostly rose as gold picked up (Figure 6). Kirkland reported drill results from Fosterville and Eldorado completed its offering of US$500mn in principal of 6.250% Senior Notes due in 2029, with proceeds to be used to redeem existing debt. Alamos announced a quarterly dividend of US$0.025/share and so far has repurchased 600,000 shares for $4.5mn, or $7.50/share under its Normal Course Issuer Bid in August (Figure 8).
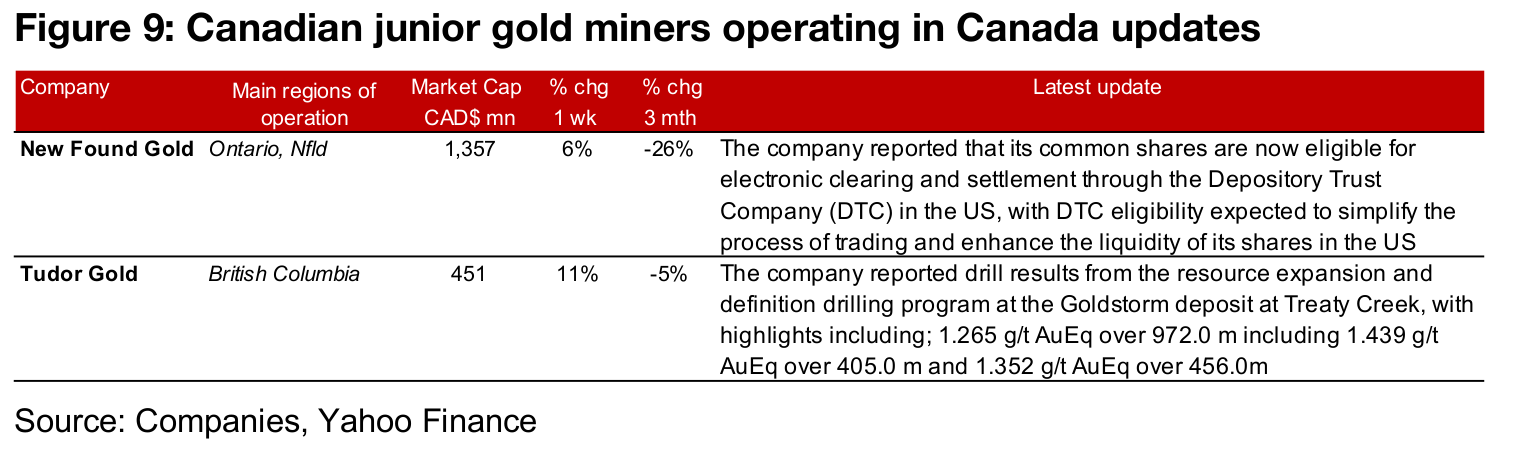
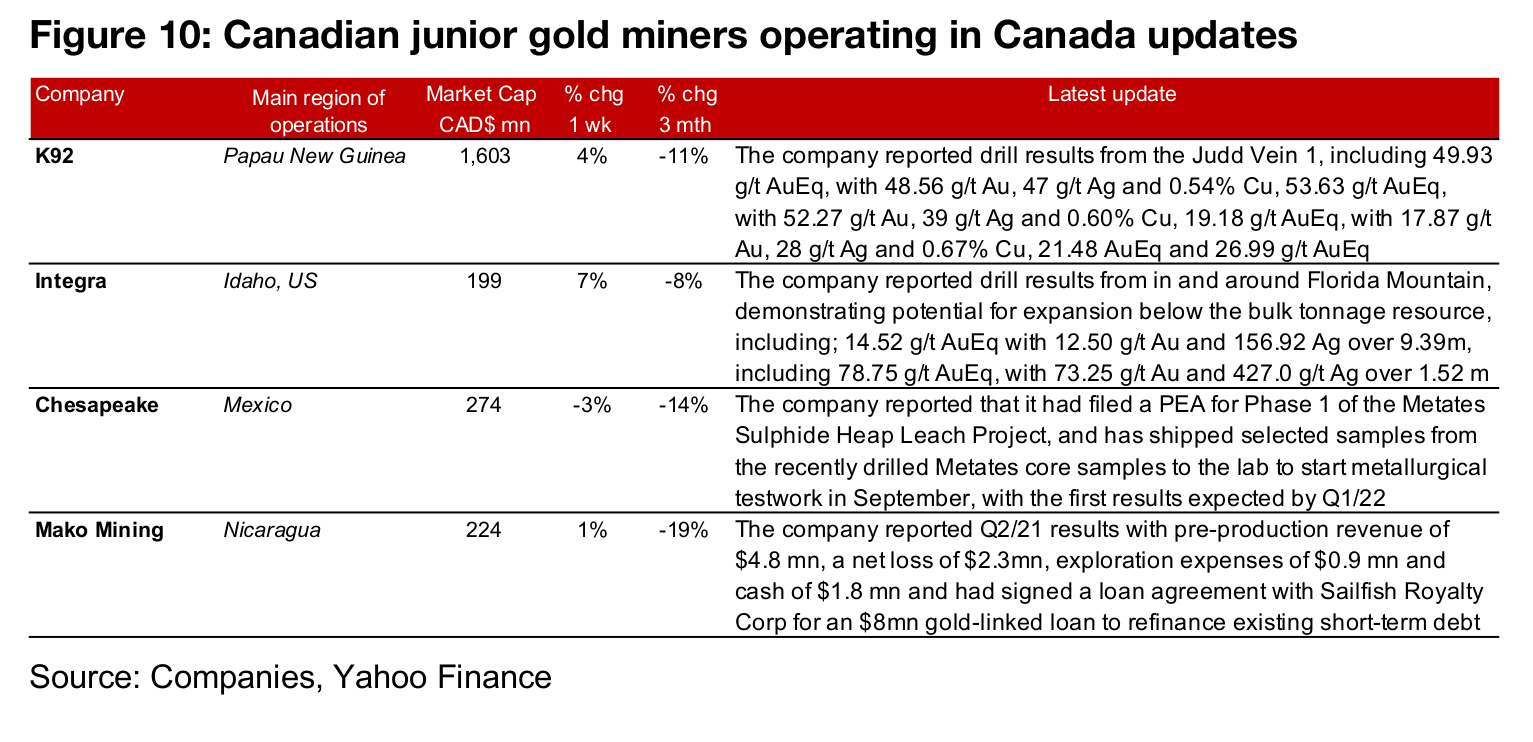
The Canadian juniors were mixed even as gold rose (Figure 7). For the Canadian juniors operating mainly domestically, New Found Gold reported that its common shares are now eligible for electronic clearing and settlement through the Depository Trust Company, allowing for easier trading of the shares in the US. Tudor Gold reported drill results from the resource expansion and definition drilling program at the Goldstorm deposit at Treaty Creek (Figure 9). For the Canadian juniors operating mainly internationally, K92 reported drill results from the Judd Vein 1 and Integra reported drill results from in and around Florida Mountain, indicating potential for expansion below the bulk tonnage resource. Chesapeake reported that it had filed a PEA for Phase 1 of the Metates Sulphide Heap Leach Project and shipped selected samples from recently drilled Metates core for lab work from September 2020. Mako reported its Q2/21 results, and the signing of a loan agreement with Sailfish Royalty Corp for an $8mn gold-linked loan to refinance existing short-term debt (Figure 10).
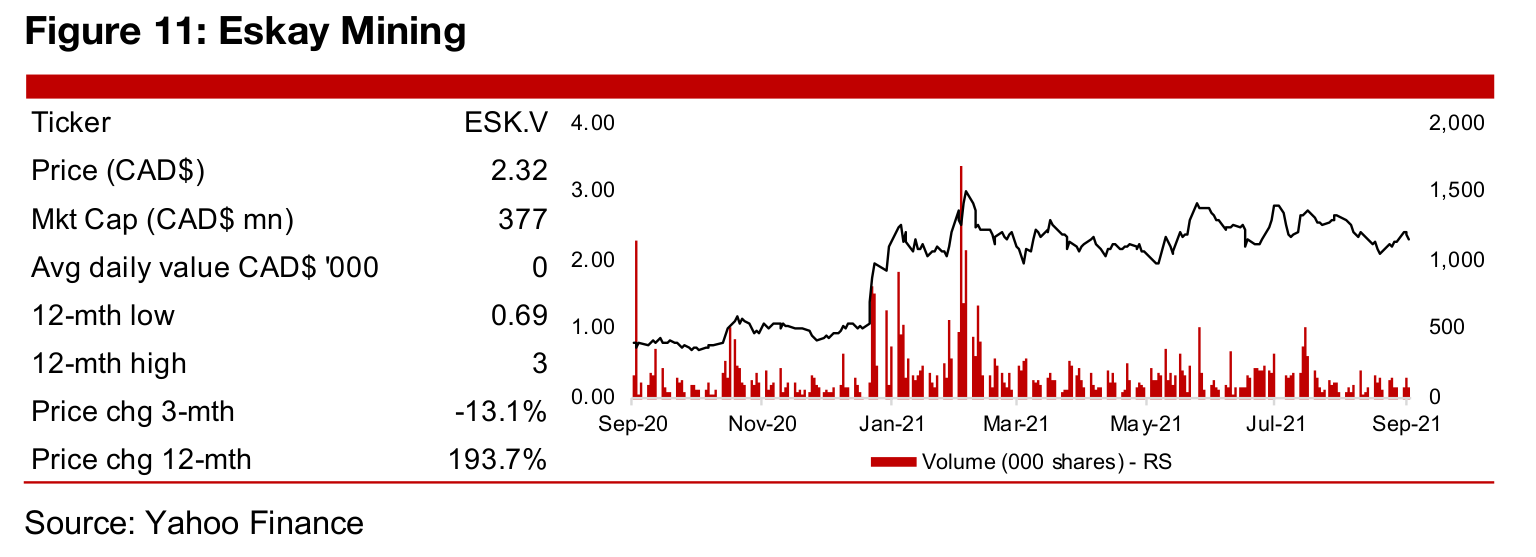
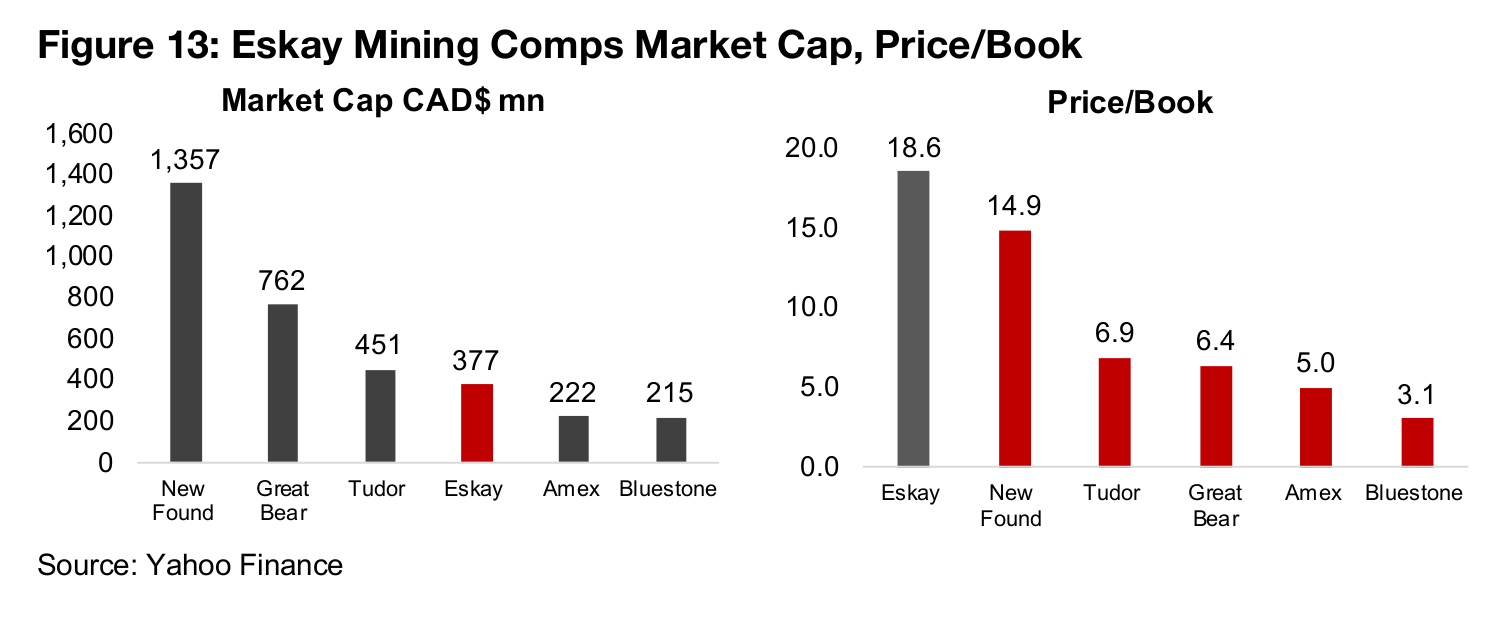
Eskay Mining owns a 52,600 h.a. land package in British Columbia’s Golden Triangle, in an area surrounding by major gold deposits, including Barrick's past producing Eskay Creek Mine, Pretium's currently producing Brucejack Mine, Seabridge's KSM Project, with a PFS for two projects, and Tudor Gold's Treaty Creek Project, where a drill program is ongoing. The project has access to infrastructure including a paved highway, new 287 kV power line, two ports and two airports near the project and a strong regional workforce and supplies. British Columbia is also a reasonably mining amenable district, with a clear procedure for obtaining permits.
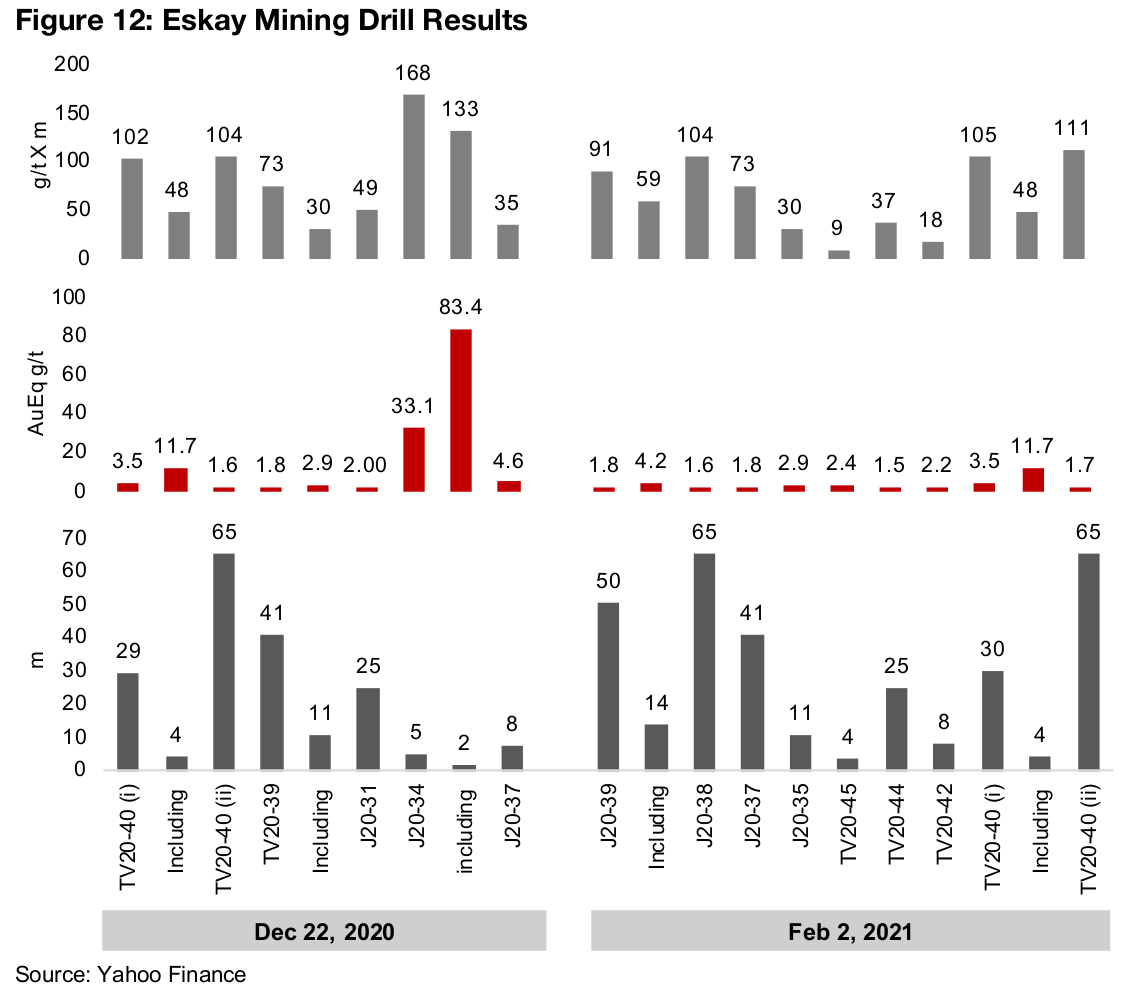
The company started a 30,000 m 2021 drill program in June 2021 and released the results from its property-wide SkyTEM survey starting in July 2021, which has led to the identification of several new potential drill targets. The company's most recently released drill results were on December 22, 2020 and February 2, 2021, shown in Figure 12, with highlights of 33.1 g/t AuEq over 5.1 m, 83.4 g/t AuEq over 1.6 m, 3.5 g/t AuEq over 29.9 m and 1.7 g/t AuEq over 65.2 m. The next major catalyst for the share price will likely be results from the current drill program.
News flow since the February drilling results has included the acquisition of 19.5% of Garibaldi Resources from the Sprott Foundation and 100% of the SIB Property, previously a JV with 20% held by St. Andrew, which has been converted to a 2% NSR. The company’s most recent financing round was $13.8mn closed in December 2020, leaving it well funded for exploration in 2021. Eskay is up 193.7% this year, with the gains mainly after the two drill results releases. It trades at the top of a group of TSXV-listed gold explores in a similar market cap range, on an 18.6x Price/Book valuation, putting its above even New Found Gold, one of the market's favourite plays this year, with its nearly monthly string of strong drill results in 2021 (Figure 13).
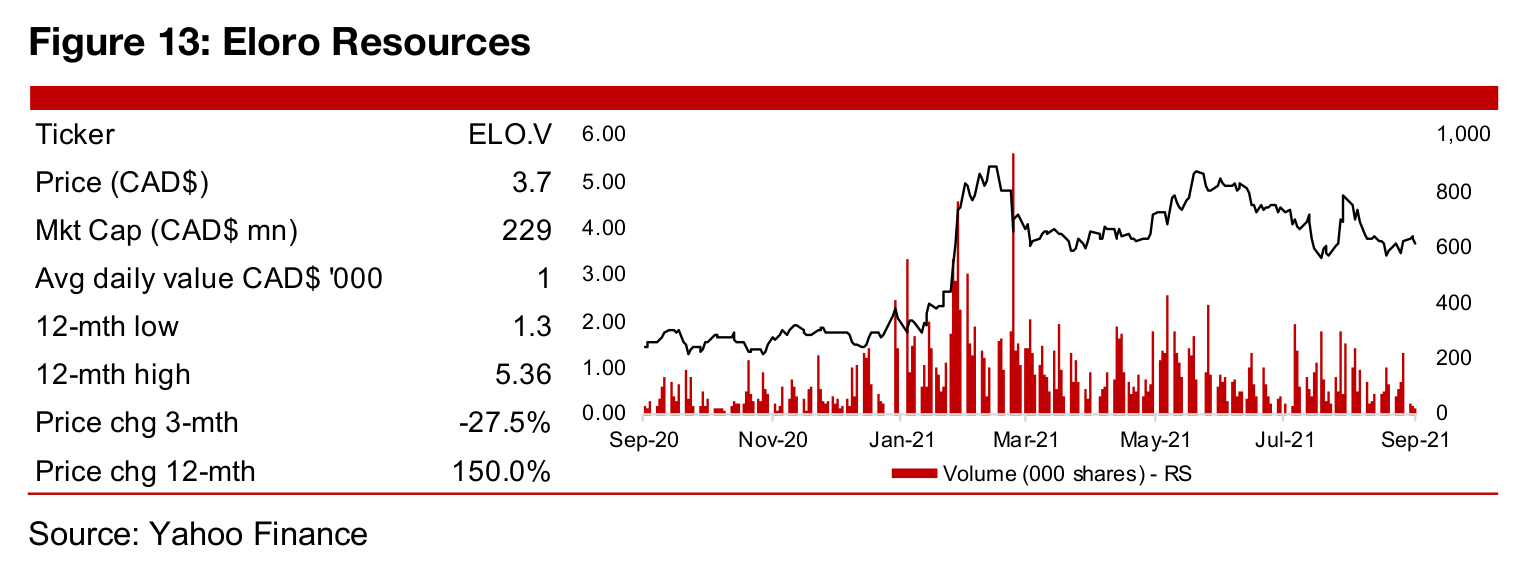
Exploring silver-zinc Iska in Bolivia, gold-silver La Victoria in Peru
Eloro Resources' two main projects are in South America, both at early stages of
exploration. The company holds an option to acquire 99% of Iska in Bolivia, a 900
h.a. polymetallic project, especially silver and zinc, which has been the focus of
exploration since 2019, with a drill program ongoing, and limited historical exploration.
The company also owns 82% of the gold-silver La Victoria project in Peru, a 8,930
h.a. gold-silver property which had been the focus of exploration from 2016-2018
Recent series of Iska drill results, permitting update for La Victoria
Eloro reported a series of drill results from Iska this year, including; 1) 129.6 AgEq
over 257.7 m in January 2021, 2) 442 g/t AgEq over 166 m, including 1,092 g/t AgEq
over 56.2m in April, 2) 196 g/t AgEq over 56.2 m including 342.98 g/t AgEq over
27.5m and 122.7 g/t AgEq over 123.6 m and 105.4 g/t AgEq over 173.6 m in May,
and 3) 129.65 g/t AgEq over 300.75 m in July. In August 2021, the company provided
an update La Victoria, with an agreement made with local communities facilitating
further permitting, with exploration activity to recommence in September 2021.
Major financing completed, shares range trade on silver price
The company completed a $6.3mn bought deal financing in January, 2021 closed a
second $25.0 mn bought deal financing in March 2021, upsized nearly double from
the originally announced $12.9mn initially targeted. This leaves the company fully
funded for continued major exploration through 2021 and 2022. The share price is up
150.0% this year on the rise in silver and strong drilling and financing results, but is
down -27.5% over the past three months as the silver price has stagnated.
Disclaimer: This report is for informational use only and should not be used an alternative to the financial and legal advice of a qualified professional in business planning and investment. We do not represent that forecasts in this report will lead to a specific outcome or result, and are not liable in the event of any business action taken in whole or in part as a result of the contents of this report.
Author
Ben McGregor authors the Weekly Roundup at CanadianMiningReport.com, providing sharp analysis of the metals and mining sector. With a talent for spotting trends, Ben distills complex market shifts into clear, engaging insights on TSXV junior miners. His weekly updates cover gold, copper, uranium, and more, blending data-driven perspectives with a knack for identifying opportunities. A vital resource for investors, Ben’s work navigates the dynamic junior mining landscape with precision.