
January 04, 2021
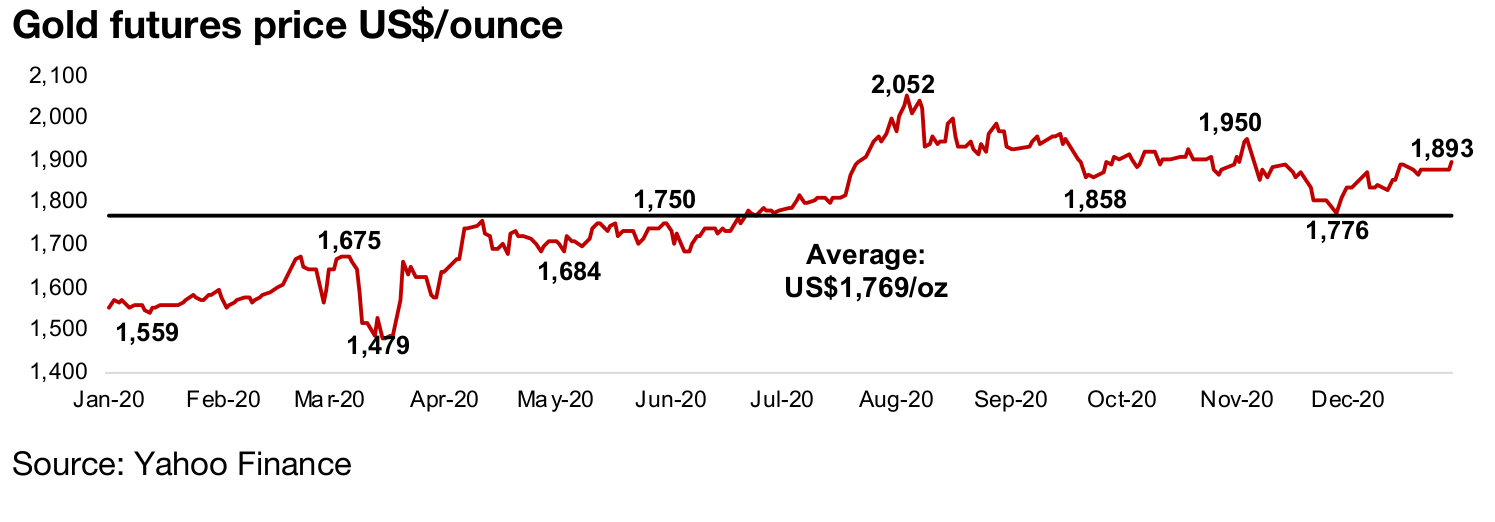
Gold had a big year in 2020, up 24.6%, and averaging US$1,769/oz, its second strong year in a row after gaining 18.4% in 2019, and continues to emerge from a long winter, where it lost -22.8% from 2013 to 2018. It was not all easy sailing, though, in this tumultuous year, with a major dip early in the year, a surge to ten year highs on global health crisis risks by mid-year, and finally a moderate decline as global health crisis fears faded with the introduction of vaccines. Gold weathered all this to close at $1,893/oz, and with consensus 2021 forecasts averaging US$2,149 for 2021, and the core drivers still strong, gold may be set for gains of 20% or more this year.
While in this report we look at several drivers influencing the gold price, we see them mostly being driven by a single major underlying driver, that being a massive ongoing monetary expansion. We believe that this expansion will continue in 2021, and that there is little chance that global monetary authorities will shift to any type of significant monetary contraction over the next year (or possibly two), and that this will continue to support gold. Also supporting gold is rising risk aversion in markets, starting in mid-2019 and exacerbated by a risk-heavy 2020, while risk had been quite ignored over 2013-2018, and led to less demand for a safe haven asset like gold.
Both the producing and junior miners had a big year, driven the surging gold price, even with the global health crisis and the major mine shutdowns in the middle of the year. Producers were obvious beneficiaries of the higher gold price, with the sector's revenue growth strong year on year, and net income growth even stronger given the strong leverage to the gold price. The juniors were also supported by rising gold, as investors maintained a major increase in funding of exploration activities that started in second half 2019, and several Canadian juniors saw share price gains of several hundred percent. The outlook for both producers and juniors is set to remain strong throughout 2021, in our view.
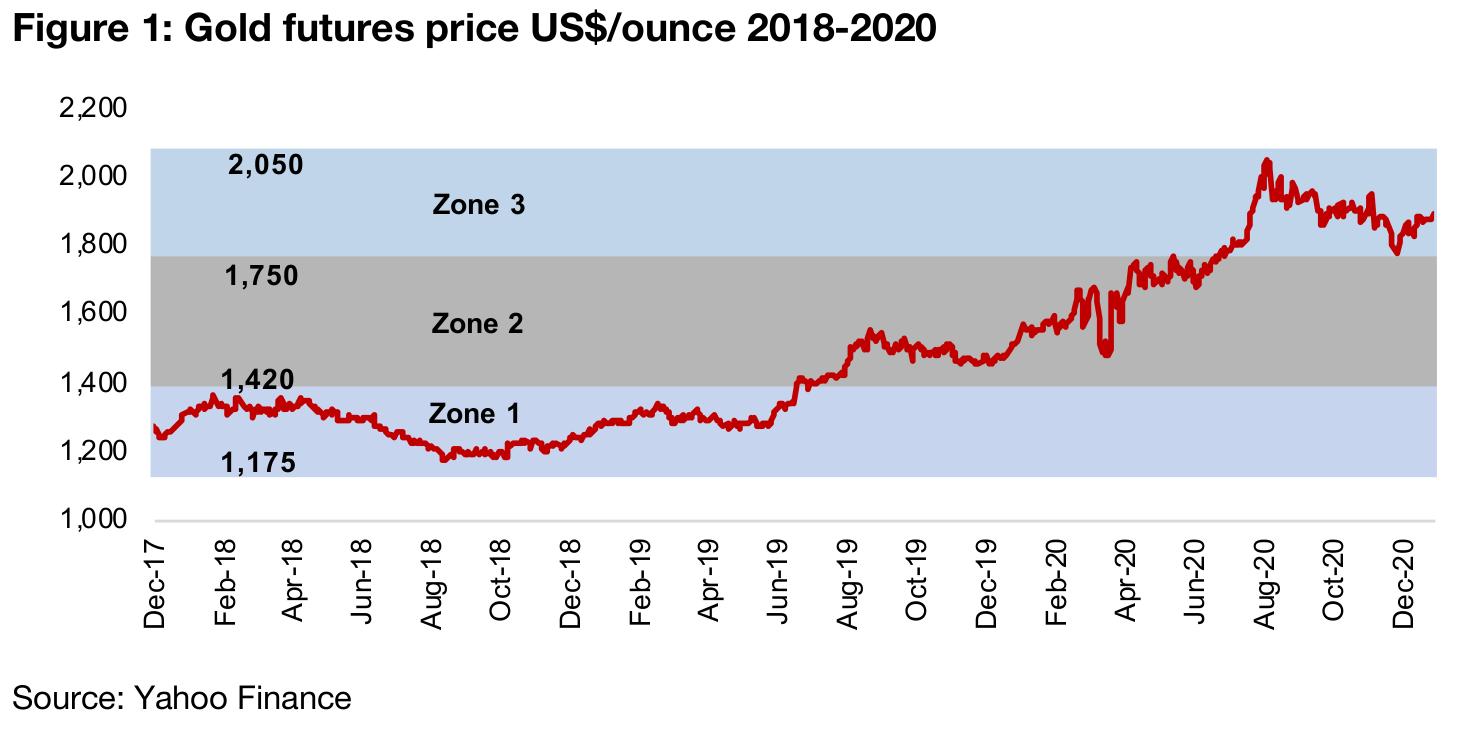
In Figure 1 we put gold's rise in the context of the past three years and three 'risk zones'. The first 'risk zone' starts well before this chart, around 2013, at the start of gold's 'long winter', with prices languishing around an average of US$1,268/oz from 2013 to 2018. This put many major mines just on the edge of profitability, and was generally an uninspiring period for the industry, for juniors, producers and investors. Fortunately, 2018 was gold's last year in these doldrums, with a price ranging from US$1,175/oz-US$1,420/oz. The global money authorities had started to raise interest rates in 2018, and with a global bull market in almost every asset class (except for gold) nearing eight years, the market started to become a bit more concerned with risk than it had been in many years.
The global monetary authorities put their interest rate hikes into reverse in 2018, as it appeared that any attempts to exit very low rates were going to have some dire consequences in markets. At this point, with the monetary expansion back on and risks rising, gold began to pick up in 2019, into what we view as Risk Zone 2, pushed up as high as US$1,750/oz. Then 2020 took this base level of risk and cranked it up, with a spike in gold into what we view as Risk Zone 3, driven by the severe fears of the global health crisis, with gold reaching over US$2,050/oz. Peak levels of fear have since abated as vaccines have been introduced, and gold has declined to around the bottom of Risk Zone 3. For the 2021, we expect that gold will remain in Risk Zone 3, but not because of another wave of acute global health crisis fears, but rather from the underlying driver of continued global monetary expansion.
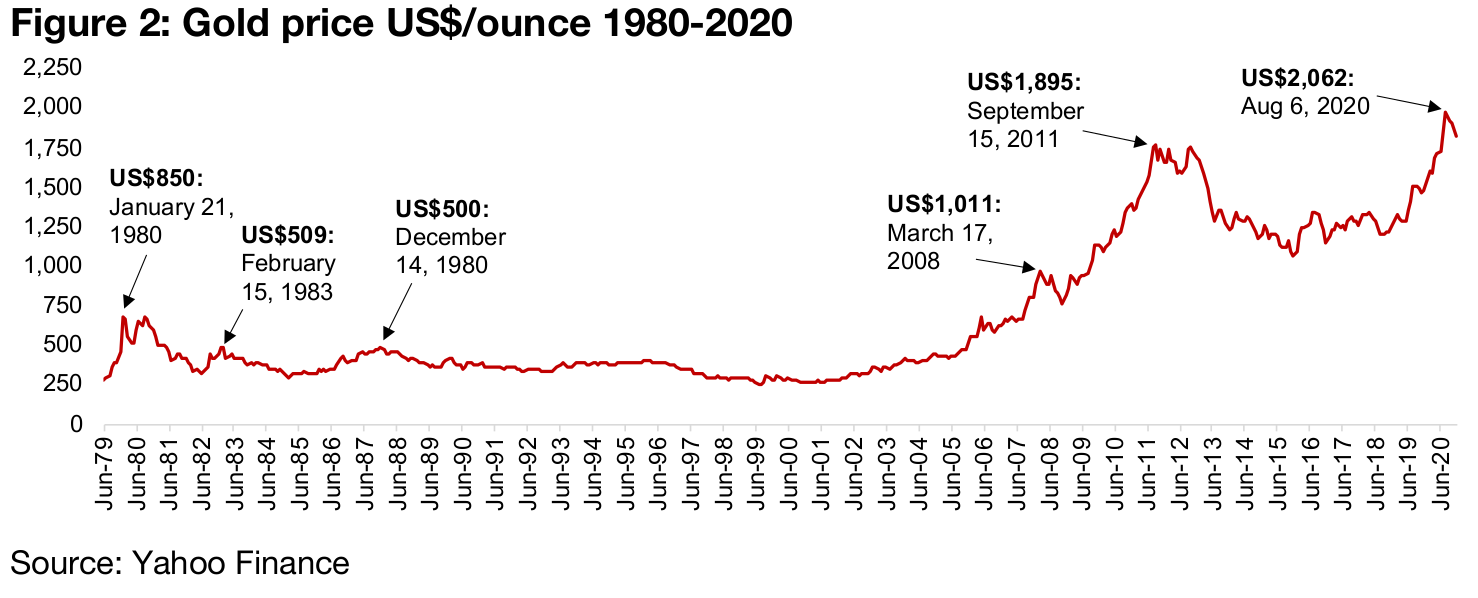
In Figure 2 we show the long-term trend of the gold price since the late 1970s (until the mid-1970s, gold was fixed versus the dollar), reaching all-time highs this year with an intraday average on August 6, 2020 of US$2,062/oz, topping the US$1,895/oz reached on September 15, 2011. As shown in more detail later in this report, we believe that the core driver long-term for gold has been a major monetary expansion, starting in the U.S. especially from the early-2000s, and becoming increasingly global since. So while a quick look at the chart might suggest the market is getting exuberant, we have to consider the context of an unprecedented monetary expansion.
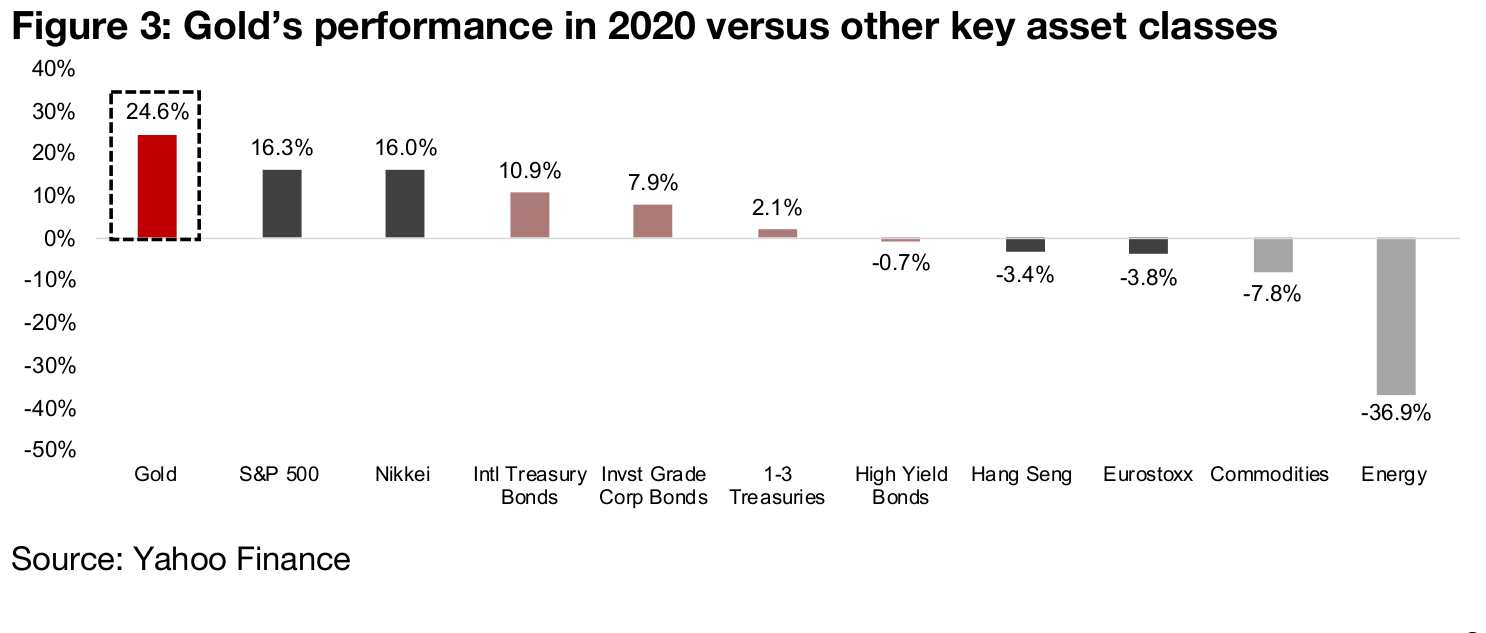
Gold's performance was stronger than all other major assets classes this year (Figure 3). Its 24.6% gain outpaced the stronger-performing equity indices, with the S&P 500 up 16.3% and the Nikkei up 16.0%. It more than doubled the return of International Treasuries, up 10.9%, and beat corporate bonds, up 7.9% and 1-3 Year US Treasuries, up 2.1%. Other asset classes declined, with high-yield bonds, the Hang Sang Index and the Eurostoxx Index down -0.7%, -3.4% and -3.8%, respectively. Commodities fell -7.8%, mainly because of energy, the worst performer, down -37%.
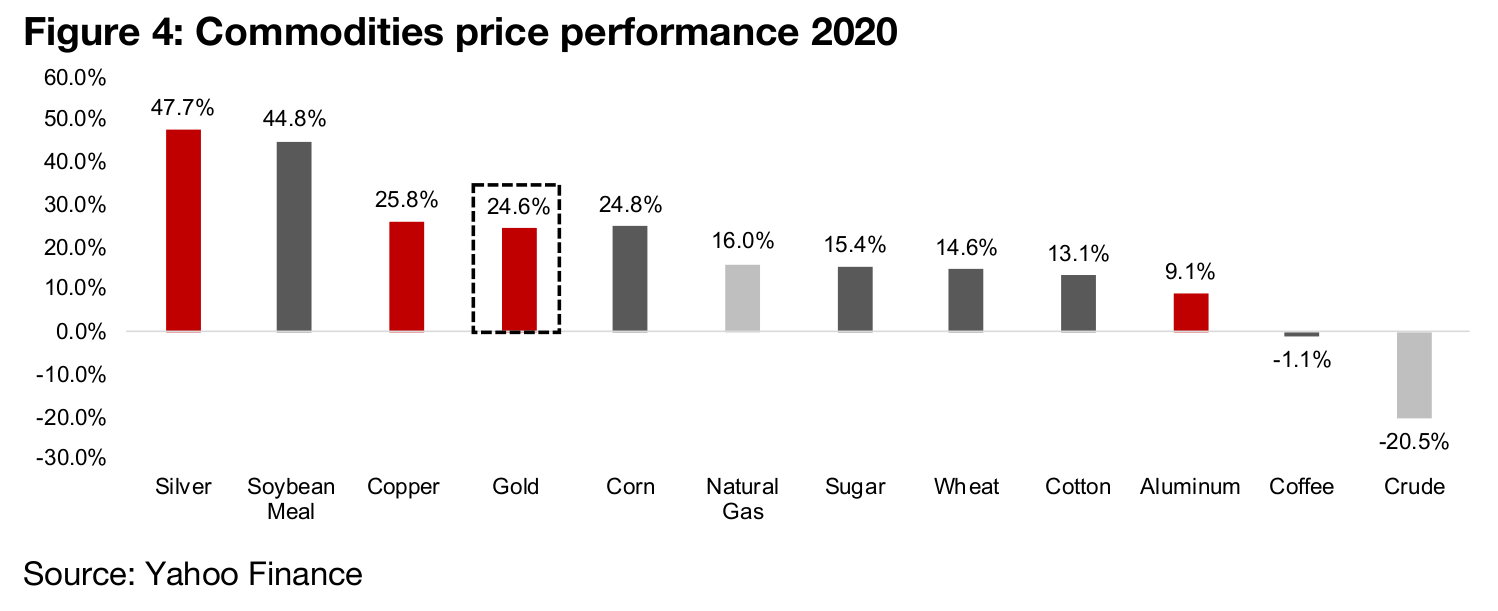
Gold is a unique asset in that it has a dual definition as commodity, because of its industrial uses, and as a monetary metal, as it is considered a currency substitute (on one of the most widely used sources of financial information, a Bloomberg terminal, gold is listed as both a commodity and a currency). In Figure 4, we therefore show gold's performance in the context of some major commodities. While above we showed that the commodities index fell -7.8%, excluding energy, actually many commodities actually had quite a strong year in 2020. Of the major commodities, gold was only the fourth strongest performer, beat by its 'cousins' silver, with a massive year, up 47.7%, and copper, just edging ahead, up 25.8%. The other big commodity winner was soybean meal, up 44.8%. Most other major commodities were up around 10% or more, with only coffee, and crude oil, down, by -1.1%, and -20.5%.
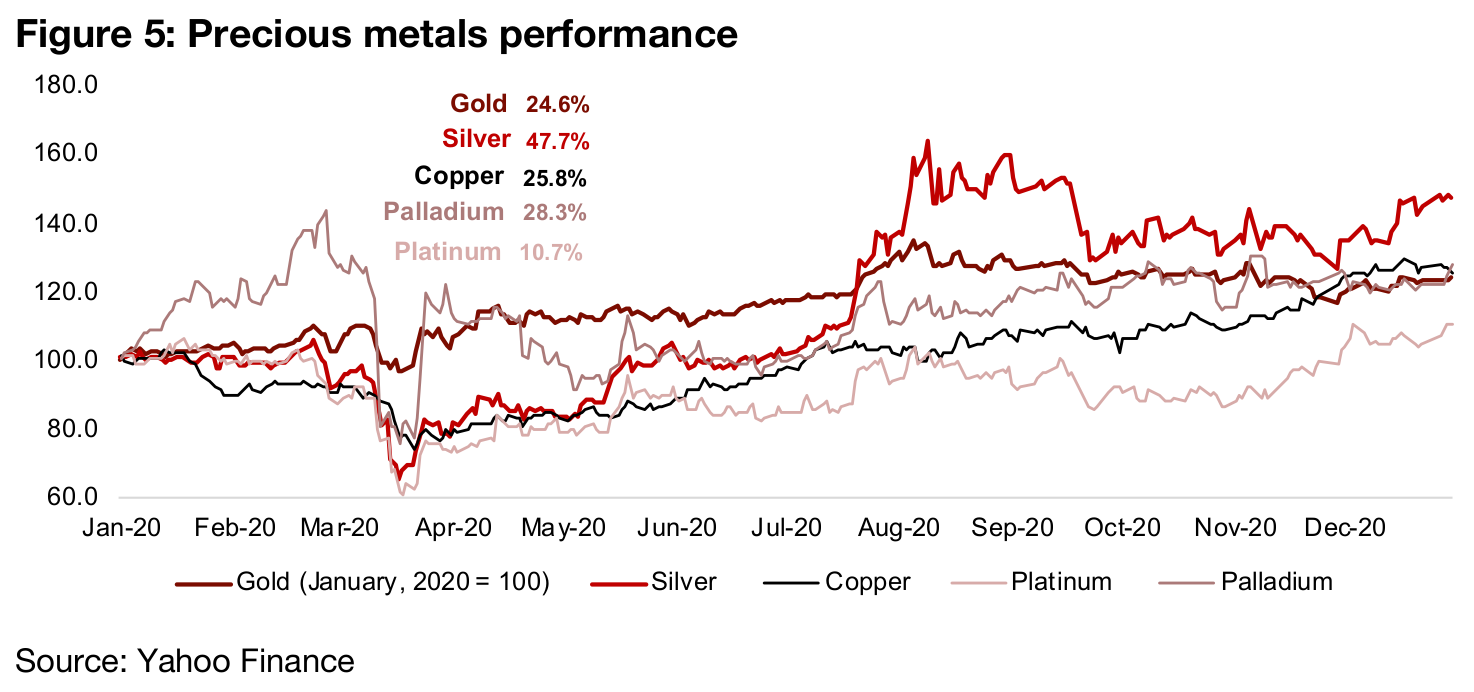
Precious metals had a big year overall, and while gold's performance looks
impressive in the context of other asset classes and commodities, it was average
versus this group (while copper is not officially a ‘precious metal’, it has enough in
common with these other metals that we include it here). As of mid-year, gold was
solidly outperforming this group, but the other metals started to catch-up in the
second half (Figure 5). While gold did great, the year really belonged to silver, which
picked up in July, jumped in August and ended the year up 47.7%. This was driven
by a long period of undervaluation versus gold which we discuss further below.
Copper lagged until the last month of the year, when a stronger than expected
economic rebound drove it to a 25.8% gain by the end of the year.
The story behind the other two metals, Palladium and Platinum is related to their use
in catalytic convertors in the auto industry (although both are monetary substitutes to
some degree); Palladium is being used more and Platinum used less as the
technology changes related to environmental issues. Palladium's performance was
thus just below gold's, up 28.3%, while Platinum was the laggard, up 10.7%.
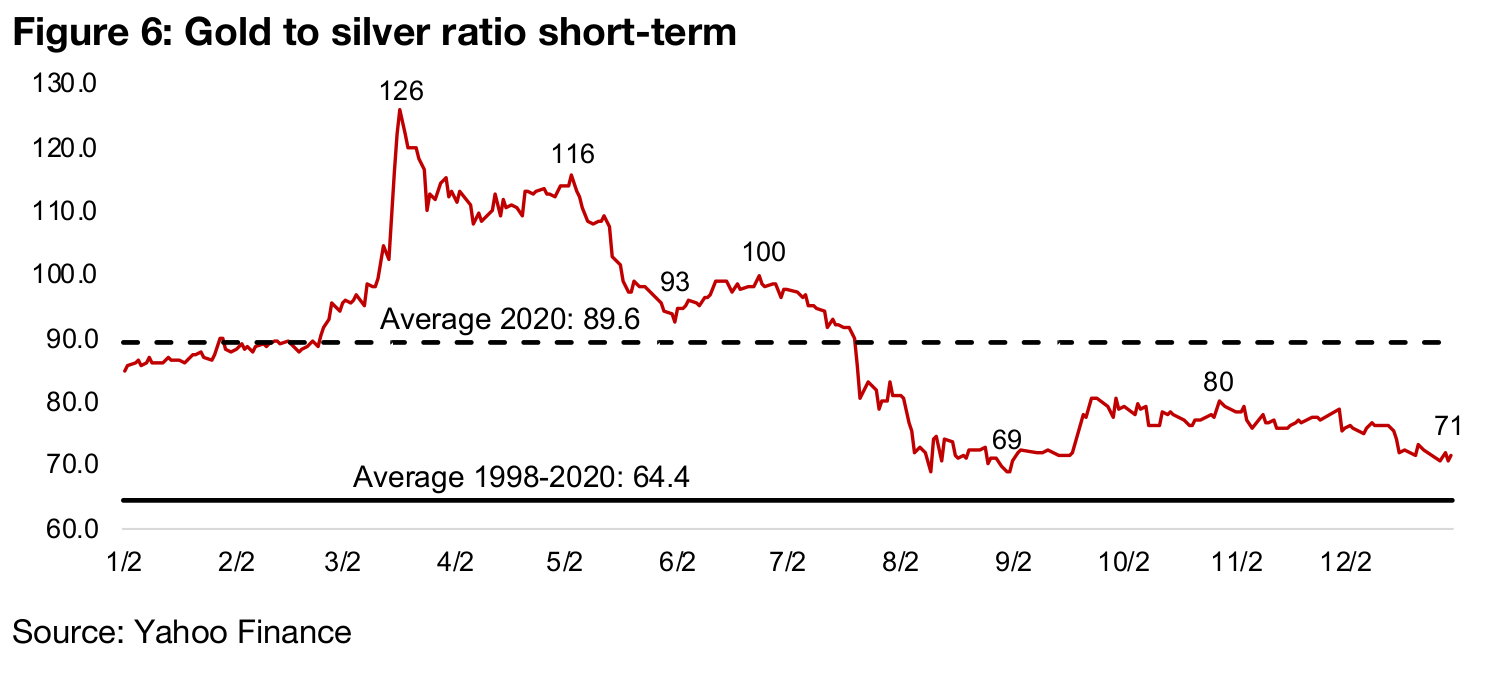
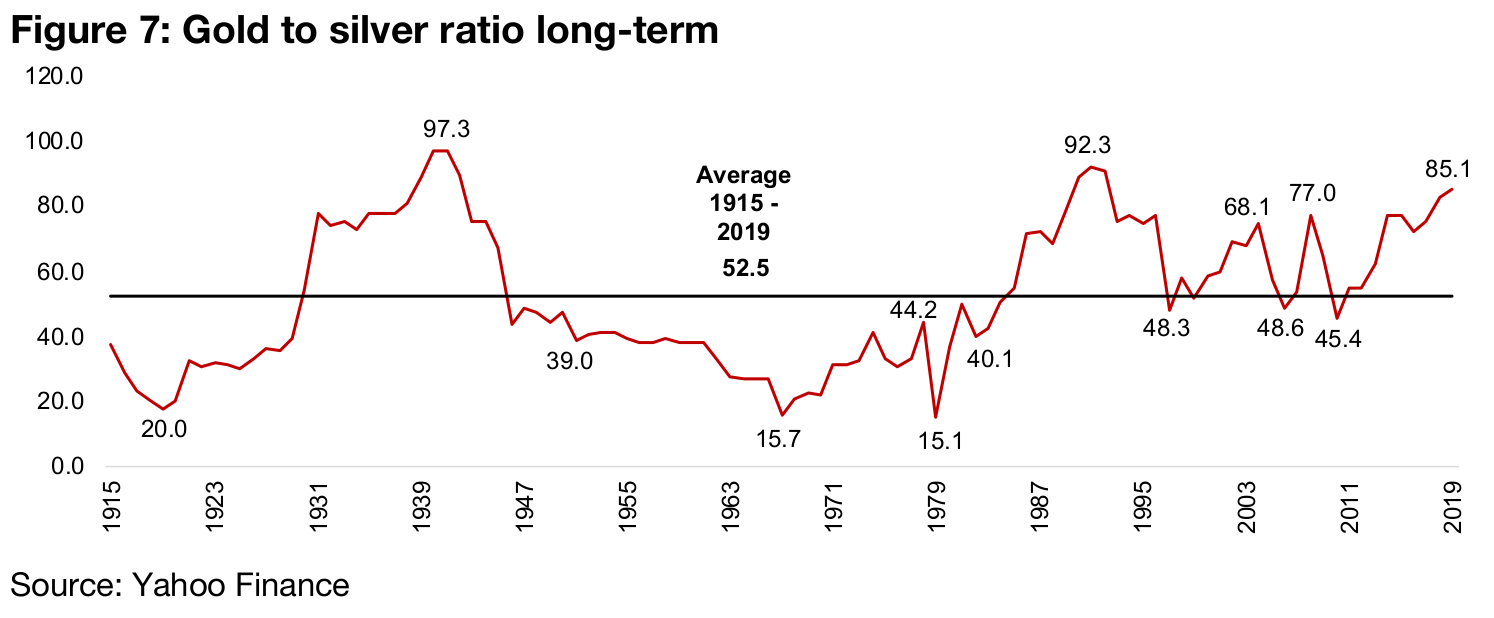
The gold to silver ratio can be used to determine relative over or undervaluation of the two metals; in 2020, the ratio spiked, but then returned towards medium-term averages (Figure 6). Gold's strong performance in 2019 lead to the ratio already being quite high heading into 2020, at over 80.0, versus an average of 64.4 medium-term from 1998-2020 and 52.5 long-term, from 1915-2019 (Figure 7). We would therefore not have expected the ratio to hold at levels above all-time highs of over 100 reached from March to May 2020. Either gold would have to come down, or silver would have to rise. As it turned out, the market moved heavily into silver, even as it continued to support gold, bringing the ratio down to a low of 69 in September, and after a pullback first in silver, and then in gold, it ended the year around 70, a reasonable level just above the mid-term average of 64.4, leaving the ratio reasonably neutral.
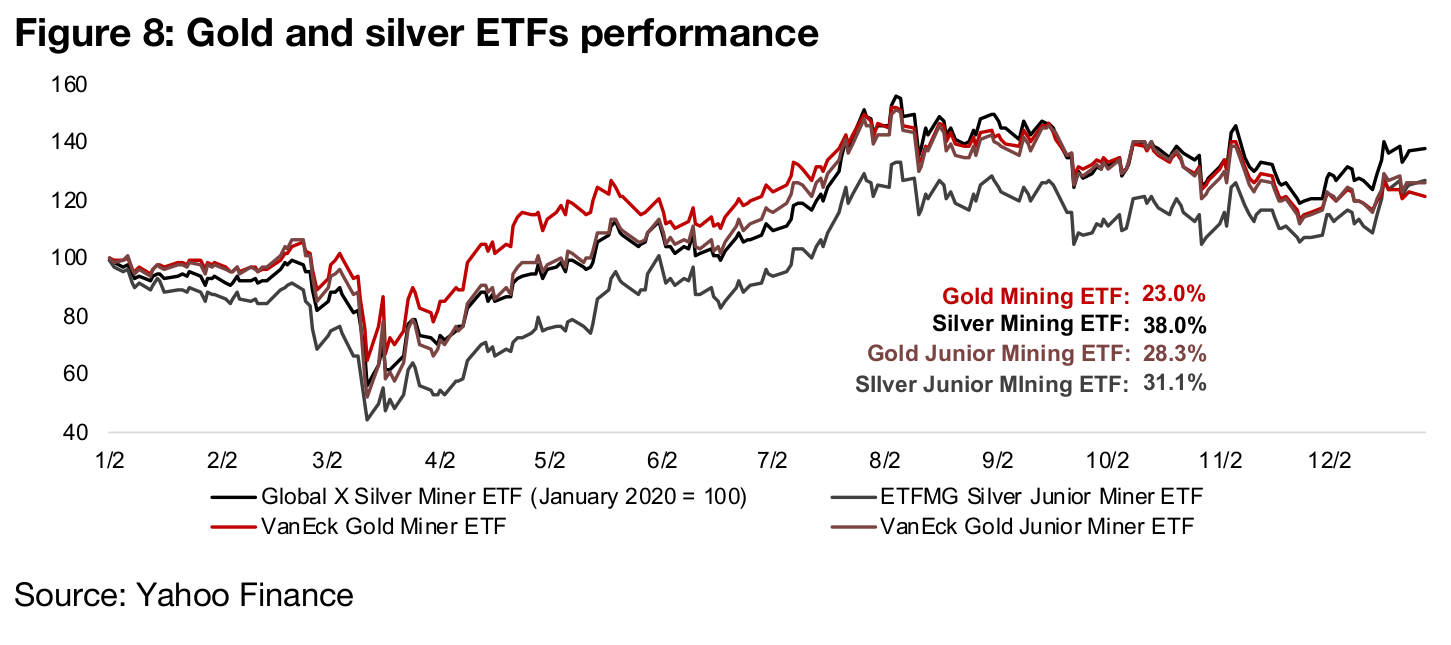
As with the precious metals prices, the picture for the major gold and silver ETFs as
of mid-2020 was quite different than the end of the year. As of June 2020, the VanEck
Gold Miner ETF, including the major gold producers, had seen the highest gains, the
VanEck Junior Gold Miner ETF, including smaller gold explorers, was about even with
the Producing Silver Miner ETF, and the Junior Silver Mining ETF was the clear
laggard (Figure 8). In general, we would expect the less risky producers to lead into
a gold price rise and the riskier juniors to lag. However, as investors' risk appetite
increases, we could see high risk-reward juniors eventually out-perform producers.
By the end of the year the outsized gain in silver had driven the Silver Mining ETF well
ahead of the pack, up 38.0%. There had also been a shift towards risk, with the
second strongest performer, the Junior Silver Miner ETF up 31.1%, edging above the
Junior Gold Mining ETF, up 28.3%. Interestingly the shift to both silver and risk,
actually left the producing Gold Miner ETF, the clear winner in first half of 2020, at the
bottom of the pack, up just 23.0%. Nonetheless, whichever of these four gold and
silver ETFs an investor picked, they had a very good year of returns.
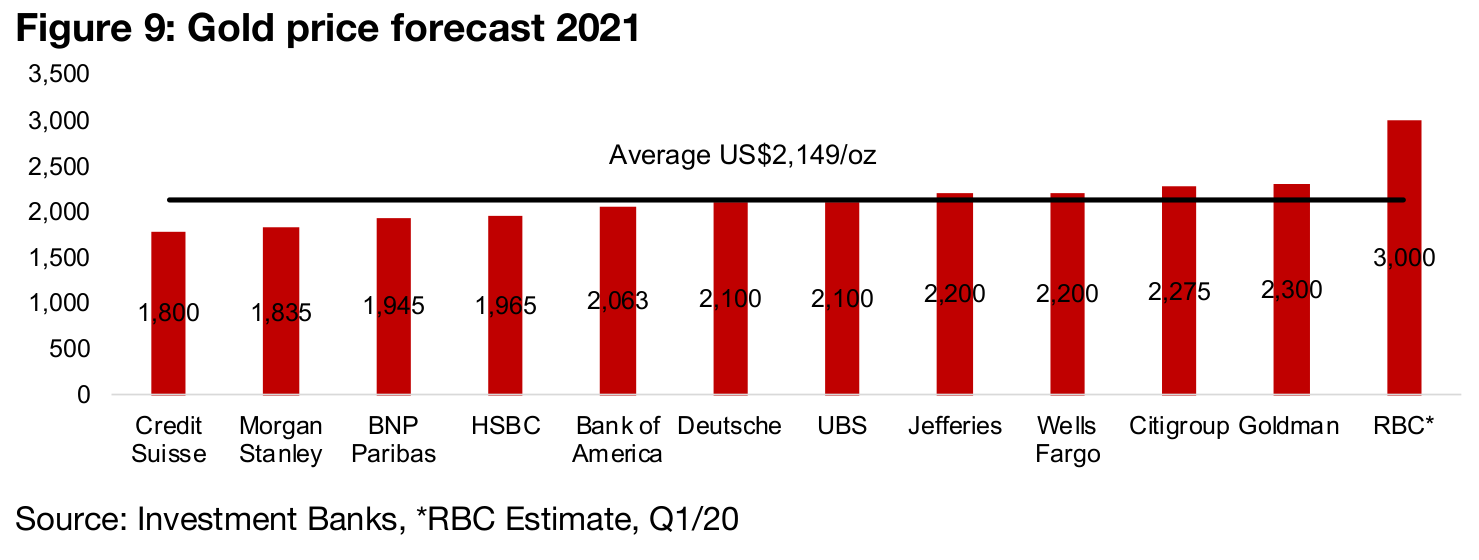
Consensus estimates from the major investment banks remain bullish for gold, with
an average US$2,149/oz for 2020, ranging from the US$1,800/oz of Credit Suisse to
US$3,000/oz from RBC (expected for Q1/21). The median forecast of US$2,100/oz
implies an 18.7% gain on the US$1,769/oz average of 2020 (Figure 9). Importantly,
no major investment banks are expecting that gold will face a significant decline next
year. Even at the low estimate of US$1,800/oz, most global producing gold mines
would make strong margins, as we show below, and marks a significant improvement
on the average of just US$1,268/oz in 2018, where many producing miners were
struggling. Even if these forecasts prove bullish, a 4.0% decline to US$1,700/oz gold
in 2021 would still leave the industry in great shape from a profitability perspective.
For the junior gold miners, even prices at US$1,800/oz will mean producers are
cashed up and looking to acquire companies completely or take major stakes in
potential new deposits. They will also be more likely to take bets on higher risk
projects that they certainly would have not considered two or three years ago. And if
the gold price picks up towards an average of US$2,000/oz or above, or even spikes
towards RBC's estimates, next year could be a very major one for activity in the sector,
and the junior gold miners could see a great deal of interest, and a major opportunity
to expand their activities.
In this section we look at what we view as the seven core drivers for the gold price, summarized in Figure 10. We see three of these as being clearly Bullish for the gold price, including the relatively low expected Yield on Alternative Assets, a major ongoing Global Monetary Expansion, and high Global Economic Risks. We believe that these three will continue to be the major drivers of the gold price heading into 2021, and in the discussion below we focus on these factors.
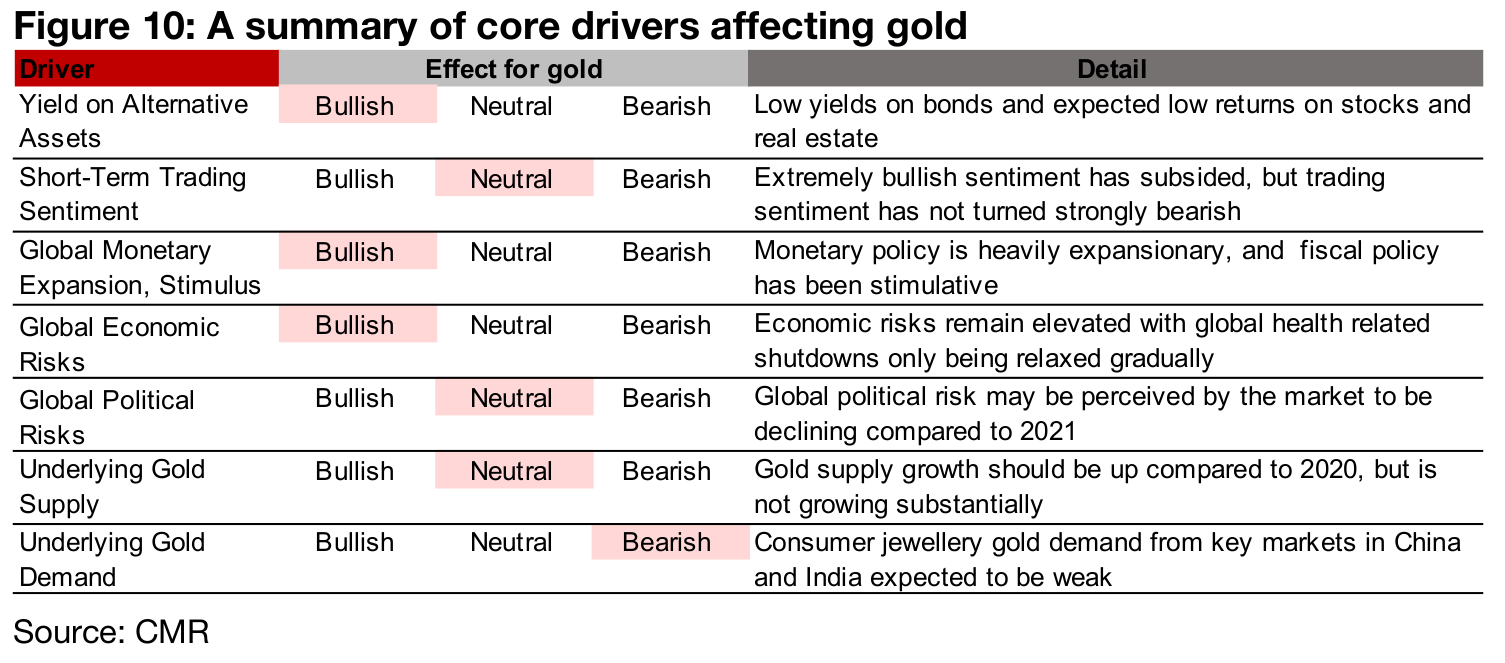
We see three factors as being relatively neutral, including Short-Term Trading
Sentiment, Global Political Risks and the Underlying Supply of Gold, and one as
Bearish, that being the underlying Physical Demand for Gold. For short-term trading
sentiment, we saw this spike early in the year on the global health crisis, peak in the
middle of the year, and then subside near the end of the year as progress on vaccines
started to be reported. We believe that this factor is now relatively balanced, and
neither particularly bullish nor bearish. We view global political risks as having moved
to neutral currently, as there will be a wait and see approach, especially with the
expected new incoming administration in the US.
The underlying gold supply looks neutral for 2021, and while previous estimates were
for a slight decline in mine supply this year, given the production shutdowns in 2020,
mining supply could be flat year on year. The only truly bearish factor is likely to be
underlying gold demand in terms of direct consumption, with China and India the two
main markets for gold jewelry, and a generally weak global economy could hit
demand there. Nonetheless, we do not believe that consumption or industrial
demand are likely to be the key drivers of the gold price, and probably they have not
been for the past decade or longer. The main driver for gold is in its role a substitute
currency, in our view, which we go into in detail in this section.
In our view, it has been a major ongoing monetary expansion that has been driving
gold, that could be traced back to as early as the mid-1980s, was certainly prominent
in the early 2000s, and has really became the standard, and expanded globally, since
the 2008-2009 financial crisis. If we consider gold as a substitute currency, and given
its inclusion in the reserves of every global central bank, it certainly seems to be, we
would expect to see, that other things equal, as we expand the supply of other
currencies more rapidly than gold, that gold's price in terms of those currencies would
rise. While this relationship has not held perfectly by any means over shorter periods,
over longer periods of time, this does appear to be the case for gold.
One proxy for changes in the money supply is the US Fed Funds Rate, the core
underlying rate used to price other assets in the economy. As it is falling, or remains
low, the money supply in the economy will tend to be expanding, and as it is rising,
money will tend to be contracting. Figure 11 shows the last decade of the Fed Funds
Rate compared to gold. This chart is interesting because it demonstrates the
interrelationship between all three of the topics we cover in this section; 1) money
supply growth, 2) alternative asset yields, and 3) economic risks.
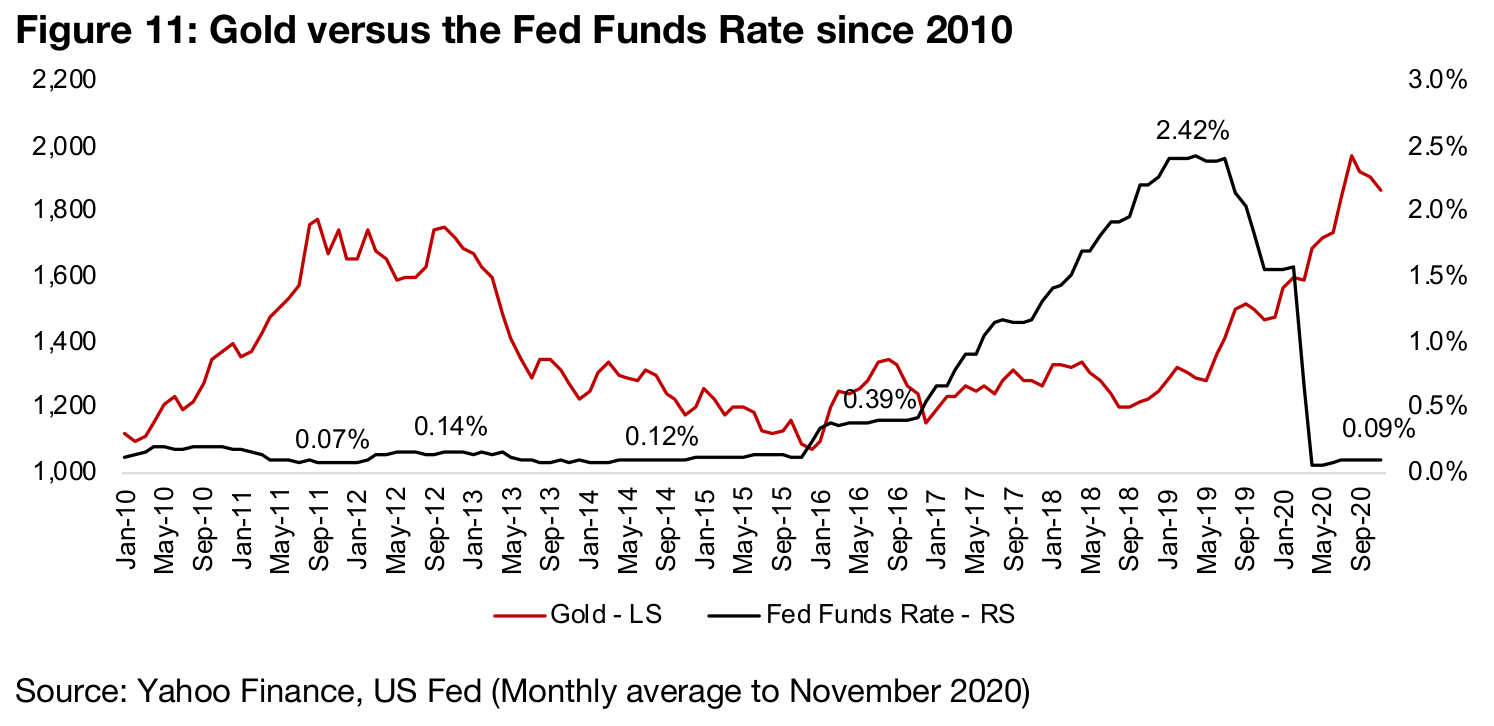
The Fed dramatically cut rates and expanded the money supply after the 2008-2009
financial crisis, before this chart began, and with rates very low and declining, the
gold price surged from 2010 to 2013, a direct function of monetary expansion.
However, as rates settled at low levels, and the economy began to recover, equity
markets took off because of the lower rates, pushing investors away from safer assets
like gold and into risker assets. This shows the pull of the second factor, attractive
yields on alternative assets to gold, which could drive investors to sell gold.
Finally, the Fed, by 2018, considered the economic expansion strong enough to start
raising rates and contracting the money supply. However, this started to increase
perceived risks in the economy, given that as interest rates rise, many projects in the
economy that look viable at very low rates start to look increasingly risky at higher
rates, as does the entire section of the housing market on floating rate mortgages.
This shows the effect of the third factor, rising perceived economic risks, which drove
a spike in gold heading into the second half of 2019.
The market was also concerned that the rapid reversal of the Fed Funds Rate which
suggested that maybe the Fed would not ever be able to exit low rates convincingly
without leading to major short to medium-term economic downside. So, heading into
2020, there was an ongoing monetary expansion as rates were lowered, there were
weakening expectations for alternative assets like the equity markets, as gains had
slowed, and perceived rising economic risks. The global health crisis took all of these
drivers and ratcheted them up considerably, which lead to the major surge in gold.
As the narrative above outlines, to some degree or another, a lot of these moves in gold seem to all come back to changes in interest rates, or changes in the money supply, which tends to feed into the other two key drivers. While the effects are admittedly circular, we like to bring it back to the money supply as the main driver. And if this is the case, there will certainly be some substantial effects to come from what we are seeing now. The chart above of the US Fed Funds Rate, while a good general proxy for global money supply growth, leaves out an important issue. This is that gold is not only affected by increases in the US money supply, but also the global money supply, of which the big players are the US, Europe, China, Japan and India.
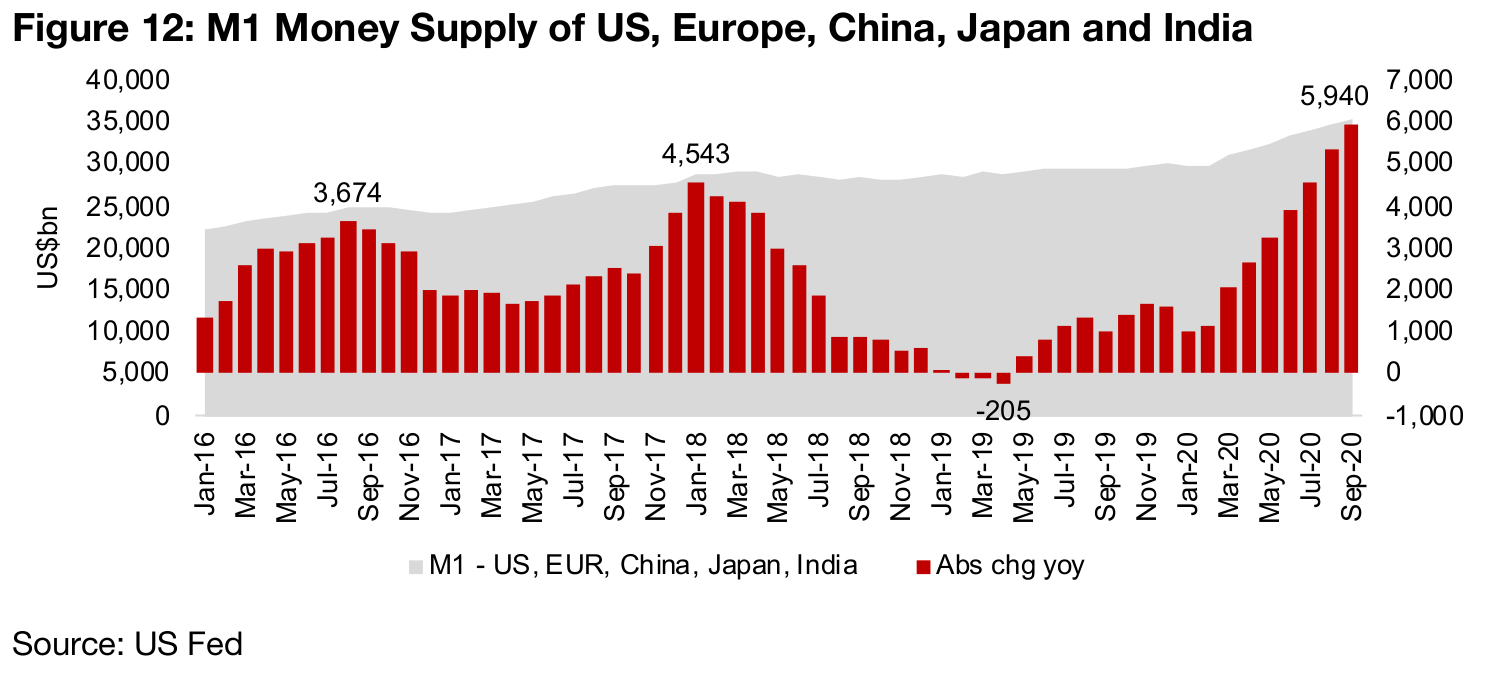
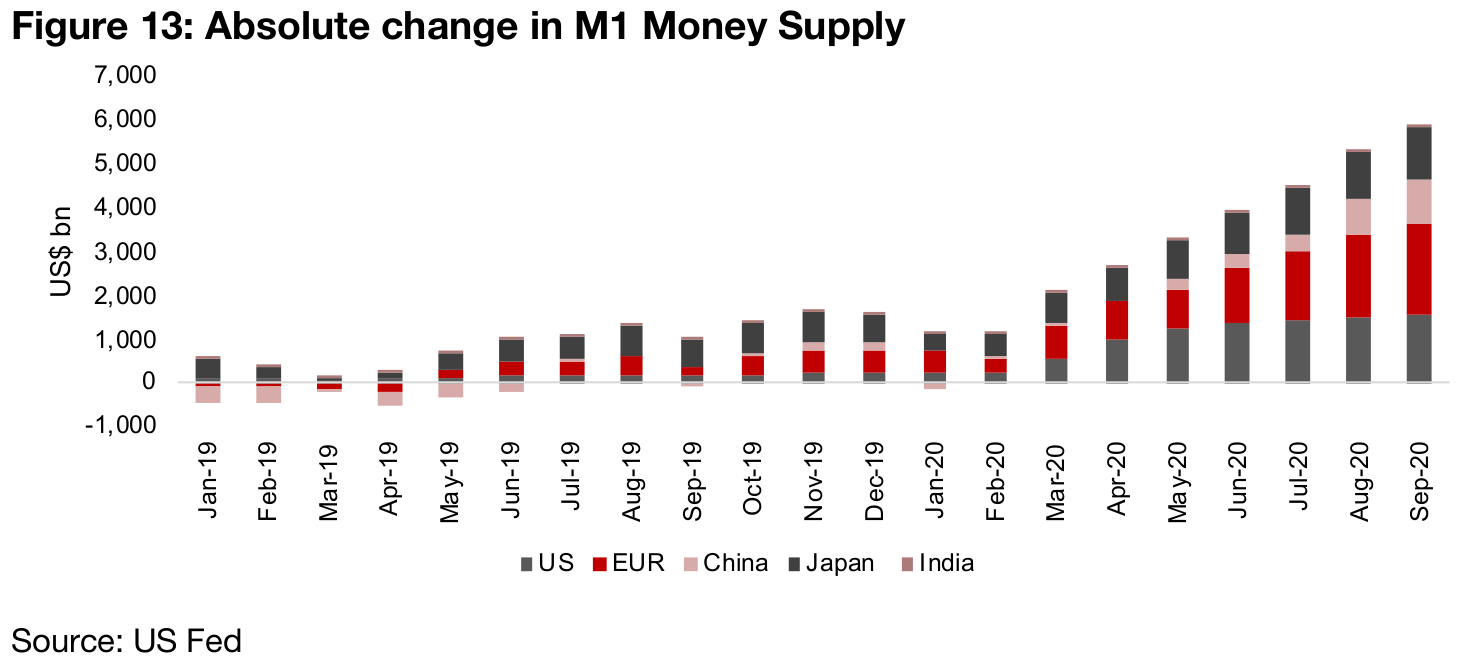
Figure 12 shows the massive expansion of the aggregate M1 money supply (the most basic definition, including physical currency, coins, and demand and checkable deposits) of these countries in recent months, which is dramatic even in the context of the 2008-2009 financial crisis. It has also been widespread globally, as shown in Figure 13, with all of the big five seeing big expansion in money supply relative to the absolute size of their respective monetary bases.
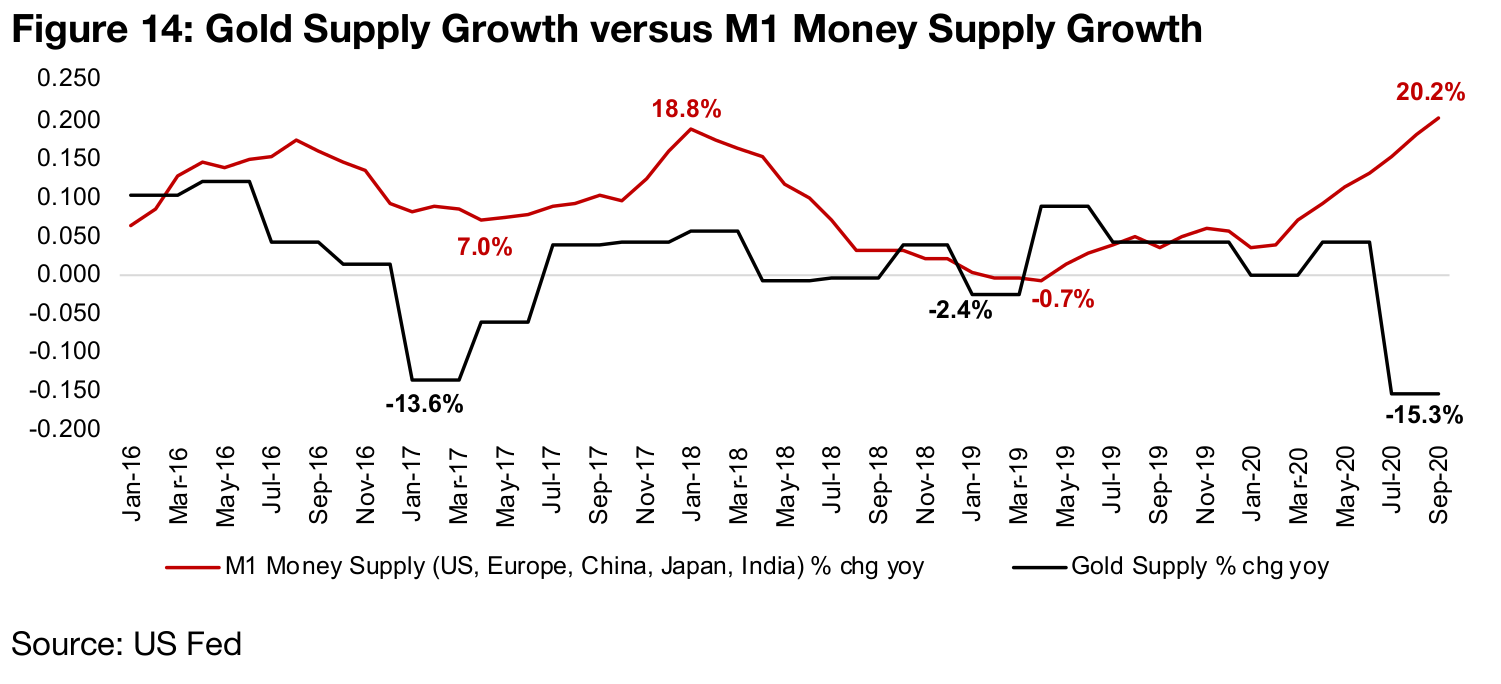
Conceptually, the currency that is expanding rapidly will be depreciating versus the currency that is either fixed or contracting. In gold's case, Figure 14 shows that while the money supply of these five countries has seen a strong ongoing expansion, which has spiked in recent months, the gold supply has been around flat to down, and dropped especially over the last year on mine shutdowns driven by the global health crisis. We would certainly expect in this situation, on a fundamental basis, to see gold gaining value versus the currencies of these countries.
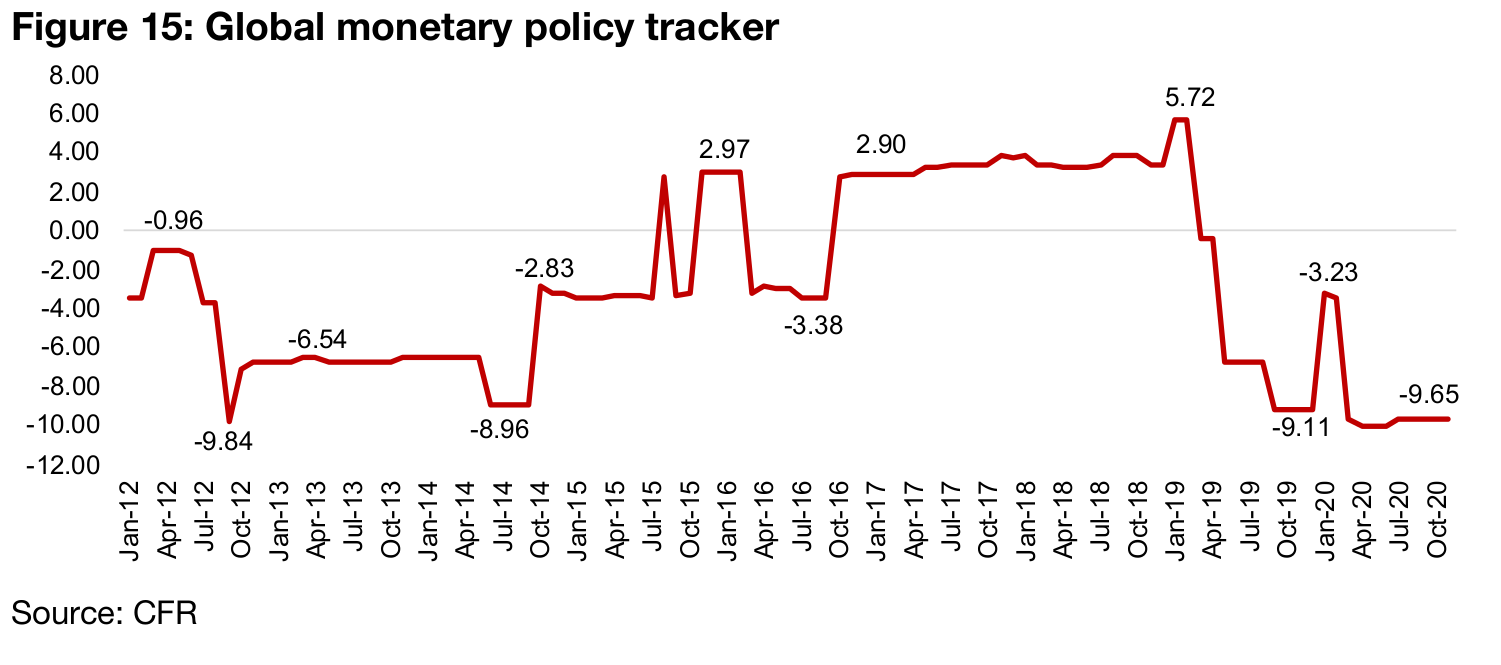
Another indicator of the intentions of global central banks in terms of money supply
changes, is changes in global policy rates, an example of which is the US Fed Fund
Rates, shown above. The CFR's Global Monetary Policy Tracker shows the overall
direction of the monetary policy of the world's major central banks, with a reading
above zero suggesting monetary tightening, or money supply reduction, and readings
below zero indicating monetary loosening, or an increased money supply (Figure 15).
This measure has shifted to its lowest point since the aftermath of the financial crisis
in 2012. Given the ongoing global economic crisis, in our view it seems very unlikely
that global monetary authorities will be pulling back on the money supply in 2021,
and instead will likely be doing everything they can to make sure liquidity is supplied
to the market, to not make an already difficult situation worse. This should be
fundamentally very good for gold this year.
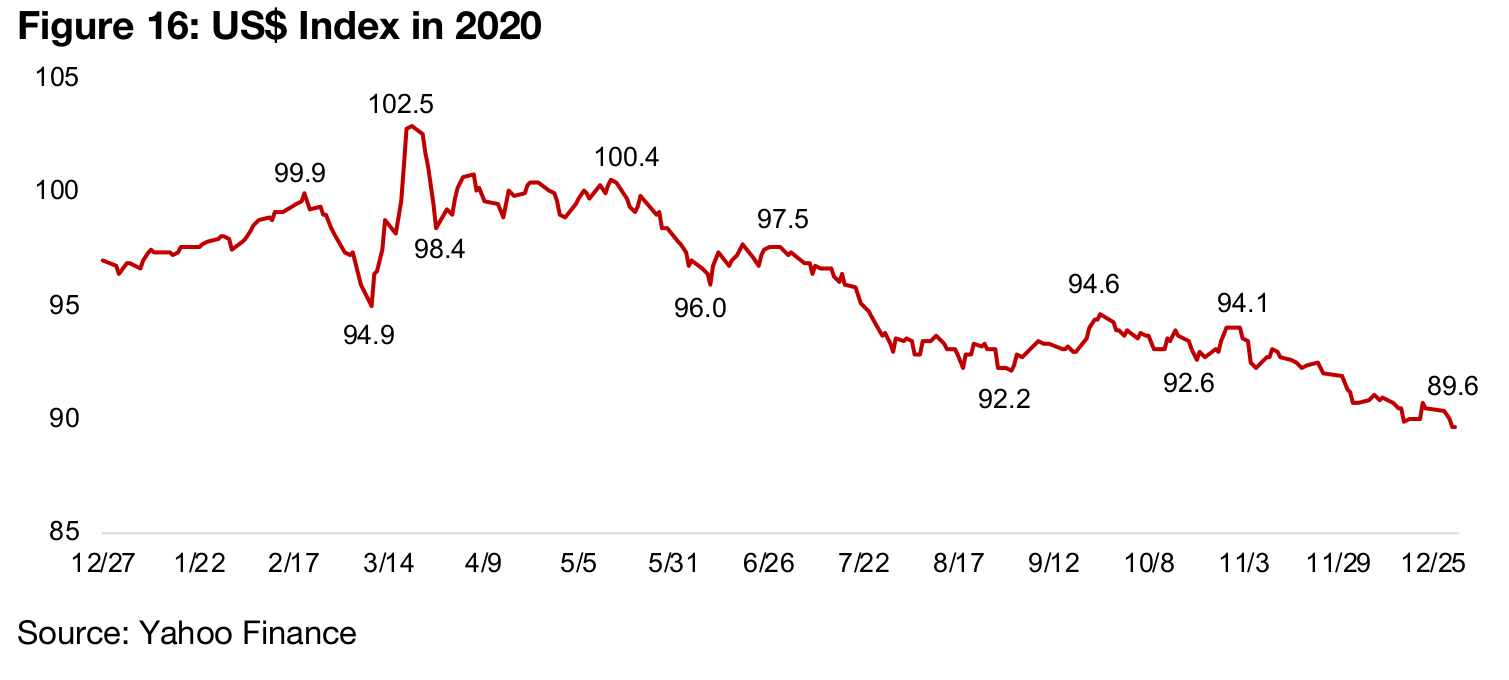
As we saw in the mid-2010s, yields on alternative assets can have a major effect on the gold price. In this section we consider the US$, global equity and bonds as alternatives, and show how they performed over the past year. We start with the US$, which is not so much an alternative asset to gold as it is the 'inverse' of the gold price, because gold is priced in US$. Therefore, as the US$ declines, the relative value of gold necessarily goes up, and as the US$ rises, the value of gold declines. Figure 16 shows that the value of the US$ has been decreasing almost continuously versus gold through 2020, as would be expected, given the monetary expansion that we have outlined above. Market consensus estimates are also expecting the US$ decline to continue into 2020, which will be a driver for gold.
Equity is a major alternative asset to gold. Gold has no cash flows or yield, so its gains are entirely based on its price rising. In purchasing equity, investors gain income through dividends, and can also make capital gains as prices rise, so when the economy is strong and equity markets are rising, the potential returns in equity markets can outpace gold considerably. Therefore, investors may move out of gold for the superior returns in equity in periods where investors are less risk averse. Heading into 2020, we saw a market already growing more cautious on global equity, using the proxy of the MSCI World Equity Index ETF in Figure 17, with perceived risks rising since the second half of 2019. With the global health crisis, this turned to outright fear, as investors dumped equity and moved into safer assets, including gold.
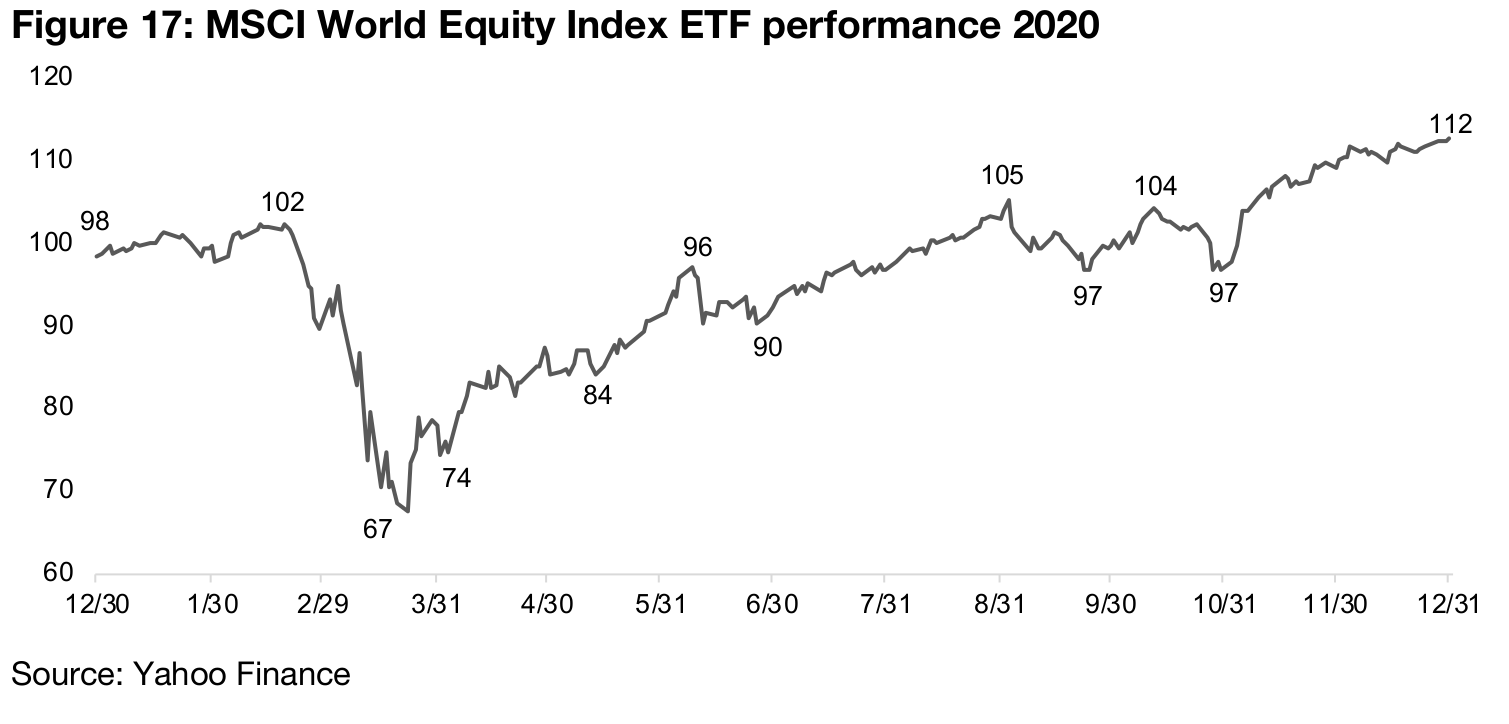
The global equity markets took another six months to get near even for the year, and only with the monetary authorities massively expanding liquidity did we see convincing gains for global equity by the end of the year. Heading into 2021, there is a question of whether the massive liquidity will continue to drive equity strongly, or whether investors will remain much more risk averse than they did in the mid-2010s. In any case, we believe that they will be much more likely to want to hold onto some gold for downside protection than they did from 2013-2018, given that risk is very fresh in their minds, and gold clearly proved itself as a wealth preserver in 2020.
Bonds also are a major alternative asset to gold, as they also offer cash flows in the
form of coupon payments, and while there is the opportunity for capital gains, these
tend to be much lower than for equity, and bonds are more often purchased with the
intention of preserving the underlying the capital than greatly expanding it. However,
with interest rates near zero, bonds are less attractive versus gold than they would
be at higher interest rates, and the cash flows paid on the safest bonds are near zero.
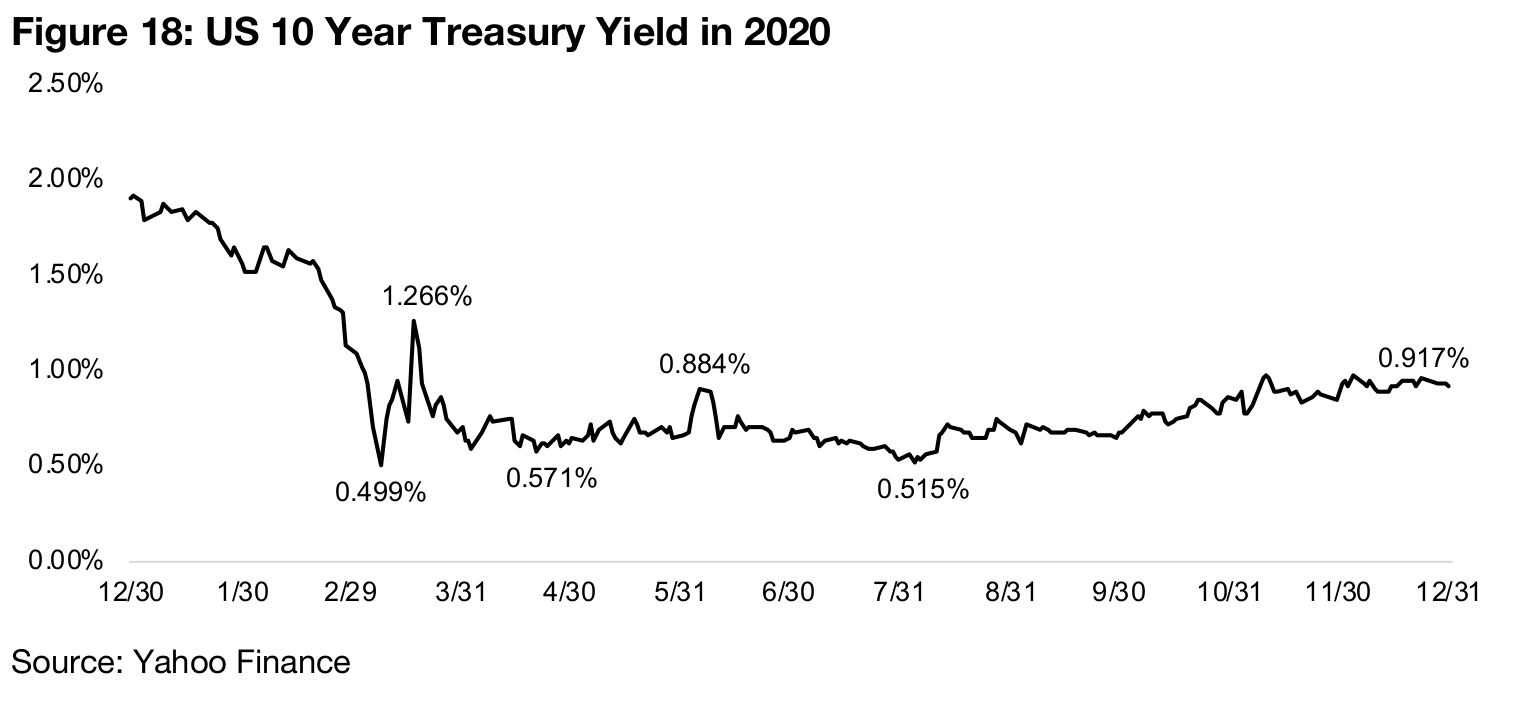
In 2020, we also saw bond yields (what would be earned if the bond was held to its
maturity) fall dramatically (Figure 18), as investors fled to the safety of bonds early in
the year as the health crisis hit (as bond prices go up, their yields fall, and vice versa).
Compared to the start of 2020, when US 10-year yields were near 2.0%, yields
remained relatively low for the rest of the year, but did pick up from lows of 0.515%
in July 2002 to 0.935% by year-end, as investors moved back into risk assets, but
not aggressively, and remained quite risk averse. We expect that demand for safer
assets like bonds will remain high throughout 2021, but that with interest rates
remaining very low, they will not become so attractive as to be able to draw too much
of the action away from gold.
The third major factor that will drive gold this year, in our view, is overall global economic risks. When perceived risks are high, investors will move into safer assets like bonds and gold, and when they are lower, investors will move into more risky assets like equity and high-yield bonds. There has been an undeniable shift towards a higher perceived risk environment in 2020 driven by the severe non-market shock of the global health crisis, especially after the 2013-2018 period, where investors seemed to be pricing in very little risk into markets. Below we outline two indicators that show this change in risk.
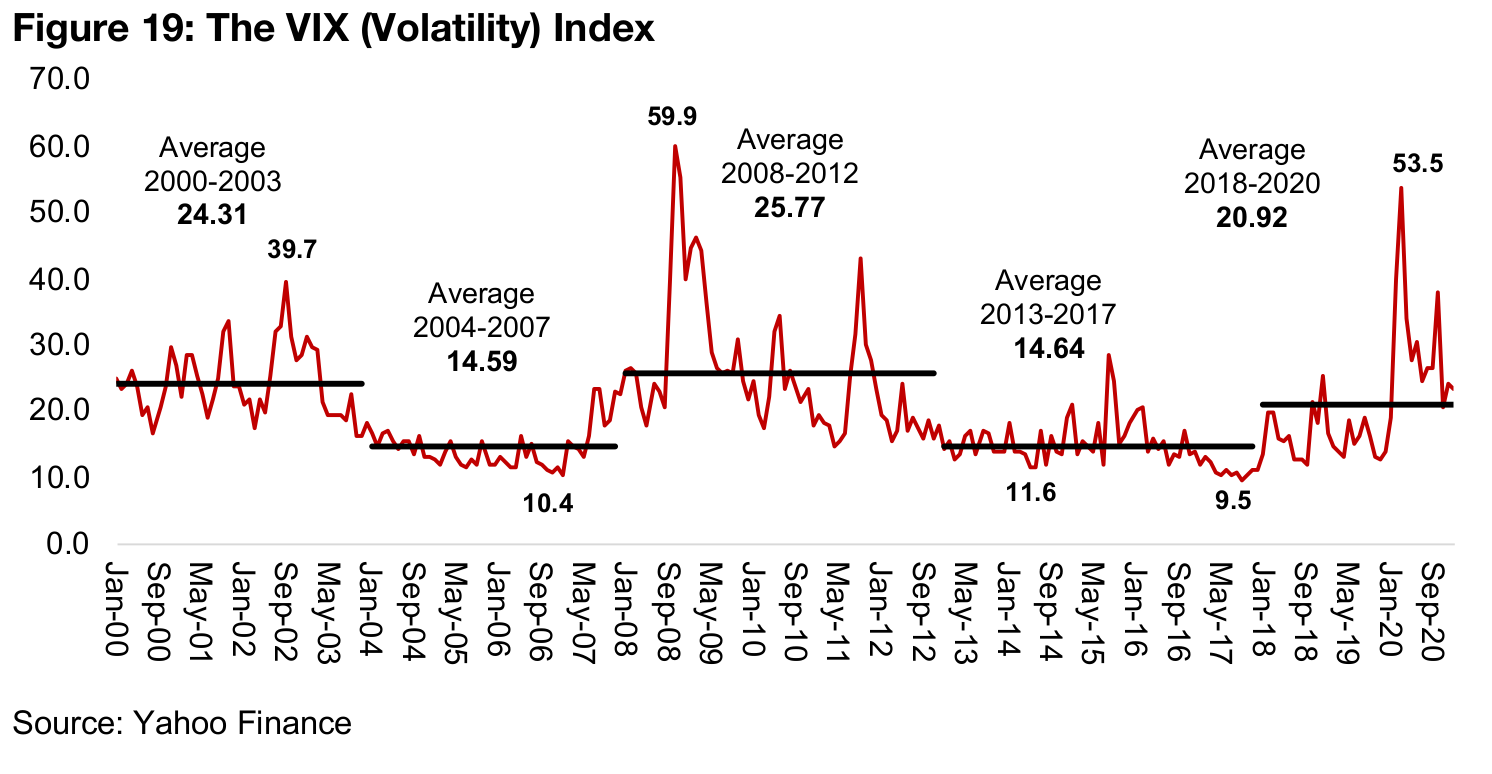
The first is the Volatility Index, or the VIX, which measures volatility, or the degree of changes up and down in the US equity markets. It is not so much the upward movements as the downwards ones that are a concern in this measure, which means the chance for large losses are increasing. Figure 19 shows that after an extended period of a very low VIX from 2013-2017 averaging 14.64, and hitting twenty years lows of 9.5 in this period, the VIX has jumped to an average 20.92 from 2018-2020, and hit a peak of 53.5 in March 2020. Given that historical periods of a high VIX tend to last four to five years and have two to three major peaks, and we have seen only one peak so far, we expect that the chance for volatility shocks this year remains relatively high. This could lead investors to consider holding gold as protection.
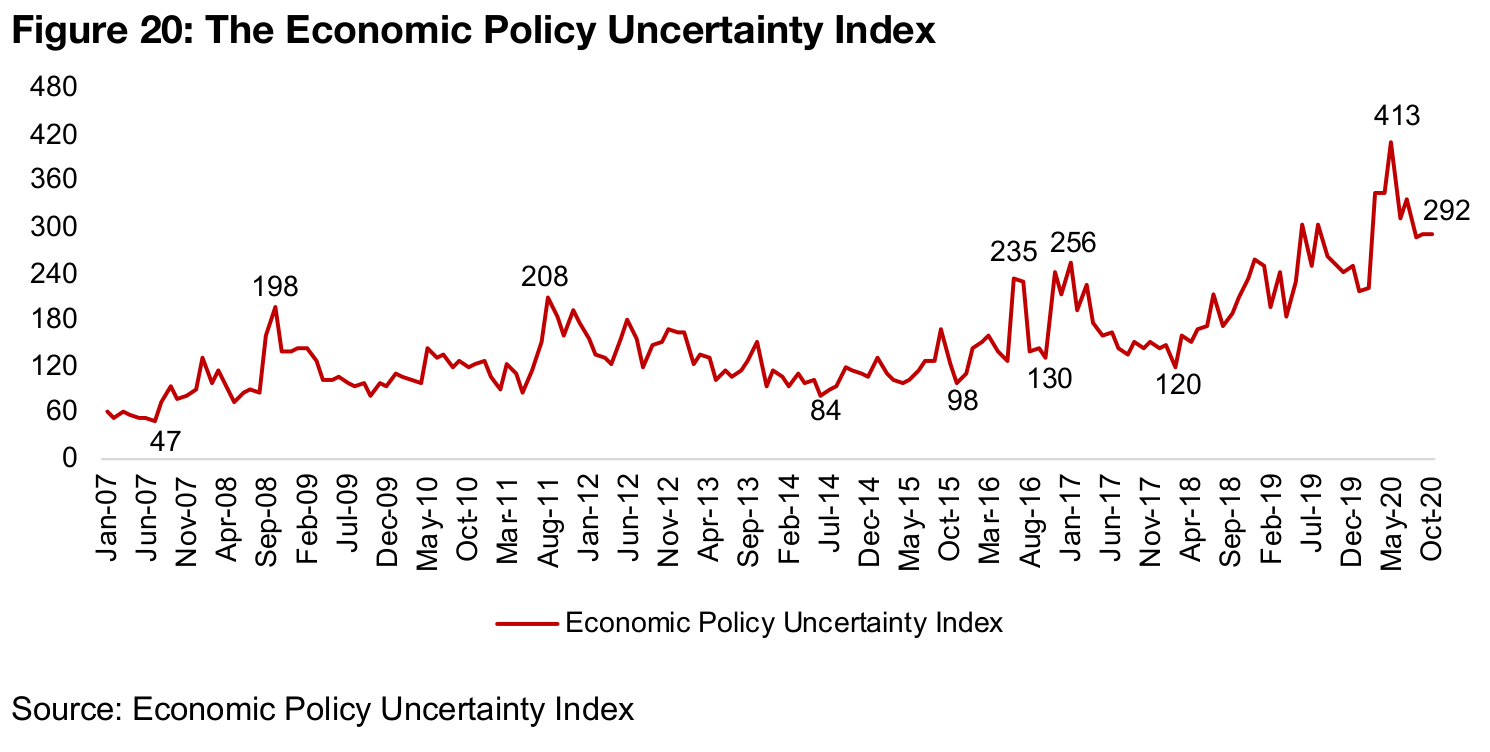
Another data series that is showing elevated perceived economic risks currently is the Global Policy Uncertainty Index, which measures the level of clarity on global economic policy changes (Figure 20). In general, this index has been rising since 2018, after a relatively flat period from 2013-2017 (apart from short term jumps in 2016 and 2017), which is interestingly similar to the pattern we saw for the VIX. The index spiked to its highest level ever in May 2020 at 413, as a lack of clarity, driven by the severity of the global health crisis, reached a peak, and how policy makers would (or could) respond was highly uncertain. Even though the index has declined since the middle of the year, at 292 it is at very elevated levels compared to its recent history.
Overall, we believe that the core drivers will be strongly supportive of gold into 2021, and likely beyond. We believe that it is almost impossible at this point for the global monetary authorities to consider anything but supplying the market with massive liquidity to ensure that the ongoing economic crisis does not slide into a severe depression. While low rates and the liquidity boost may make alternative assets like equity potentially attractive, we believe that investors will be much more wary of risk than they were during the 2013-2018 bull market, and remain very interested in gold for safety in general. Finally, even with vaccines starting to come through, we expect that perceived economic risk will remain very elevated through 2021, and likely beyond. This backdrop should be very supportive of gold, in our view.
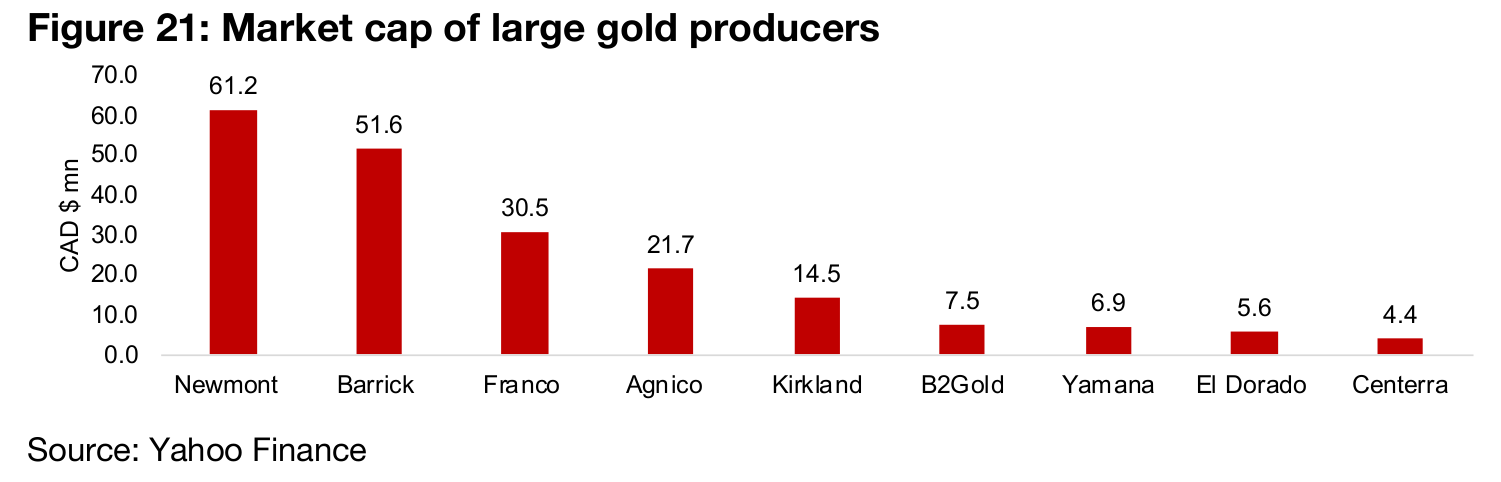
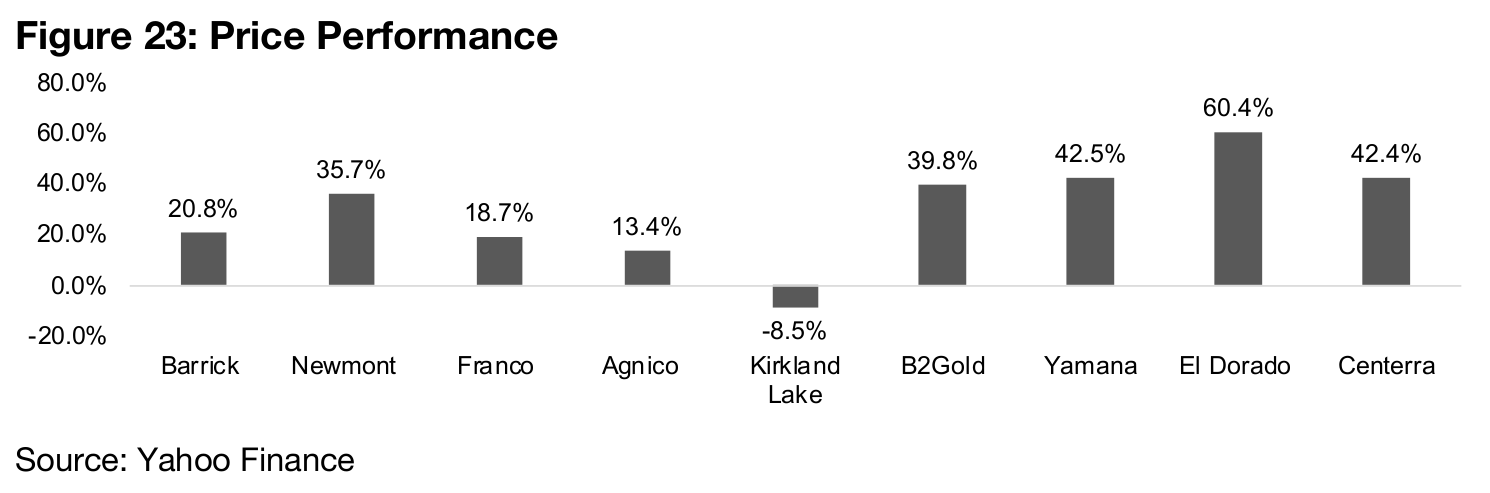
The gold producers had a very good year in 2020, as would be expected, given the high and rising gold price. The major producers are shown in Figures 21 and 22 with Newmont and Barrick the industry giants, with by far the highest market caps and production. In terms of price performance, this year, however, the relatively smaller producers were the stand outs, as they are operating off much lower production bases, and thus have room to grow in high percentages (Figure 23). It would be difficult for Newmont and Barrick, in contrast, to find enough acquisitions to generate such high percentage gains in production and therefore in their share prices.
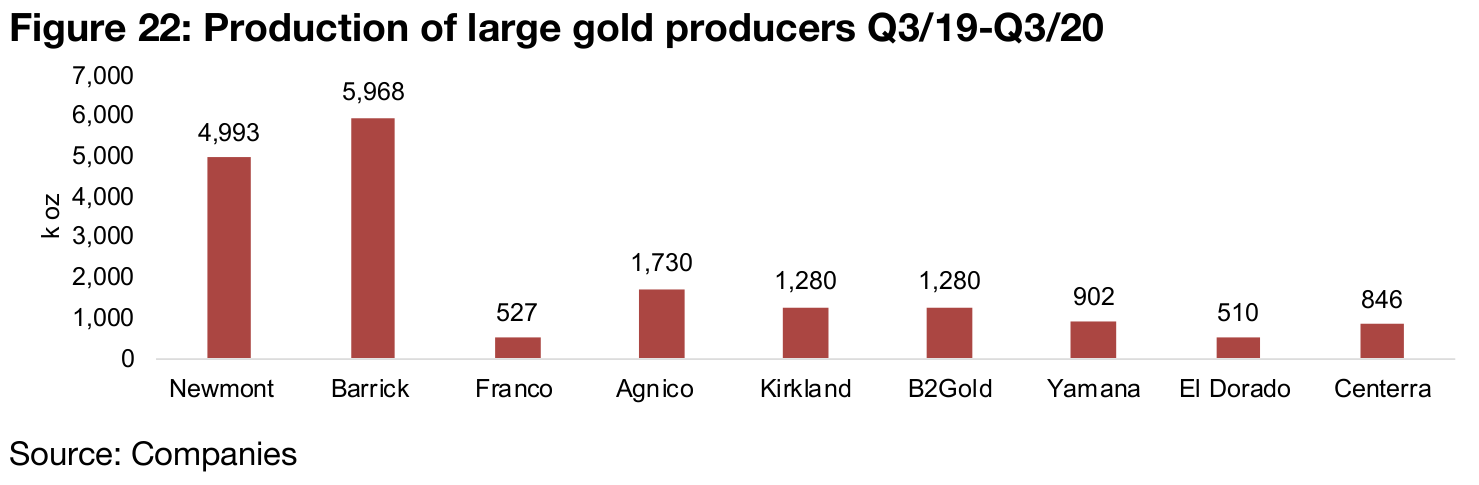
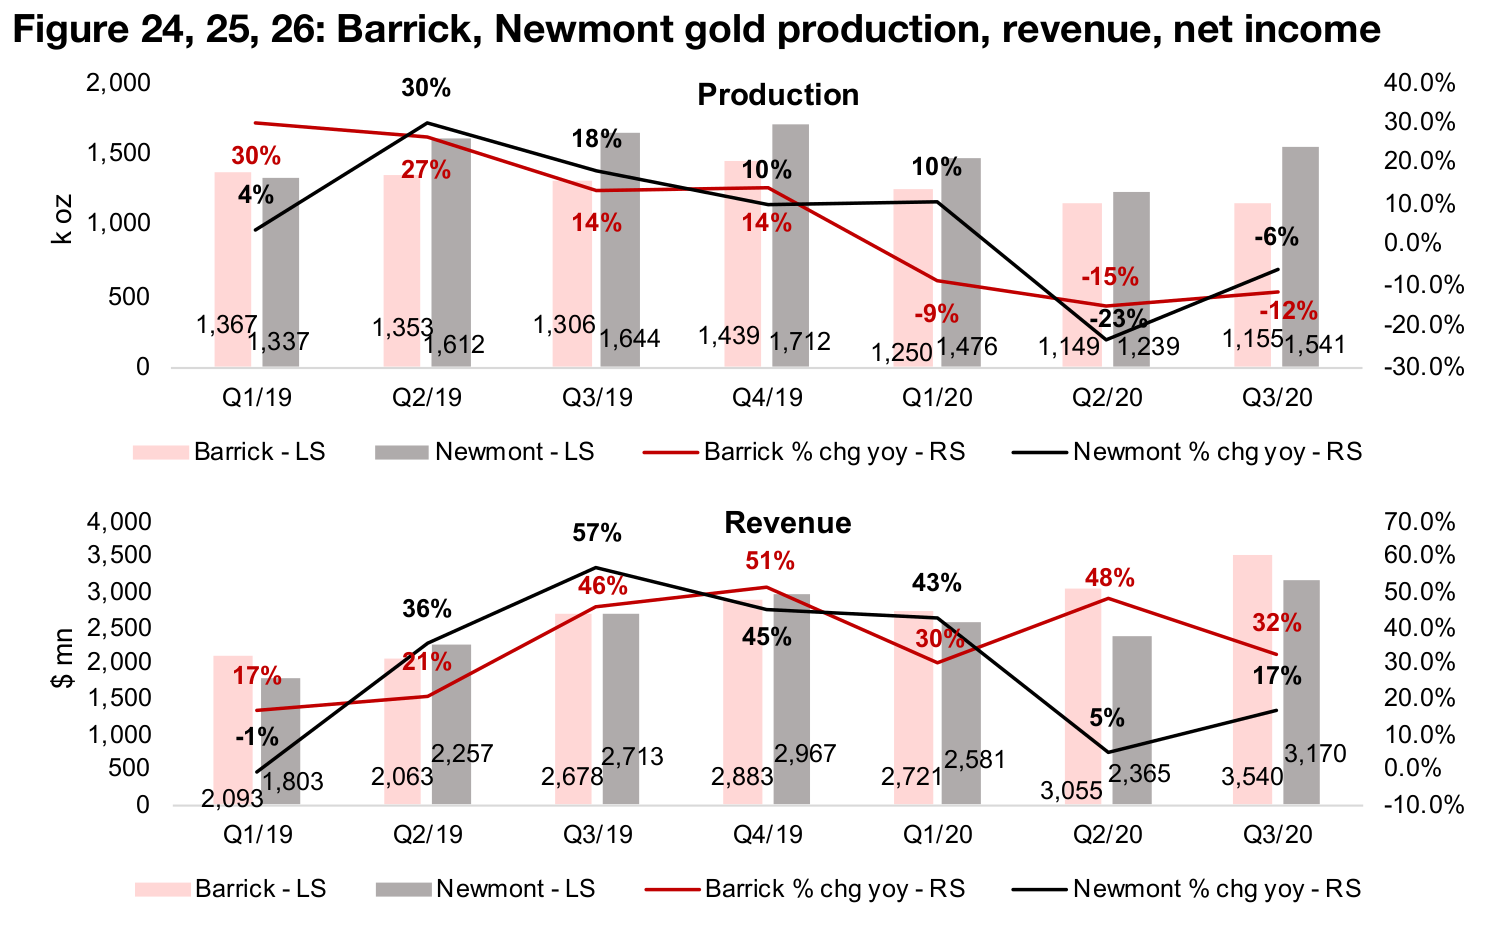
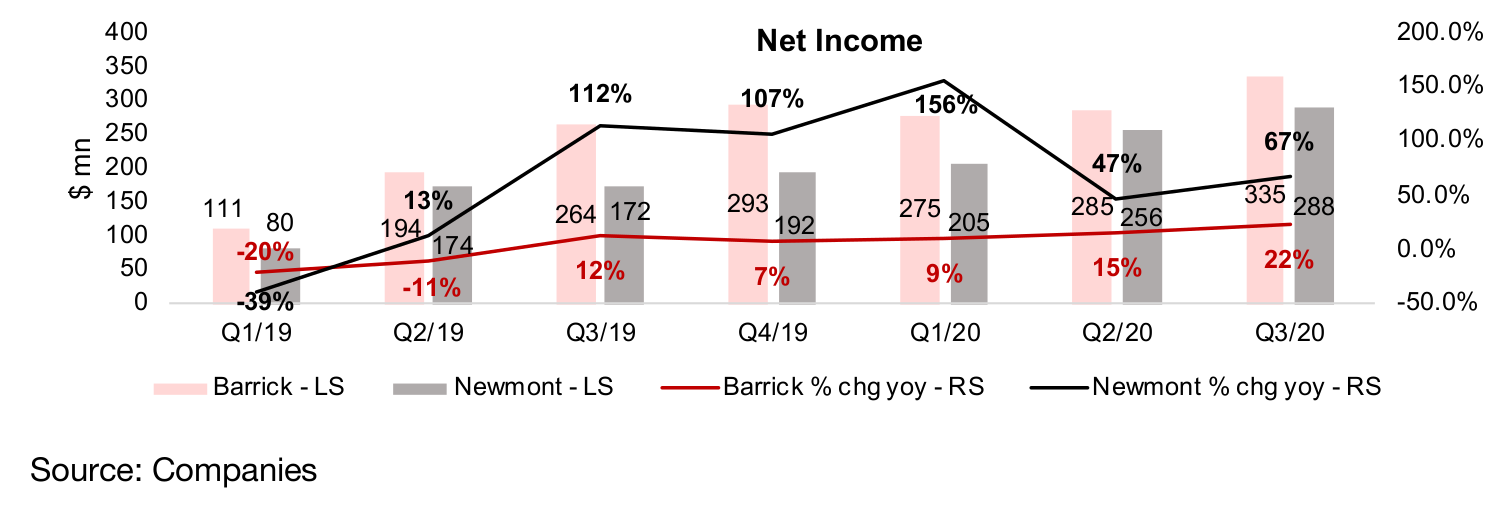
Newmont and Barrick's production growth actually declined considerably yoy with the shutdowns in Q2/20 to Q3/20, and yoy growth has declined since a very strong first half in 2019 (Figure 24). However, this was offset by the surge in the gold price, with both seeing strong revenue growth, although Barrick, with growth of 30% or more over each quarter this year this outpaced Newmont, which saw revenue growth of just 5% in Q2/20, and 17% in Q3/20 (Figure 25). The gold price has driven a major recovery in net income for both, with Barrick's net income in Q3/20 tripling from its level of Q1/19, and Newmont's more than quadrupling (Figure 26). While the growth rates might not be as strong for revenue and net income for these two companies heading into 2021, given the much higher base, we expect that the absolute levels of profits, especially compared to 2013-2018, will continue to remain impressive.
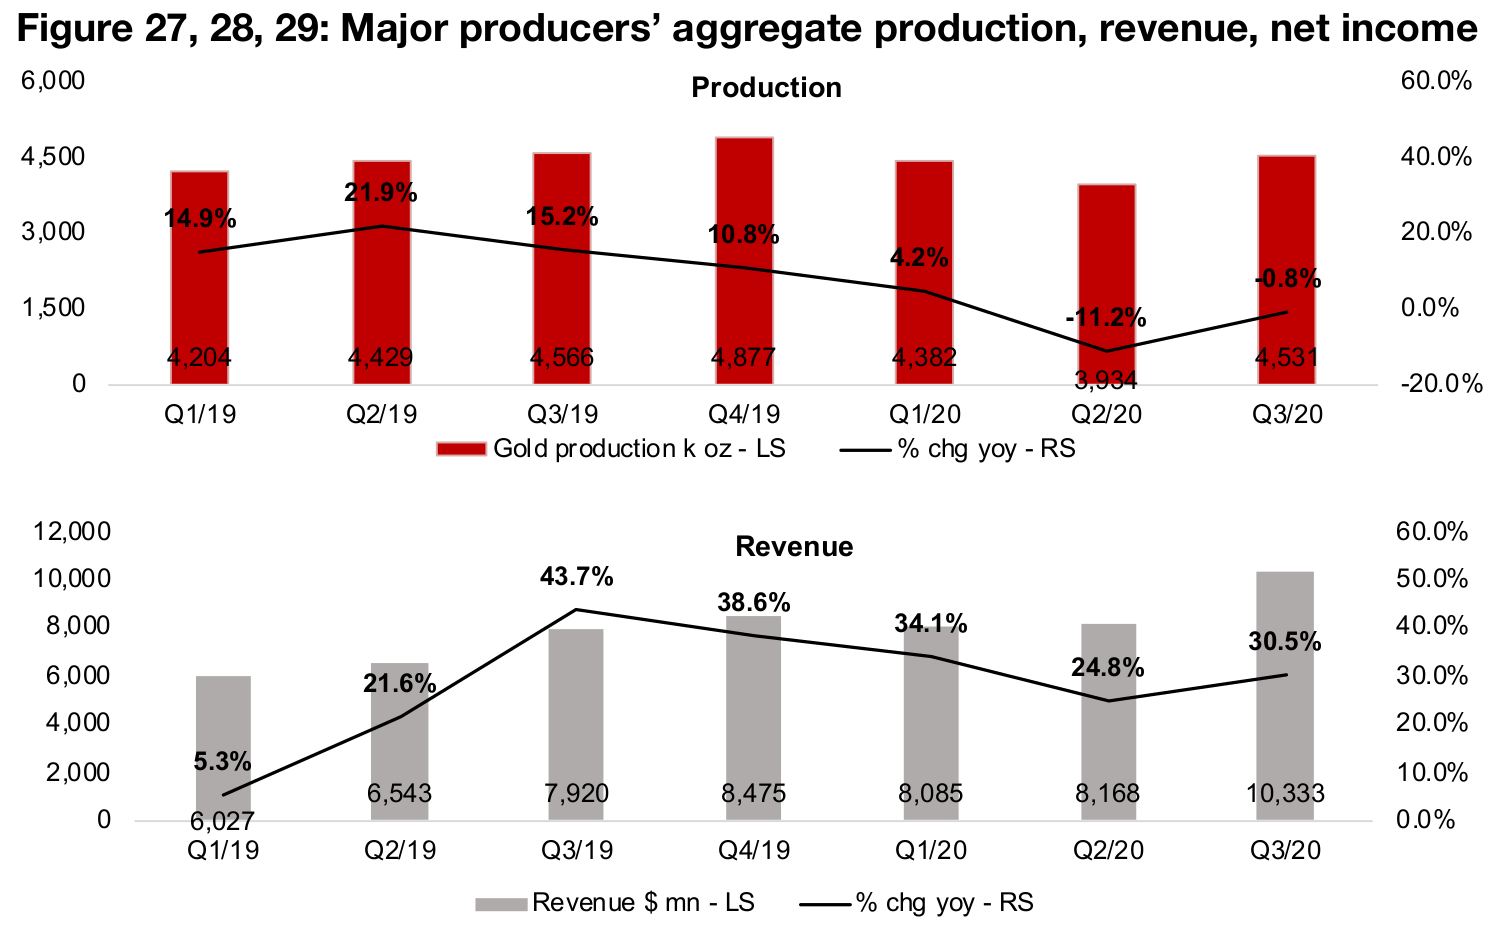
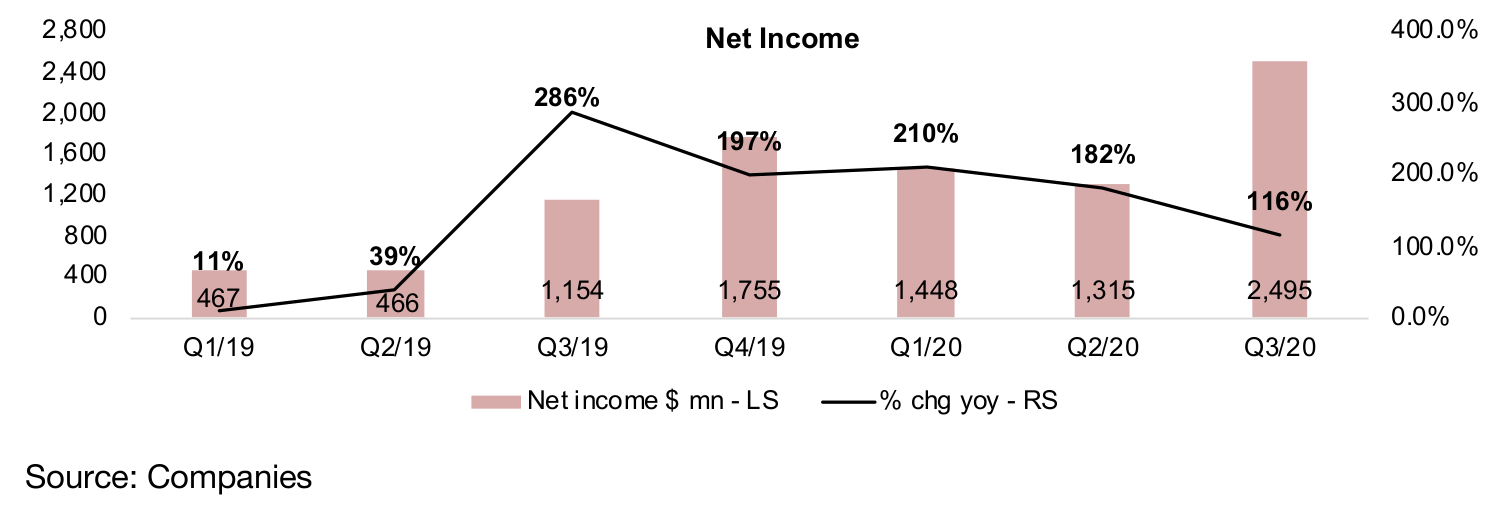
Looking at a broader aggregate including all of the companies in Figures 21-23, we can see a major pickup in the sector overall. Production was growing reasonably strongly over 2019 and into Q1/20, then contracted into the shutdown in Q2/20, and picked up to near flat growth in Q3/20 (Figure 27). Revenue and revenue growth jumped into the second half of 2019 as the gold price rose, and even during the Q2/20 slowdown revenue still grew 24.8% year on year, and picked up to 30.5% in Q3/20 (Figure 28). Given the producers' leverage to the gold price, the net income performance of the sector has been even more impressive, with growth over 100% yoy or more every quarter since Q3/19, with net income in Q3/20 at five times the level it was at for Q1/19 (Figure 29).
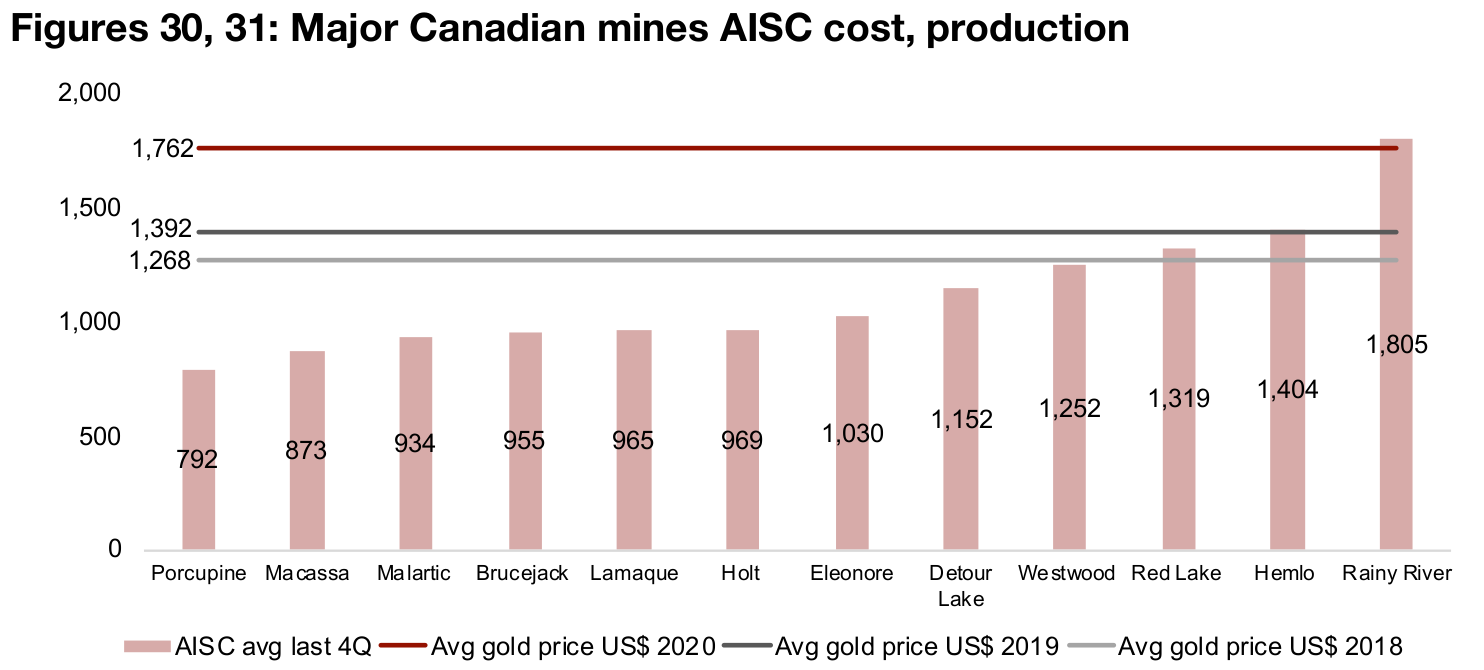
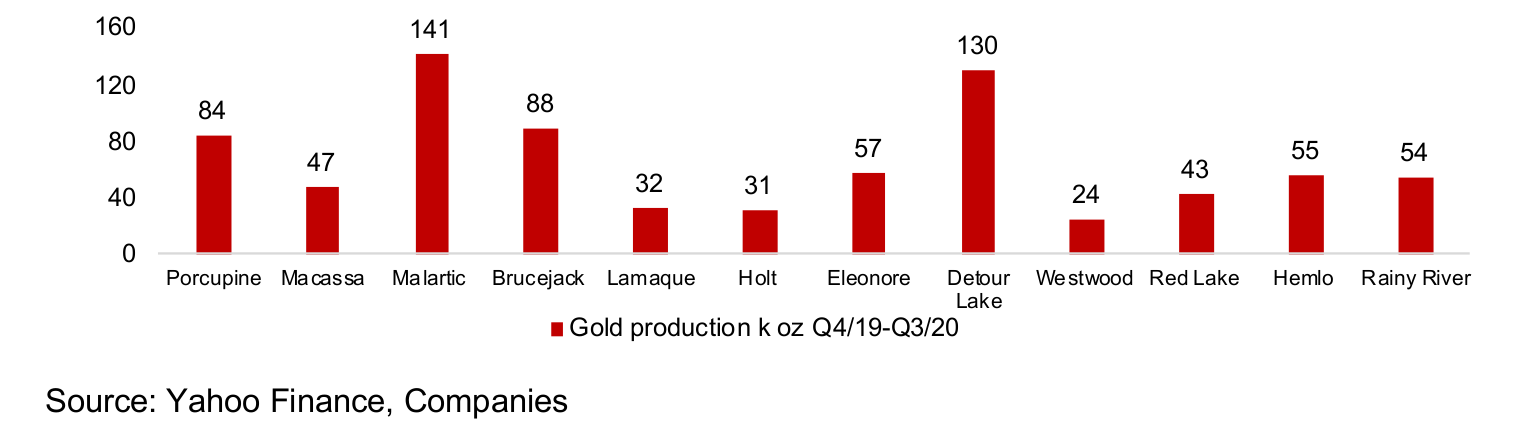
We can see the leverage to gold of the producers by comparing the gold price to the
all-in-sustaining-cost (AISC) per ounce of producing mines. In Figure 30 we show the
AISC of the major Canadian mines, and in Figure 31, the production at each of these
mines over the past four quarters to show the weighting of a given AISC. While the
gold price can make some major shifts within a relatively short time frame, the AISC
for a mine tends to be relatively flat over the medium term, and therefore moderate
increases in the gold price above a certain cost level can lead to much higher
percentage increases in profit, as we saw for the producers in Figure 29.
At the average price of US$1,268/oz in 2018, we see that some of the higher cost
mines would have been operating at a loss and most were only making moderate
margins. While profitability improved in 2019 as the gold price rose to an average
US$1,392/oz, it was still not particularly inspiring, but at the 2020 average of
US$1,769/oz, most mines are seeing impressive margins, and even the highest cost
mine is near break-even. If the gold price continues to head above US$2,000/oz as
is forecast in the consensus for 2021, margins and profitability could see another
major jump this year.
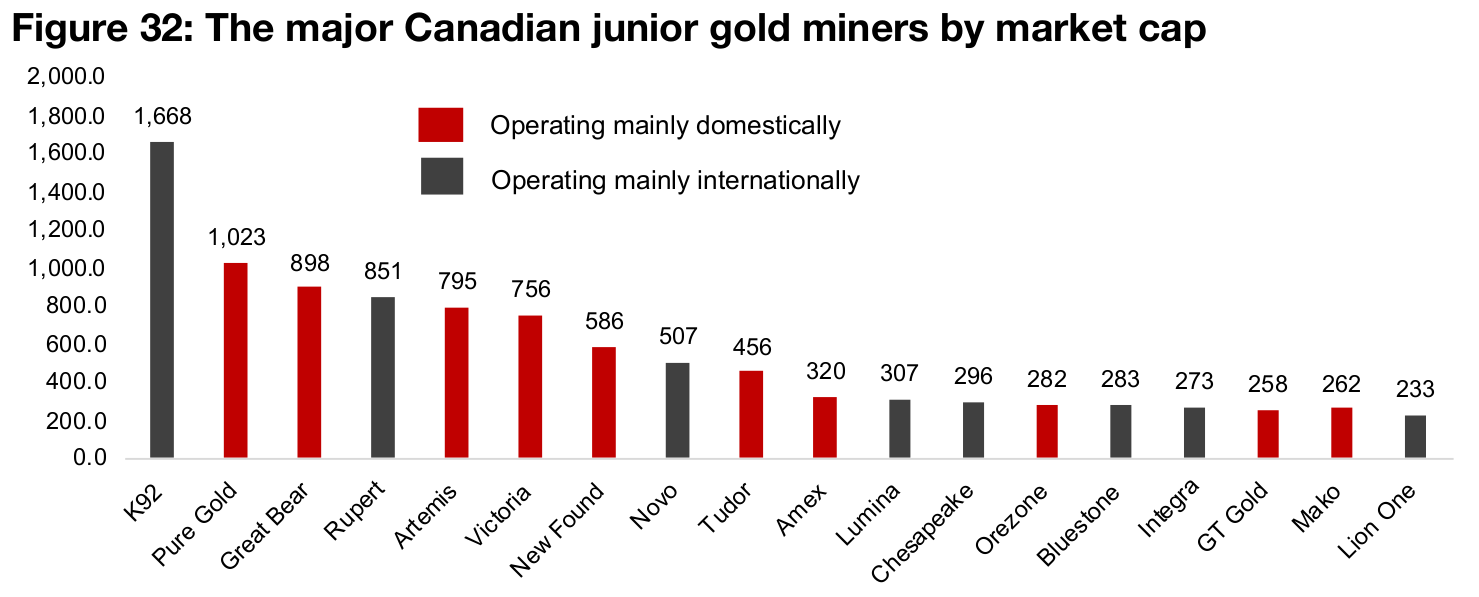
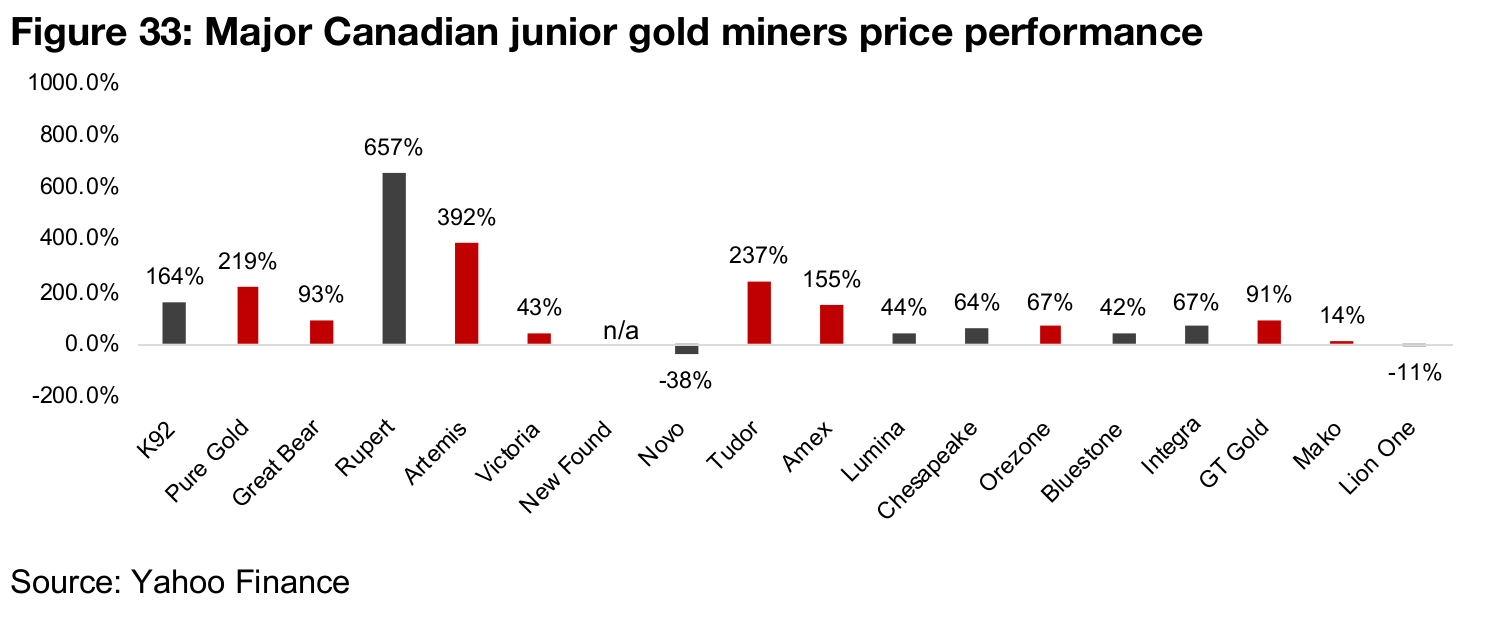
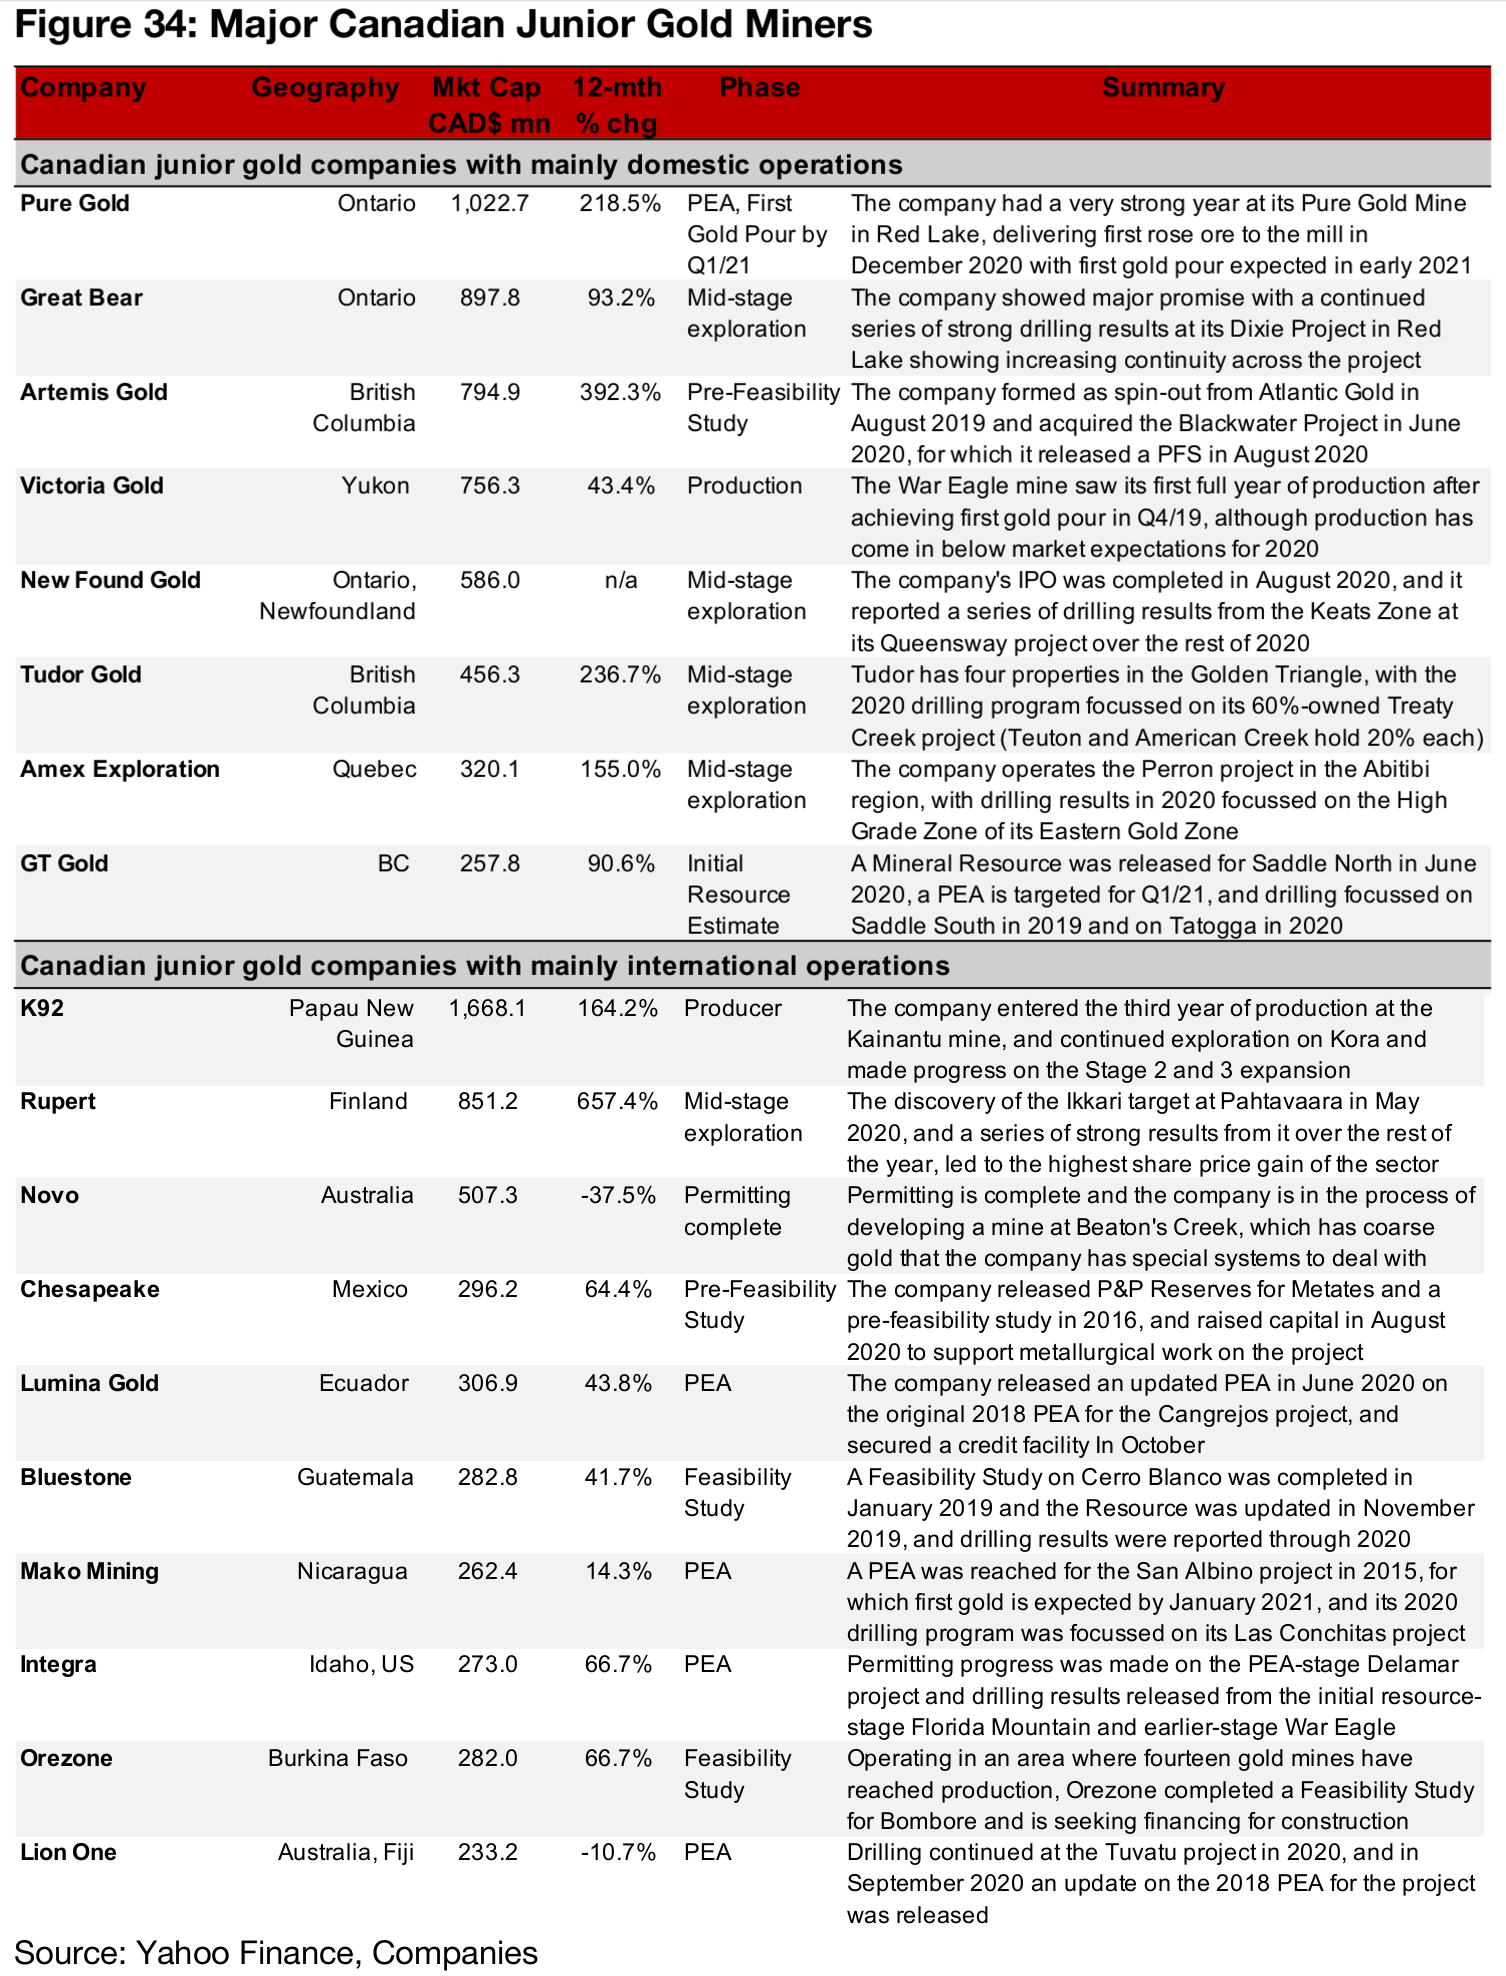
The major Canadian junior miners have seen an impressive 2020 overall, with big share price gains, rising multiples and a large amount of capital raised. Figure 32 shows the market cap of the major Canadian junior gold miners, Figure 33, the price performance ranked by market cap size and Figure 34 a summary of the companies, with their geographic focus, phase of development and the main news flow from 2020. Almost the entire group made substantial gains, with Rupert Resources seeing the best performance, up 657%, Artemis up 392%, Tudor up 237% and Pure Gold up 219%, while only two stocks in the group declined this year.
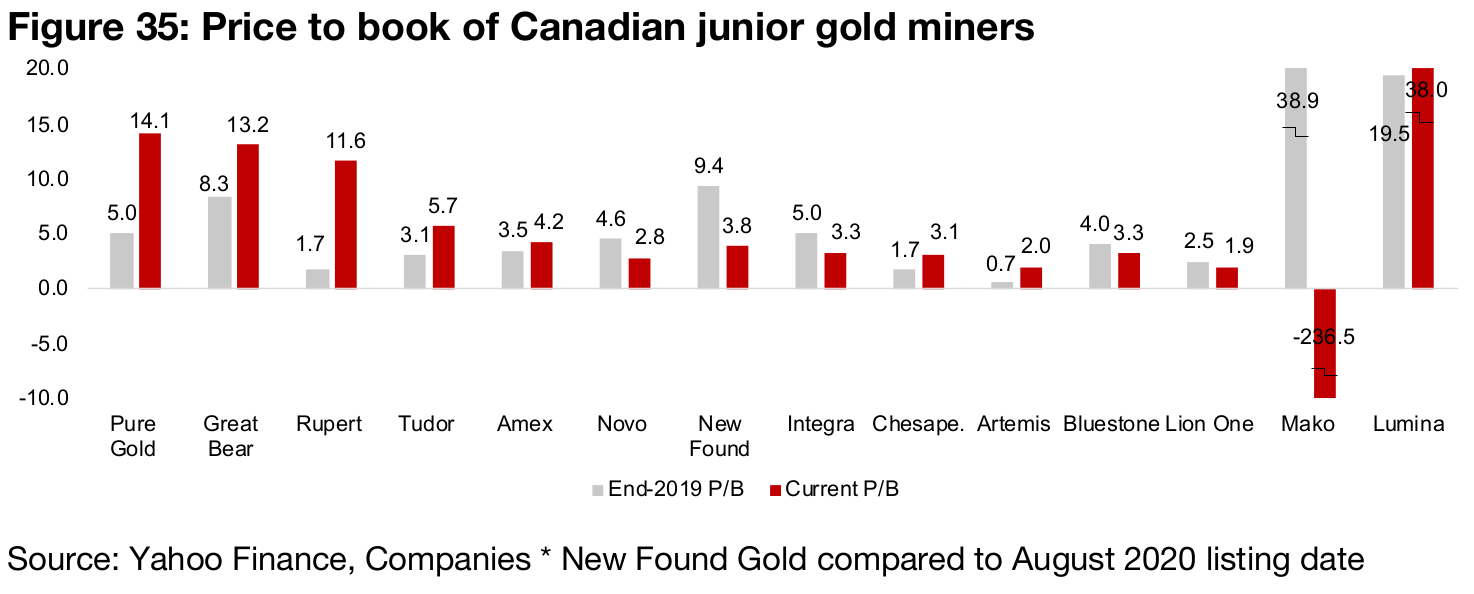
The market has seen an expansion in pricing multiples as of the end of 2020 for many
of the larger stocks this year compared to the end of 2019. Figure 35 compares the
market cap to the equity (or a price to book multiple) of the major miners ordered
from highest to lowest (apart from outliers Mako and Lumina with multiples that are
not meaningful because of low equity levels and put at the end of the chart). The
market is paying the most for the Red Lake plays, Pure Gold, at 14.1x, and Great
Bear at 13.2x (which both already had reasonably high multiples at the end of 2019),
and Rupert Resources, 11.6x, which saw a major expansion of the multiple this year.
The rest of the group is seeing lower multiples, ranging from 1.9x to 5.7x, with Tudor,
Chesapeake, Amex and Artemis seeing multiple expansion, but Novo, Integra,
Bluestone and Lion One seeing declines in their multiples this year. New Found Gold
is a special case that was only listed in August 2020, and is therefore compared only
to that date, but since then has seen a major contraction in its multiple.
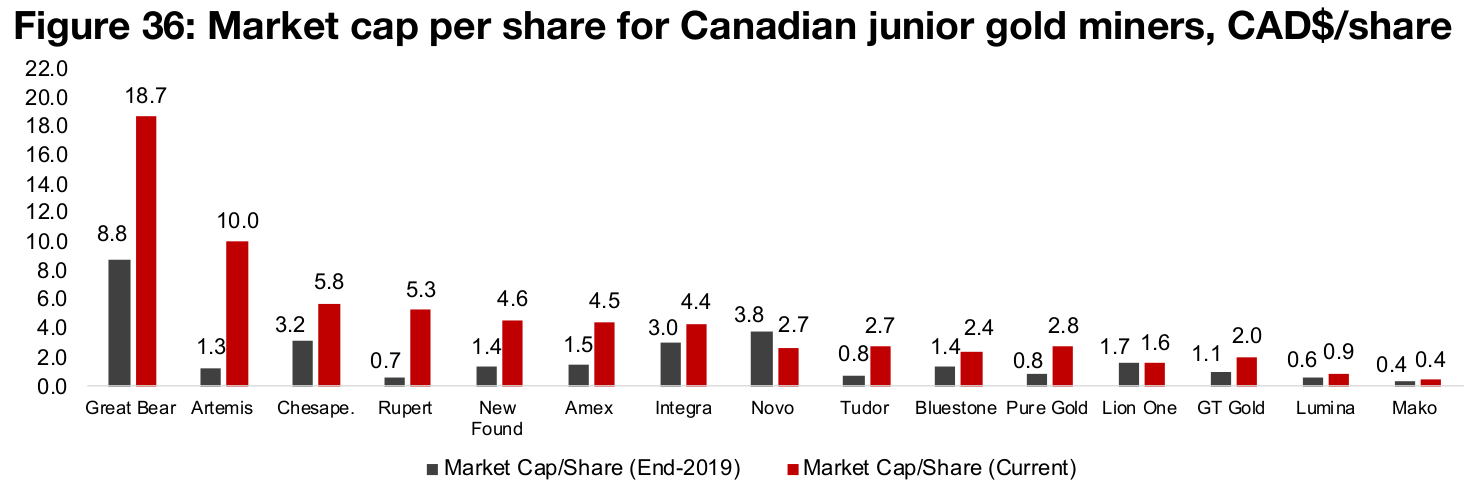
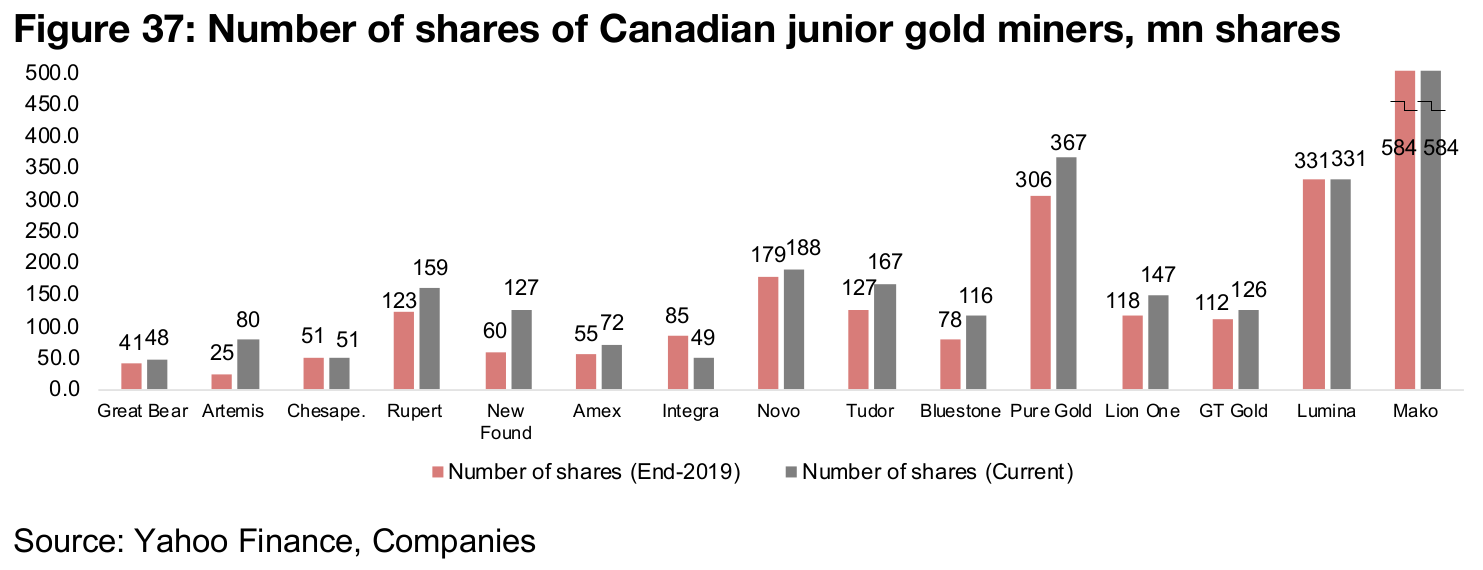
Another multiple used in the market when looking at junior miners is the market cap
per share (Figure 36). This is to compare companies that may both have high market
values, but where shareholders are facing different rates of dilution over time because
of varying rates of issuance of shares (Figure 37). Red Lake play Great Bear again
stands out here, as it did for the P/B multiple, for the highest market cap per share,
in comparison to Pure Gold, which is another strong Red Lake play, but that has
issued a much higher number of shares than its regional competitor.
Artemis also stands out on this measure, in part because it was only listed in 2019,
and has not had much time to go through a series of share issuances, as does New
Found Gold, which was only listed in the middle of 2020. Chesapeake, Rupert
Resources and Amex Exploration and Integra Resources also all stand out for a
relatively low number of shares versus its progress in terms of growing its market cap,
with all having a market cap/share ranging from $4.4-$5.8.
The major Canadian juniors had a strong year for capital raising in 2020, with the 12 companies shown in Figure 38 (we have excluded companies for which financials and new of capital raisings are not available on a quarterly basis going back to 2018) raising a total $289mn, which is more than double the $130mn of 2018. However, this is actually down from $348mn in 2019, which saw a major increase in capital raising especially in the second half of the year, as the initial resurgence in gold led to a jump in interest in investment in the sector.
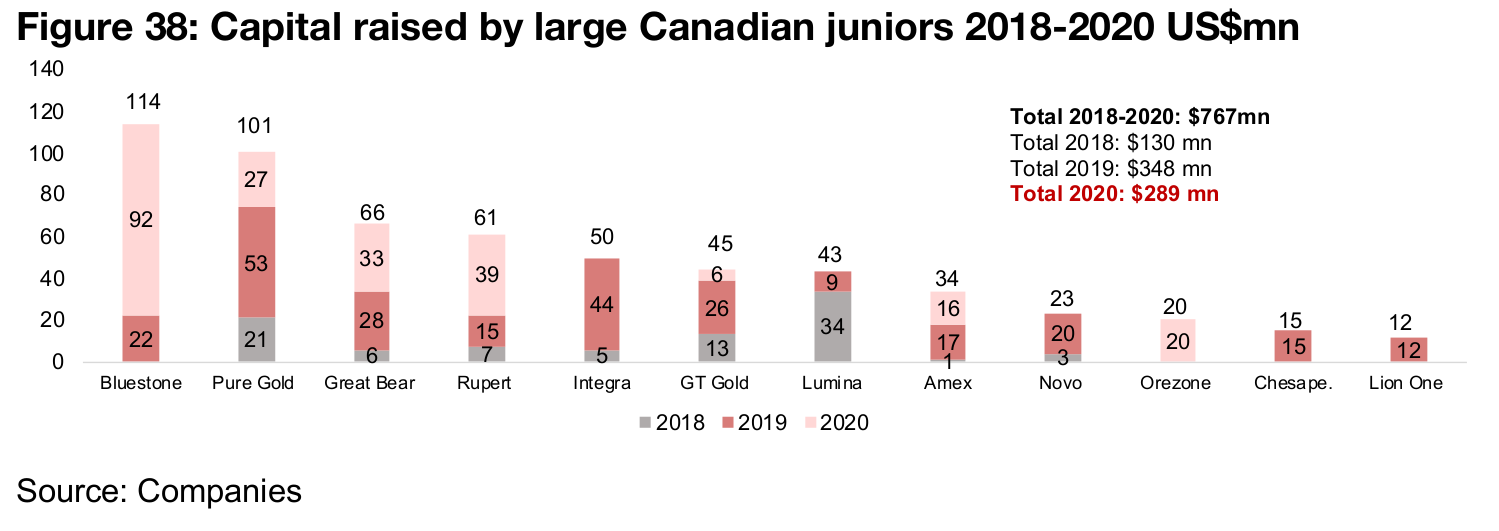
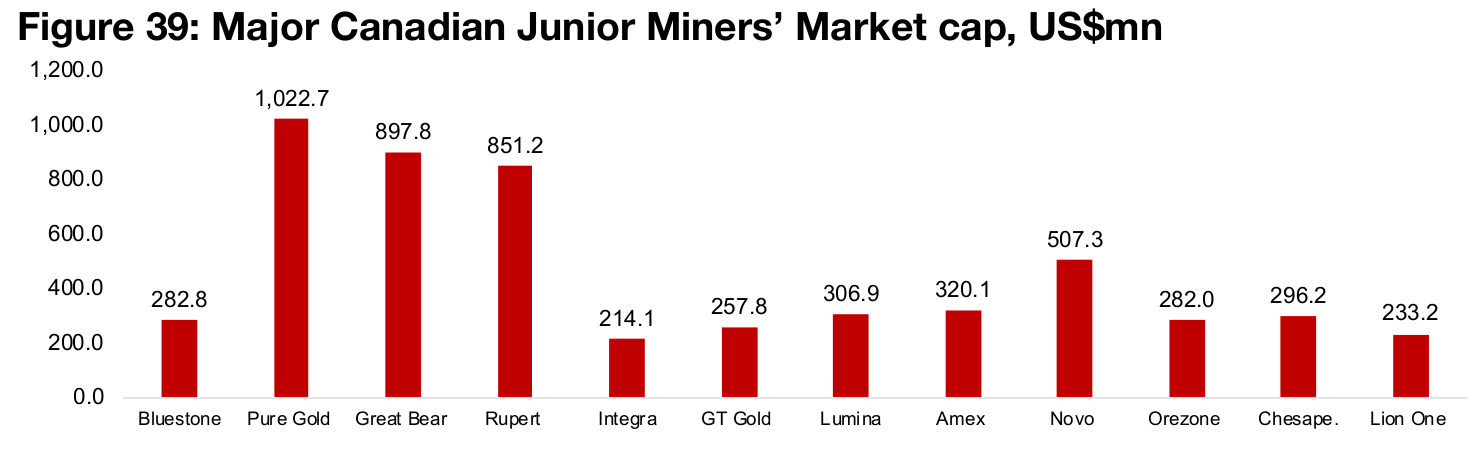
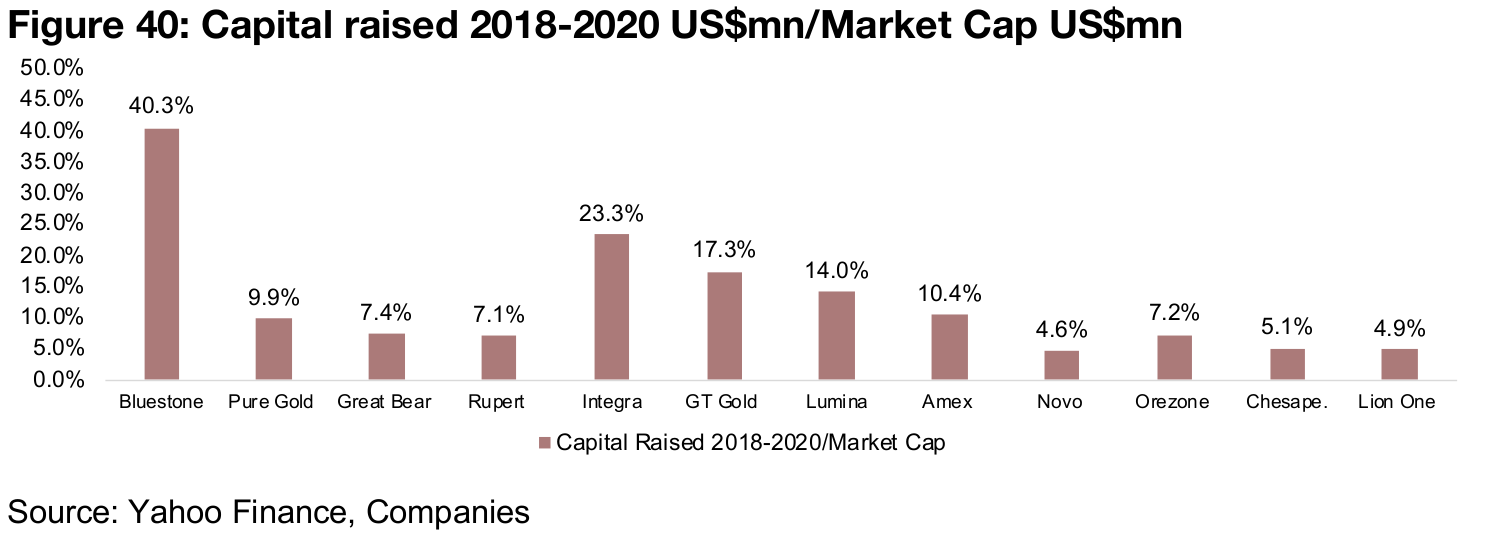
Figure 39 shows the market cap of each company and Figure 40 the capital raised from 2018-2020 as a percentage of the market cap. Bluestone has the largest amount of capital raised, after a major $92mn private placement in 2019. The next largest capital raising came from the Red Lake plays Pure Gold Mining, with $101mn, and Great Bear Resources, with $66m, and Rupert Resources, at $61mn, at just 9.9%, 7.4% and 7.1% of their market caps respectively. This shows that they are generating considerable gains in market value without requiring major additional capital. The other companies in the chart either are seeing a relatively high percentage of capital raised versus their market caps, or are relatively small in size.
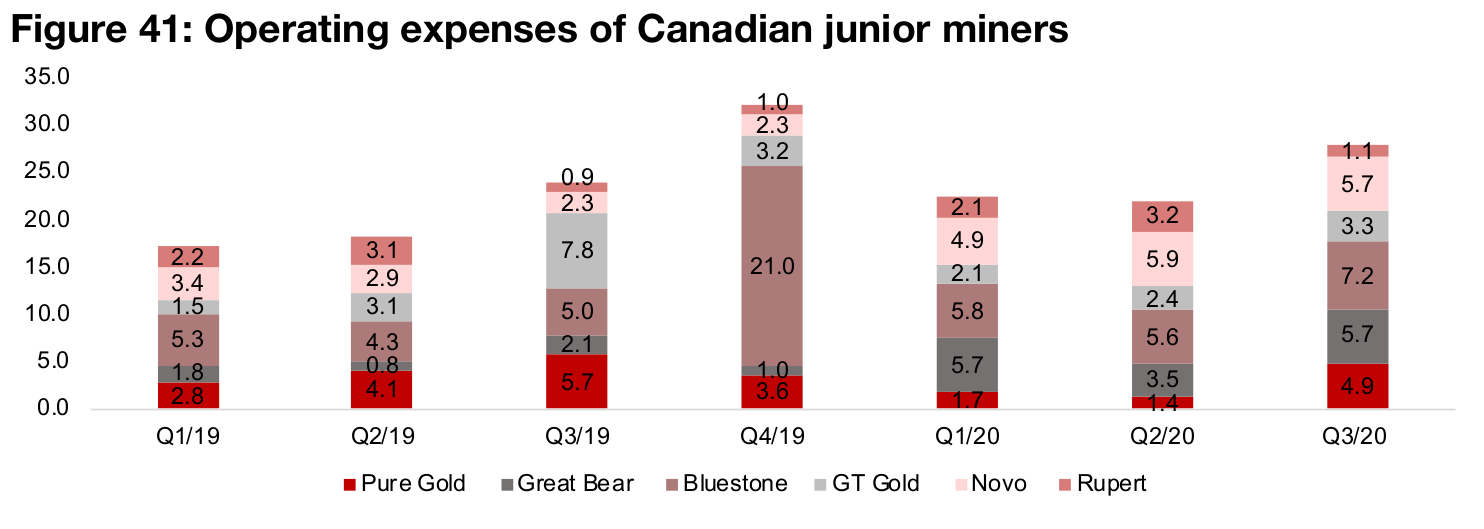
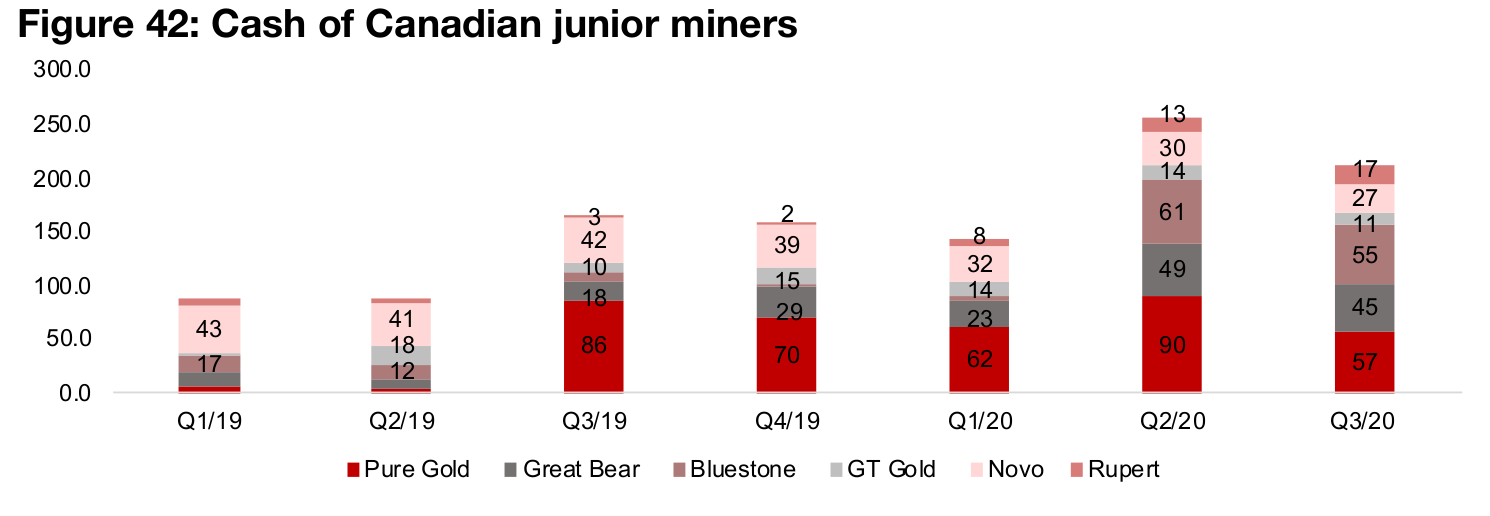
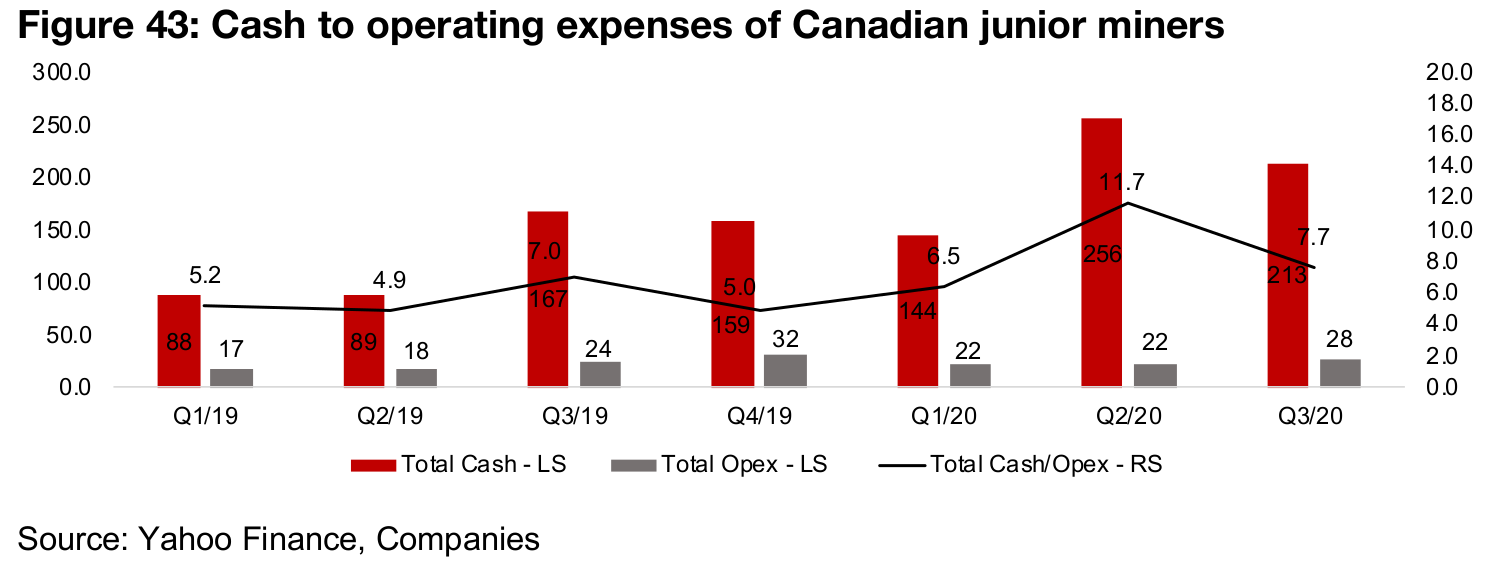
Figure 41 shows the operating expenses of a group of the larger market cap Canadian juniors (comprising relatively large companies with historical data available from Q1/19, including Pure Gold, Great Bear, Bluestone, GT Gold, Novo and Rupert). Figure 42 shows their cash balances, and Figure 43 the ratio of cash to operating expenses for the group. In general we are seeing both capex and cash picking up generally since 2019, although an opex peak was reached in Q4/19, and a cash peak in Q2/20, as capital was raised, but not put to work until Q3/20 partly because of the shutdowns. The cash to opex ratio came down in Q3/20 as exploration activities again picked up as the shutdowns were lifted.
A pickup in gold that began in the second half of 2019 reached full speed in 2020, driven by a combination of drivers, including especially an ongoing monetary expansion, which began well before the global health crisis, but was driven into high gear by the surging risks of 2020. We expect that the strong monetary expansion will continue throughout 2021, global economic risks will remain high, and the market will be much more wary of riskier alternative assets like equity than in recent years, which will be supportive of the gold price. Consensus forecasts for a median gold price of US$2,100/oz in 2021suggesting a rise of 18.7% from the US$1,769/oz 2020 average.
Even if gold were to remain flat, producers would be set for another strong year, with prices in 2020 already at levels where most mines are seeing very strong margins. The major producers saw a strong year even as many faced major shutdowns to production throughout the middle of the year because of the global health crisis. However, the rising gold price more than offset this, with revenue growth for the sector remaining strong, and net income, which is highly leveraged to the gold price, even stronger, up 100% yoy or more yoy the past five quarters. If gold to reaches the consensus estimates for 2021, the producers could see another impressive year.
The major Canadian juniors also had a very strong year, as a rising gold price and increasingly cashed up producers continued to the drive wave of investment into the sector which had begun in 2019. Most of the larger Canadian juniors saw major share price gains of 40% or more and several saw several hundred percent gains for the year. Gains in multiples were mixed, with some larger names seeing major P/B multiple expansion, but some seeing multiples slide. Capital raising for the sector was strong compared to 2018, but down moderately from 2019, and while both cash and opex have been rising, growth in cash has been higher, leading to generally rising cash/opex ratios since 2019. With the outlook for gold in 2021 looking robust, the junior gold miners look set to continue to draw major investment and expand exploration, and M&A activity in the sector could rise as cashed up producers go looking for potential buyout targets.
Disclaimer: This report is for informational use only and should not be used an alternative to the financial and legal advice of a qualified professional in business planning and investment. We do not represent that forecasts in this report will lead to a specific outcome or result, and are not liable in the event of any business action taken in whole or in part as a result of the contents of this report.