April 22, 2024
Institutions Understating Gold’s Potential?
Author - Ben McGregor
Gold’s ramp up continues as markets price in more risk
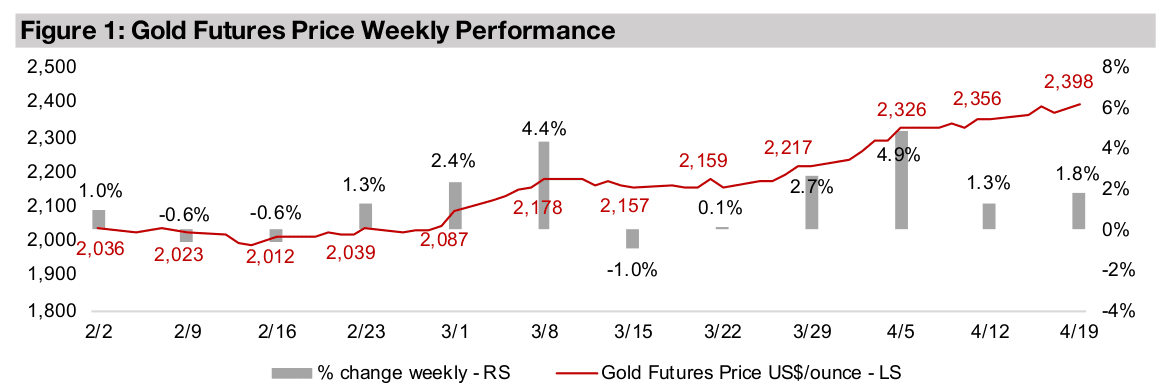
Gold rose 1.8% to US$2,398/oz this week, as has added nearly US$400/oz in about two and half months, as the market is clearly starting to price in more risk, with rate cut expectations slumping, bond yields rising and equities pulling back substantially.
Muted institutional gold forecasts and relative gold sector valuations
This week we look at the new metal forecasts from Australia’s Office of the Chief Economist, including a quite flat gold price for several years, which we expect could be an underestimation, and the relative valuations of the largest global gold stocks.


Institutions Understating Gold’s Potential?
The gold futures price rose 1.8% to US$2,398/oz and has now added nearly
US$400/oz in just two and half months. The gain came as geopolitical tensions
continued to remain elevated, especially in the Middle East. There has also been a
rise in economic risks, with the probability of a US rate cut in June falling to just 15%
and the US 10-year bond yield reaching 4.65%, near its highs for the year. Equities
slumped, with the S&P 500 down -3.5%, the Nasdaq plunging -6.1% and the Russell
2000 off -3.2%. This offset the rise in the metal somewhat for gold stocks, with the
GDX up 0.9% and GDXJ rising 0.5%.
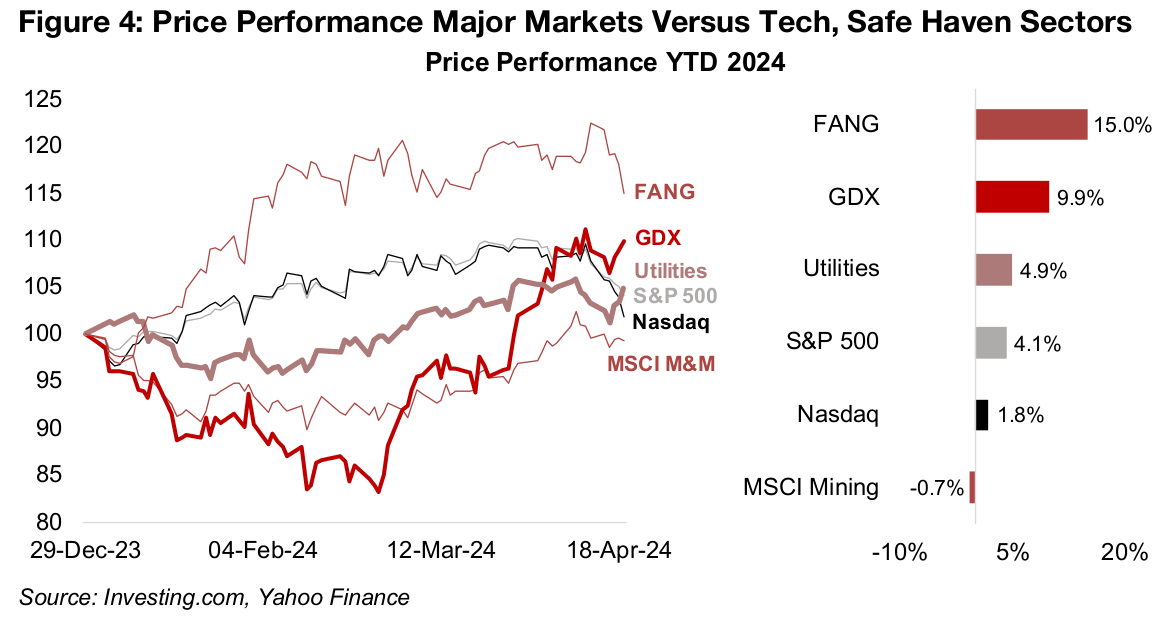
The drop in the Nasdaq this week was its worst since 2020 as large cap US tech has
finally come off the boil, with the FANG (Facebook/Meta, Apple, Netflix,
Google/Alphabet) stocks slumping -6.1%. This has dragged down the gain in the S&P
500 to 4.1% YTD with the Nasdaq up just 1.8% (Figure 4). One major market turning
point this week was the rise of the utilities sector, a key ‘safe haven’ sector, to 4.1%
YTD, overtaking the gain in the Nasdaq, indicating a major risk-off shift.
The performance of the gold stocks also supports this, having shot up to a 9.9% gain
this year and trouncing the S&P 500 and Nasdaq after struggling in the six months to
February 2024. While we had anticipated this rotation for several months, given the
lofty US tech valuations versus the low valuations of other major markets and sectors,
we did not expect it to be so abrupt. The next milestone for the gold stocks this year
will be to surpass the performance of the FANG stocks, and it won’t take too much
more of a gain in the former and drop in the latter to get there.
Upgrades continue for 2024 gold price target…
Australia’s Office of the Chief Economist (AOCE) has released its March 2024 quarterly report, including forecasts for the prices of the major metals for 2024. These have continued to diverge, with upgrades especially for iron ore, mainly from a rebound in Chinese demand, and gold, as it is supported by both high economic and geopolitical risk (Figure 5). Note that the forecasts in this report would have been made before the parabolic move in gold really accelerated over the past month, and further upgrades are likely possible in the next AOCE quarterly.
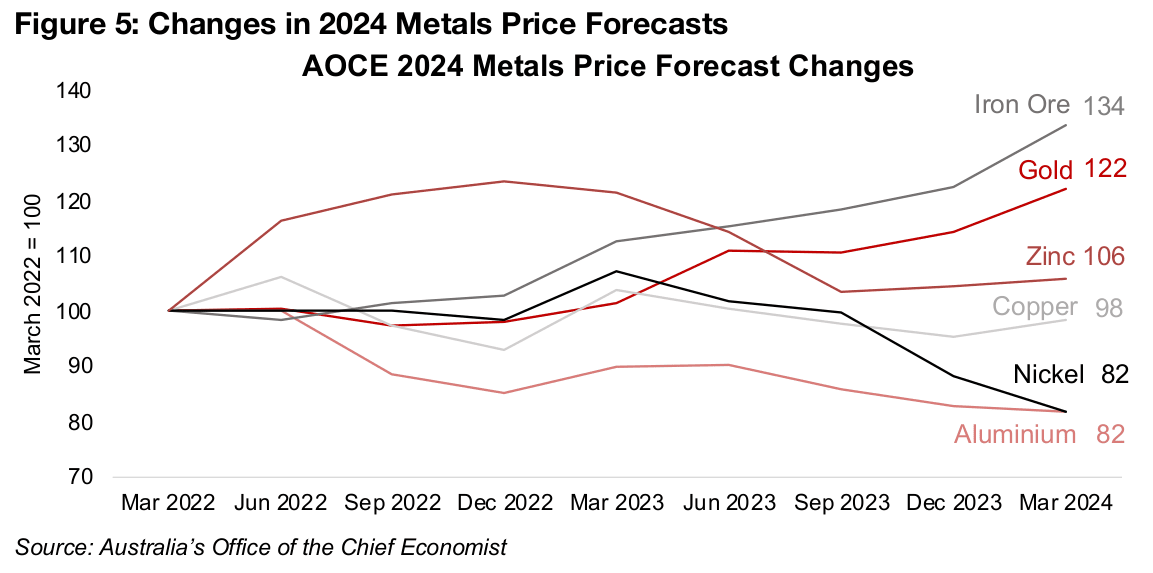
The institution has been more neutral on the 2024 copper price, with forecasts flat
since 2022. While the 2024 zinc forecast is well off 2022 highs it has not moved
substantially for three quarters. The big downgrades have been the nearly 20% cuts
over the past two years for nickel and aluminum. The largest gain in 2024 is expected
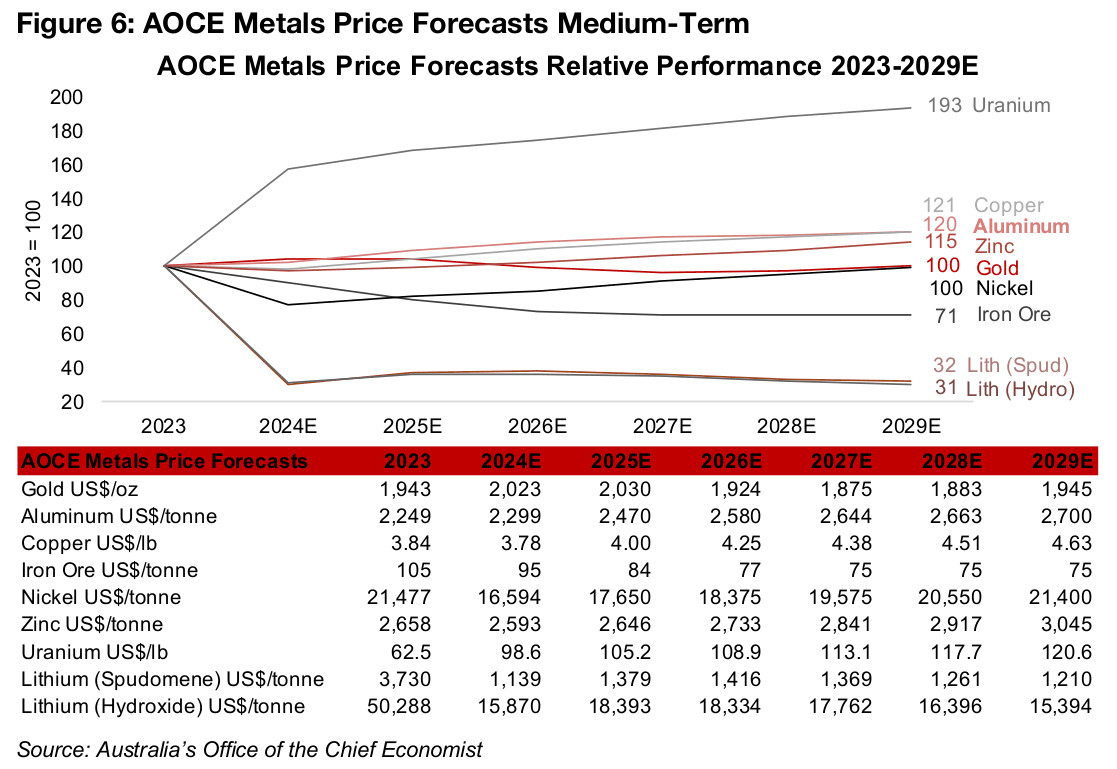
to comie from uranium, followed by a gradual uptrend over several years (Figure 6).
The biggest decline is forecast for lithium, with a slump this year, and the price
languishing through to 2029. This is obviously quite a reversal from the EV-mania and
Chinese lithium processing undersupply that sent the price surging in 2022, with both
of these factors having reversed. The other big forecast decline is for iron ore, with
even the 2024 upgrades still indicating a negative outlook, just less so than in recent
quarters, driven especially by cooling expected demand for steel in China.
For copper, aluminum, nickel and zinc, with the two former especially major
barometers of overall economic growth, the AOCE forecasts a gradual uptrend over
the next several years. This is consistent with a steady improvement in the global
economy, and is typical of major institutions, which tend not to explicitly forecast
major downturns or recoveries in their long-term forecasts, presenting a smoothed
picture of the average trend.
…but AOCE forecasting pullback in gold over next several years
Even taking into account the ‘smooth forecast’ bias of major institutions, it appears
to us that they continue to underestimate the potential for the gold price. While the
AOCE 2024 gold forecast has risen, this is again a case of institutions playing catchup,
as has been seen over the past several years, with its US$2,023/oz target already
looking low given the recent run and average price YTD over US$2,100/oz (Figure 6).
AOCE expects gold to remain flat in 2025, decline through 2026E-2027E, moderately
pickup in 2028E-2029E, and wind up US$450/oz below the current price in six years.
We suspect that this may be significantly underestimating gold and implies quite low
levels of economic and geopolitical risk over the next several years, even though both
are extremely high at present, and seem likely to remain so. The World Bank has also
underestimated the gold price in recent years, and may be doing so again, in our view,
with a forecast for just US$1,900/oz in 2024 and decline to US$1,700/oz in 2025.
This is likely because of the institutional imperative to assume upcoming periods will
show economic improvement, outside of crises that have already erupted and cannot
be ignored in forecasts. In contrast, forecasting a price spike in gold prices tends to
imply a deteriorating economic or geopolitical situation, and is something that major
institutions will tend to avoid. These muted institutional gold forecasts are becoming
increasingly at odds with the rest of the market, with many major investment banks
having upgraded their targets to US$2,500/oz-US$2,700/oz for this year.
Differentiating between the performance and valuations of major gold stocks
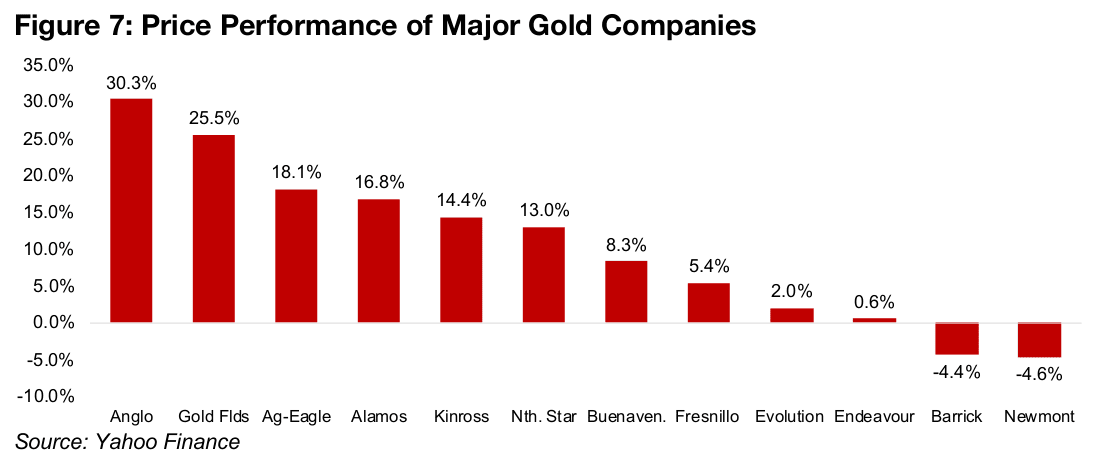
The huge rise in the metal price this year has obviously been good for gold stocks overall, and even those that haven’t gained in 2024, have erased a substantial amount of their losses (Figure 7). As the ‘rising tide’ of a gold run as strong as the one this year does effectively ‘lift all boats’, one strategy is to simply buy the diversified GDX ETF of global gold producers and hold it. However, for investors still looking for relative plays of individual stocks within the major global gold stock sector, this week we map out the consensus expected returns, earnings growth and valuations.
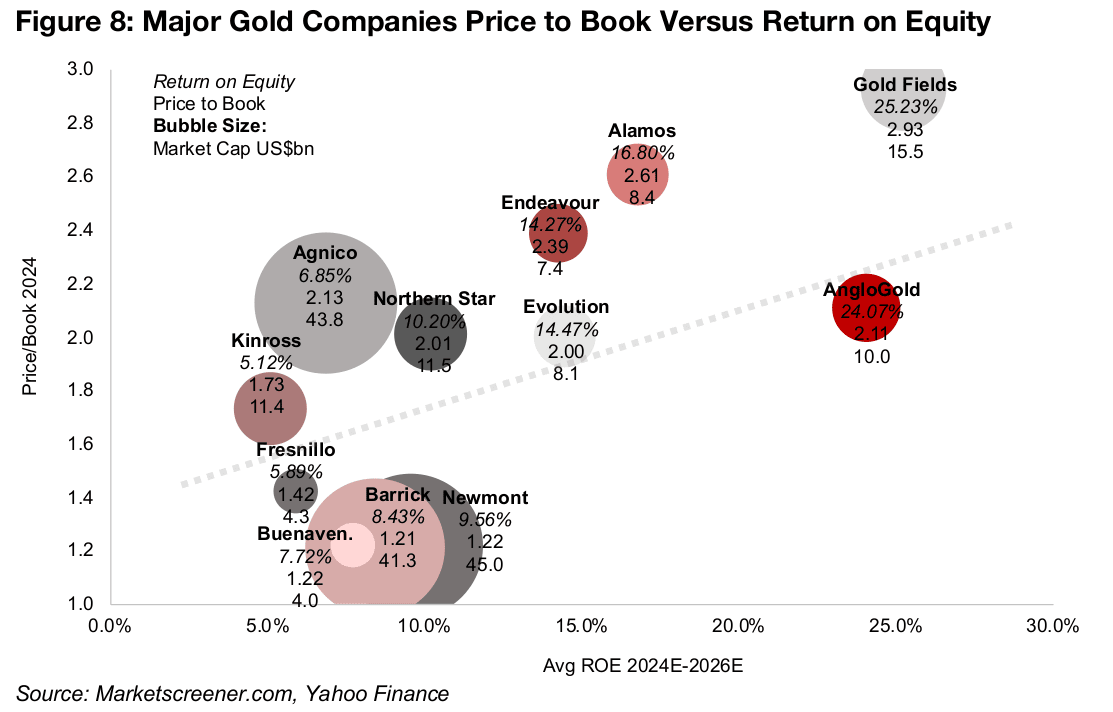
One set of metrics to look at is forecast return on equity (ROE) versus price book
(P/B), with the expectation that the market will pay a higher price to book for higher
ROEs. In Figure 8, therefore, we expect the companies to be arranged at an upward
sloping angle with an average near the grey line. While the group generally follows
this upward slope, some are above the line, potentially indicating overvaluation, or
below, including undervaluation. This is of course not a hard and fast rule, however,
and there often can be justifications for divergence substantially from the line.
Of the three industry giants, Barrick and Newmont stand out for being below the line,
and while their expected average returns from 2024E-2026E are moderate, at just
8.43% and 9.56%, respectively, their P/B multiples valuations are also very low at
1.21x and 1.22x. Note that companies trading at or below a P/B of 1.0x that are not
clearly in operational distress are generally considered quite inexpensive.
The other industry giant Agnico-Eagle, in contrast, although it has even lower
expected returns at 6.85%, trades at a P/B of 2.12x, nearly twice the other two
industry giants. Another standout is Gold Fields, with its much higher P/B of 2.93x
justified to some degree by the highest ROE of the group, at 25.2%, although
AngloGold has similar returns, at 24.07%, but trades at a P/B of just 2.11x. Most of
the other companies are reasonably close to valuation line.
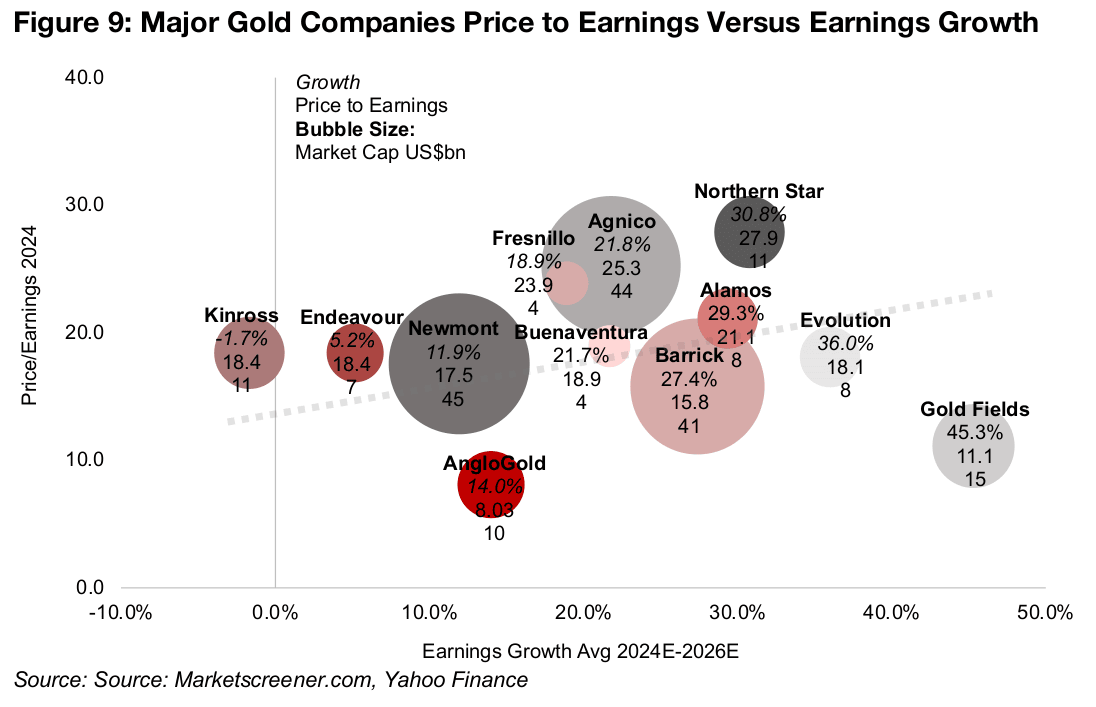
While ROE and P/B multiples tend to be more stable over time, the market often
focuses instead on earnings growth versus price to earnings (P/E) when valuing
stocks, even though both can be more volatile. Using this metric Newmont and
Barrick still look undervalued and Agnico Eagle is still above the line, but with less
divergence than using P/B to ROE (Figure 9). Gold Fields again leads the group with
the highest earnings growth, but its P/E looks low, while Anglogold, its comparator
above, has far lower growth, explaining its position below the line. The rest of the
group do not diverge significantly from the line, suggesting reasonable relative pricing.
We have shown in earlier weeklies that revenue estimates for the major gold
companies do not seem to have priced in the recent ramp up in gold. This means that
there is potential for analysts to eventually start upgrading to a newer higher average
gold price, boosting the returns and earnings estimates of these companies.
Interestingly, if this gold price upgrade is done evenly across the group, the entire
P/B to ROE and P/E to earnings graphs could conceivably shift up in tandem, leaving
the relative positions between the companies on the chart the same.
Still significant upside to targets for most major gold companies
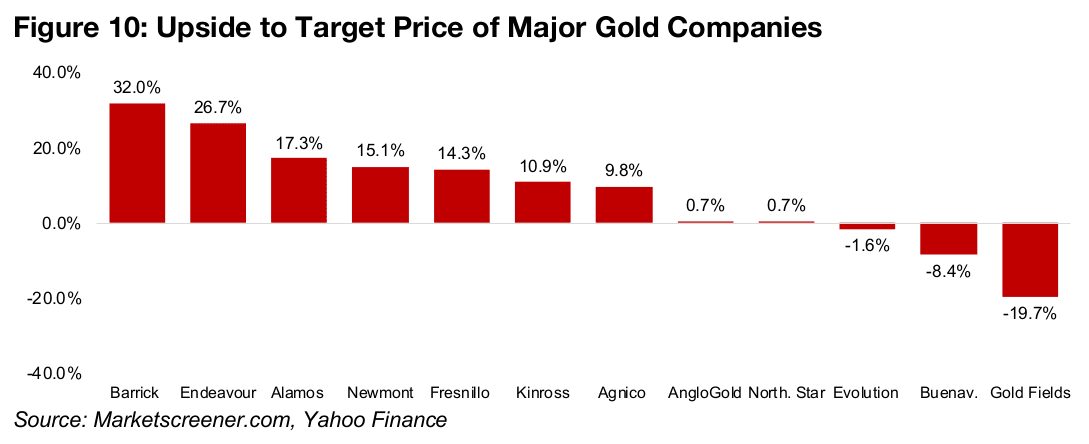
While these relative valuations offer a good overall guide for the sector, the final arbiter for a given company is the split between its price and the market’s consensus target. Inline with the undervaluation implied by P/B to ROE for Barrick and Newmont, they have 32.0% and 15.1% upside to their targets, and while Agnico Eagle, with its relatively high looking valuation, still has upside, it is lower, at 9.8% (Figure 10).
Gold Fields, which looked overvalued on P/B to ROE has a significant -19.7% downside to its target price and Evolution, which is nearly exactly on the line for both valuations, has just -3.0% downside. However, Buenaventura which was below the line on P/B to ROE but near the line on P/E to earnings growth still has -8.4% downside. This shows that these relative valuations, while providing a good overview for the sector, are still rough tools at best in terms of judging the actual potential upside or downside for these gold stocks.
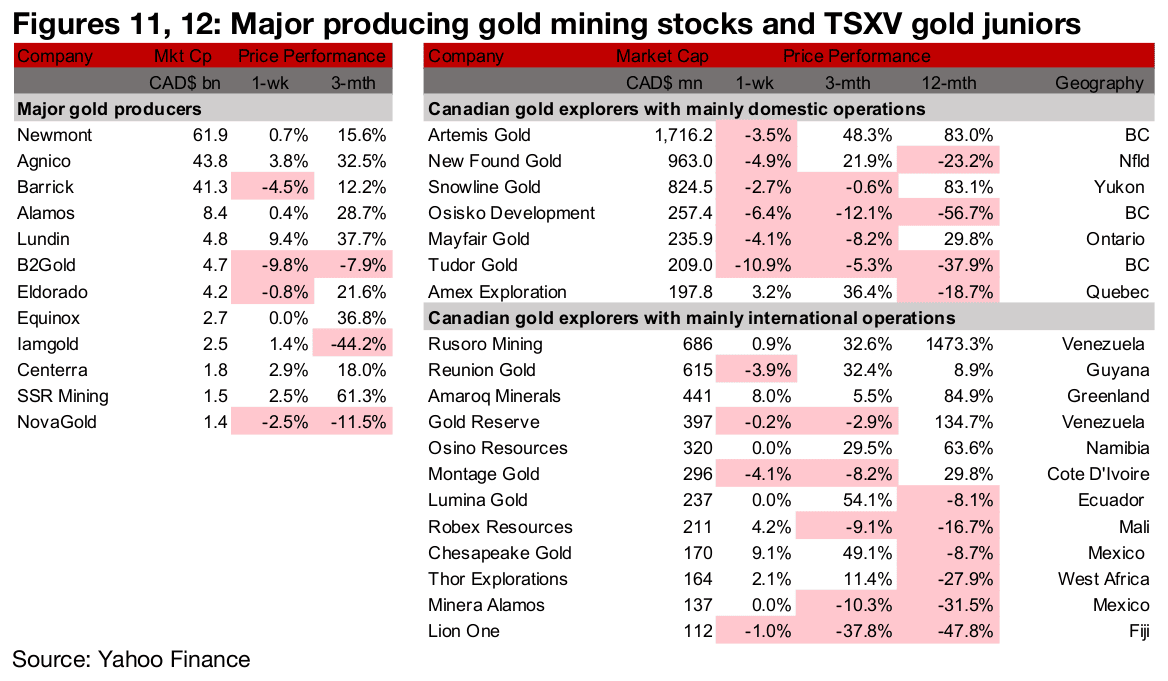
Major producers and TSXV gold mixed
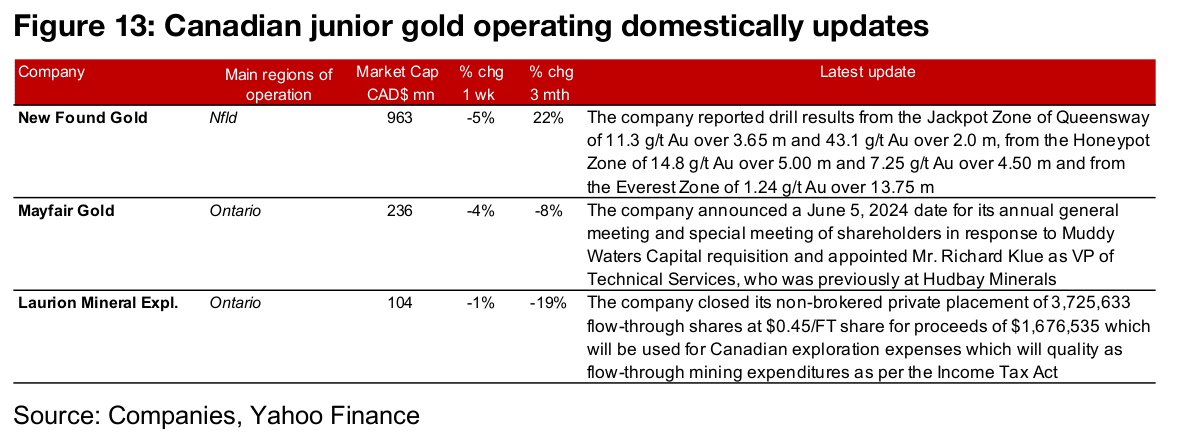
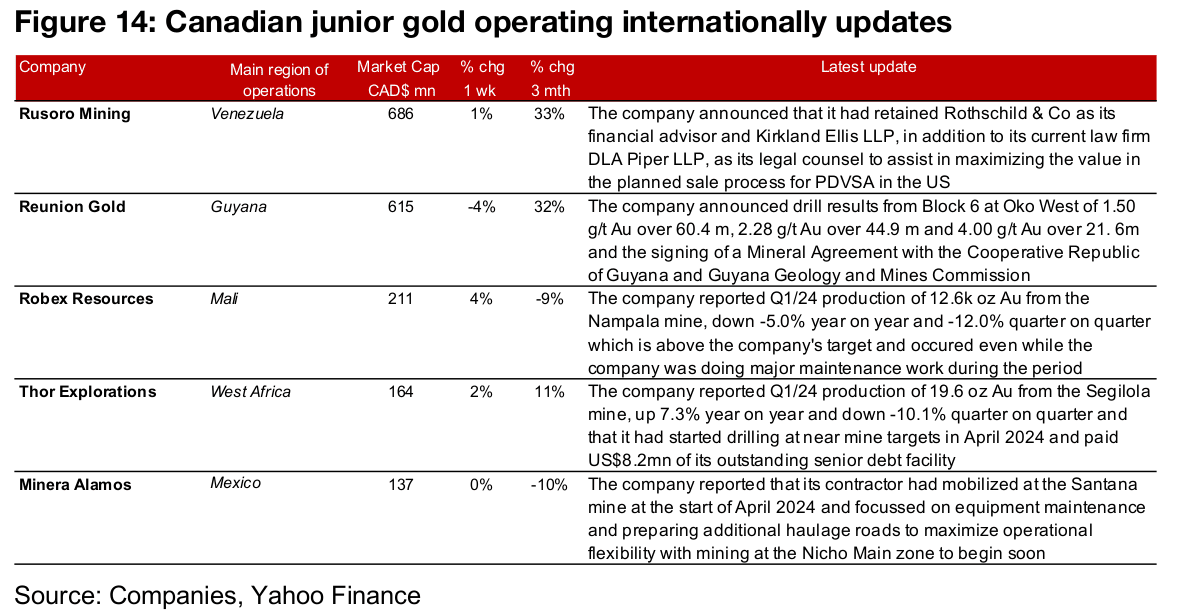
The large producers were mostly up while TSXV gold was mixed as a slump in the equity market offset the rise in gold (Figures 11, 12). For the TSXV gold companies operating domestically, New Found Gold reported drill results from the Jackpot, Honeypot and Everest Zones of Queensway, Mayfair Gold announced a date for its shareholder and special meeting and new VP of technical services and Laurion Mineral Exploration closed its $1.68mn private placement (Figure 13). For the TSXV gold companies operating internationally, Rusoro Mining announced a financial advisor and legal counsel, Reunion Gold reported drill results from Block 6 of Oko West, Robex Resources and Thor Explorations released Q1/24 production data and Minera Alamos gave an operational update on the Sanatana mine (Figure 14).
Disclaimer: This report is for informational use only and should not be used an alternative to the financial and legal advice of a qualified professional in business planning and investment. We do not represent that forecasts in this report will lead to a specific outcome or result, and are not liable in the event of any business action taken in whole or in part as a result of the contents of this report.


