
November 14, 2022
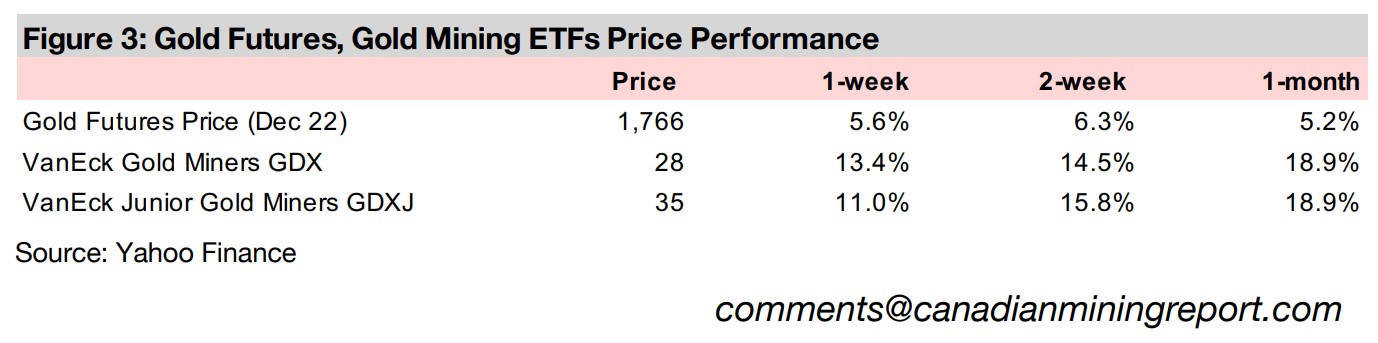
Gold surged 5.6% this week to US$1,766/oz, driven earlier in the week by a decline in the US$ and then by lower than expected US inflation which pushed down the US$ and bond yields further while the S&P 500 had its strongest daily gain since 2020.
Patriot Battery Metals is In Focus this week, with the company exploring for lithium in Quebec with very strong drill results seeing its market cap rise over tenfold this year to $477mn, bringing it into the group of larger cap TSXV lithium companies.
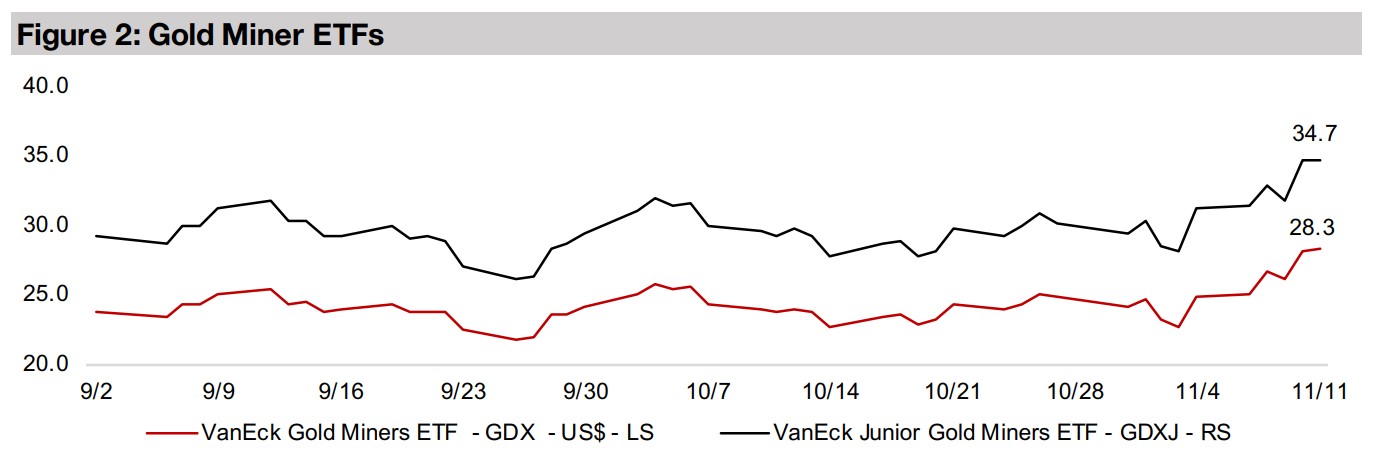
The producing and junior gold miners saw huge gains this week with the GDX up 13.4% and GDXJ rising 11.0% and the larger cap TSXV gold stocks mostly rose as lower than expected US inflation drove a manic rip in gold and the equity markets.


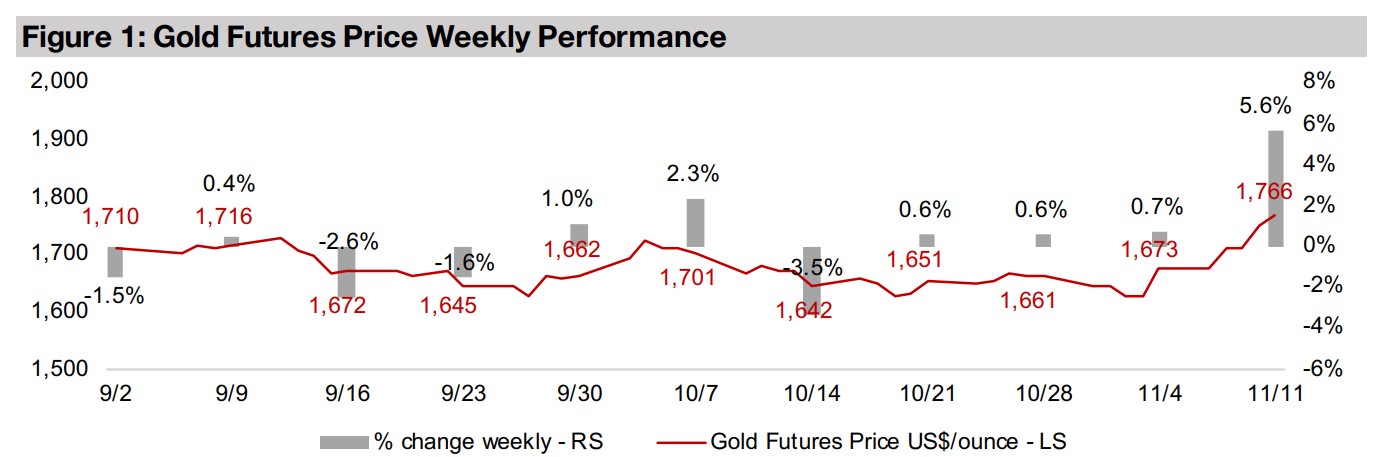
Gold had an extremely strong week, up 5.6% to $US1,766/oz, with the first leg up earlier in the week on a weakening US$, and then a major surge, along with stock markets, later in the week as lower than expected US inflation once again led to hopes of a pullback by the Fed on its rate hikes. With such market exuberance, it is worthwhile to put these moves into the broader context of the past year, and not get carried away with the idea that all is suddenly well because US inflation edged down a bit. The huge 5.0% single day ramp up in stocks on Thursday reminded us of Warren Buffett's quote that 'the market is manic-depressive', based on his mentor Benjamin Graham's idea from the classic The Intelligent Investor. Graham wrote that "Mr. Market Does not always price stocks the way an appraiser of a private buyer would value a business. Instead, when stocks are going up, he happily pays more than their objective value; and, when they are going down, he is desperate to dump them for less than their true worth."
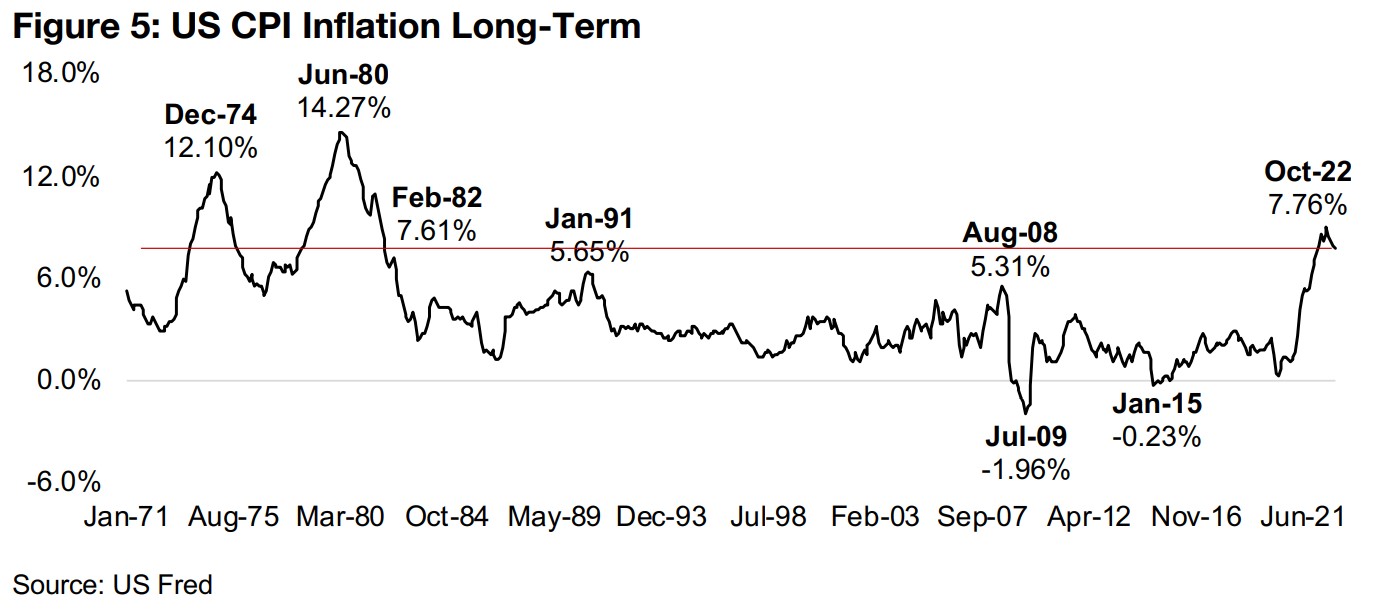
The idea behind the surge in the stock market and gold on the lower than expected inflation seems to have been that consumer prices were finally starting to get under control, with the market possibly extrapolating on the recent downtrend in US CPI growth. This would imply that the Fed would be able to pull back on the degree or level of its rate hikes, bringing some relief to asset prices and the economy. However, we believe that such expectations may be a bit premature. First, while inflation has declined, it has only pulled back about 1.25%, and this has taken four months, from 9.00% at its peak in June 2022, to 7.76% as of October 2022 (Figure 4). If US inflation were to continue to fall at this pace, it would still be over 5.0% as of mid-2023.
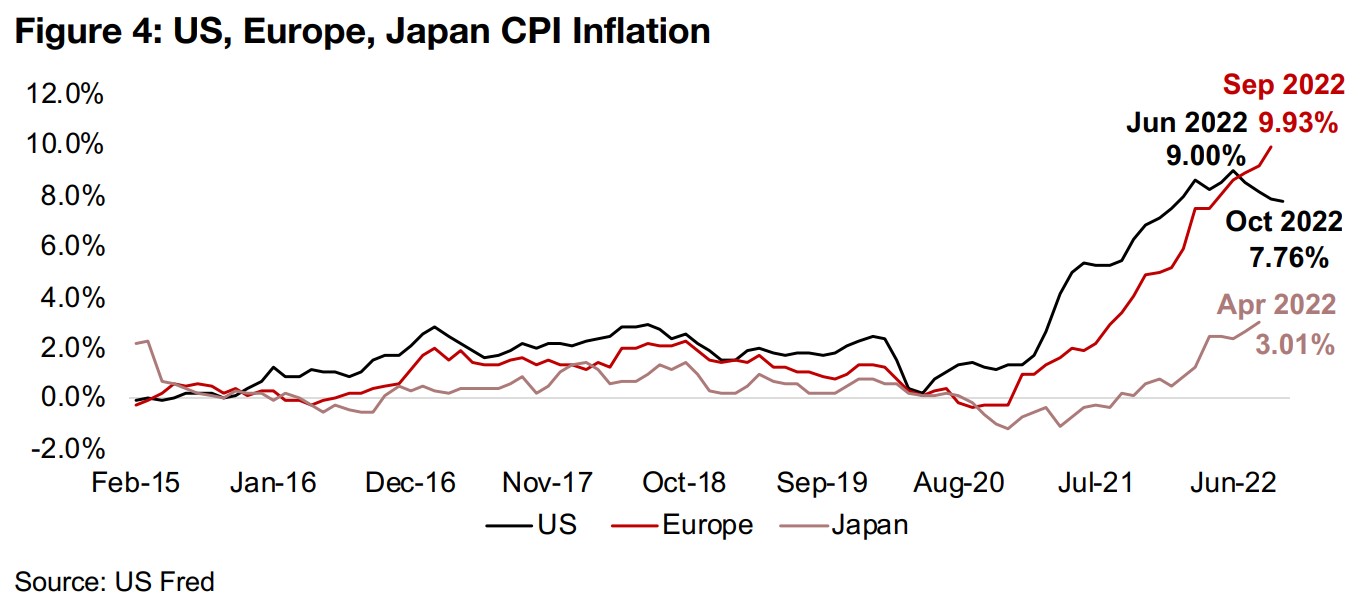
Also, global inflation continues to surge, with Europe and Japan at new highs as of their most recently reported data in September 2022 at 9.93%, and 3.01% in April 2022, respectively. This is in part because these regions have lagged the US substantially in hiking rates, but they could be forced to soon hike rates, putting all the largest developed regions in a rate hike cycle. While this could help reduce inflation, it would likely have the offsetting negative effect of strongly curbing global economic growth. Looking at the recent drop in US inflation in a long-term context shows that the current rate could hardly be considered low yet. It remains at forty year highs, having only been surpassed during the particularly severe oil-price-driven inflation shocks of the 1970s and early 1980s (Figure 5).
Another issue to consider is that the market seems to be repeatedly second guessing the Fed this year, becoming temporarily convinced that a certain piece of macro data will surely be the one that leads the Fed to pull back. However, the Fed has disappointed the market continually this year on this front. It has actually been quite clear that it would continue to hike rates aggressively and have them remain high for an extended period even after signs that prices are easing, intending to completely crush inflation expectations. The Fed has already shown that is more than content to weather an economic slowdown and stock market plunge in its inflation fight. Until we see unemployment, which is still near four-decade lows, pick up dramatically, we expect the Fed will continue to maintain this stance, which could mean relatively high rates through most of 2023.
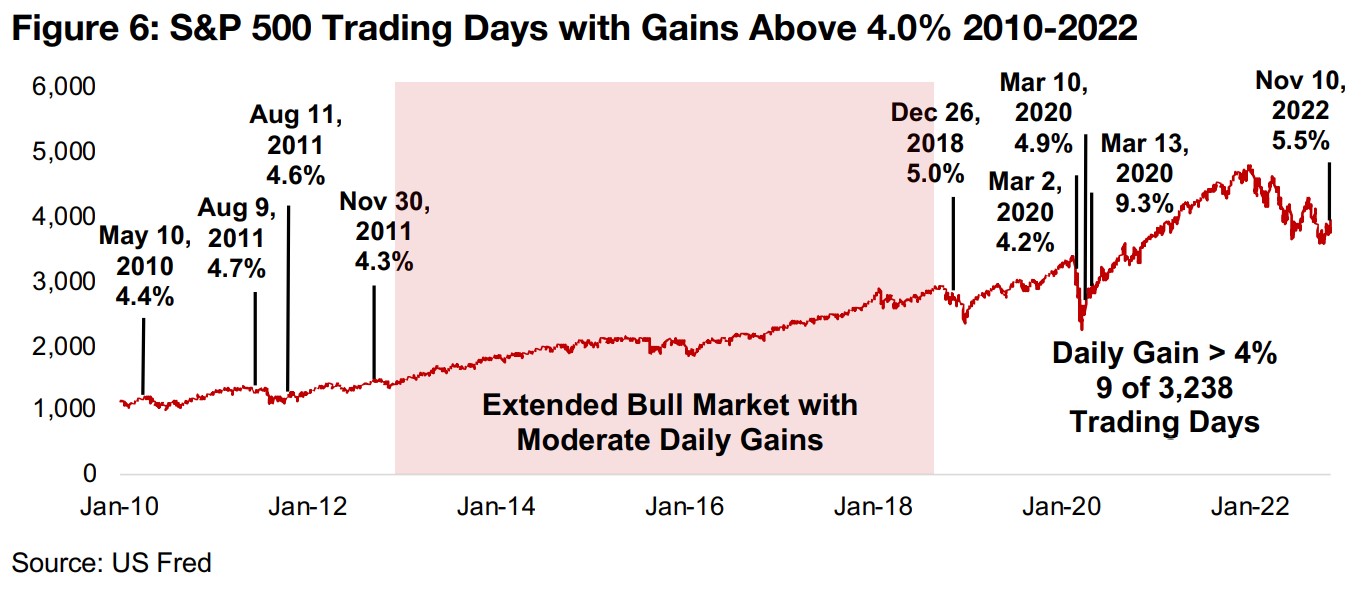
Nonetheless, even given all of the above issues, after such a difficult year for the stock markets, perhaps it should be a relief to see such a large gain in such a short time, indicating some life is coming back to markets. But actually, history shows that such a large daily gain is actually an indication of a weak, not strong market. In Figure 8, we show all the instances of over 4.0% daily gains in the S&P 500 from January 2010 to the present, showing just how rare such moves are, occurring on only nine out 3,238 trading days. It also shows how such moves tend to be clustered during weak markets, like in the 2010-2011 aftermath of the global financial crisis, in the late 2018 slowdown, and during the global health crisis-related slide in 2020. In the bull market from around 2013 to 2018, there are literally no such huge single day gains at all, suggesting that a health bull market is made of a steady ascension, not the manic-depressive swings which are more typical of bear markets.
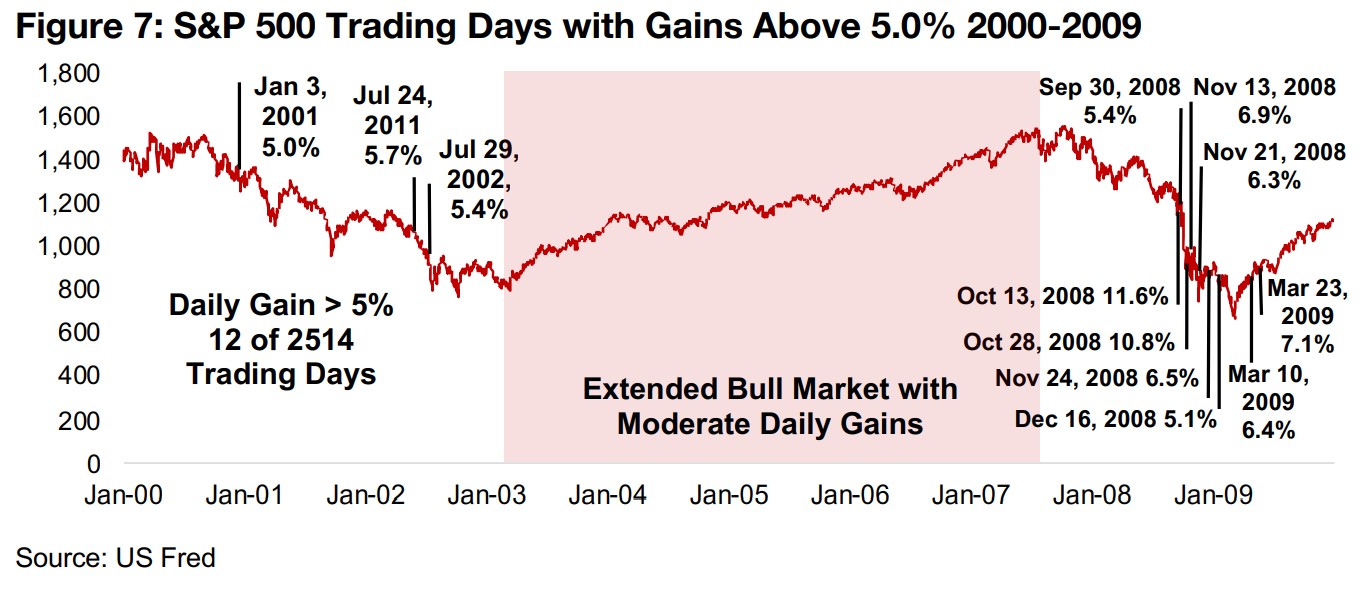
Going back another decade, we see a similar situation from 2000 to 2009, this time only taking gains above 5.0% on a single day to exclude the very large amount of large swing days that took place in the 2008-2009 market crash. All of the big single-day gains occurred either in the bear market from 2000 to 2002 or the crash of 2008- 2009, and absolutely none during the bull run from 2003 to 2007. All this data suggests that overall, the over 5.0% single day gain in the S&P 500 last week should be more of a cause for concern than for celebration, with Mr. Market just as likely to follow up this manic phase with some more depression.
For the gold price, the easing inflation could provide some relief, as it could reverse
recently less negative real US bond yields, which had been making bonds relatively
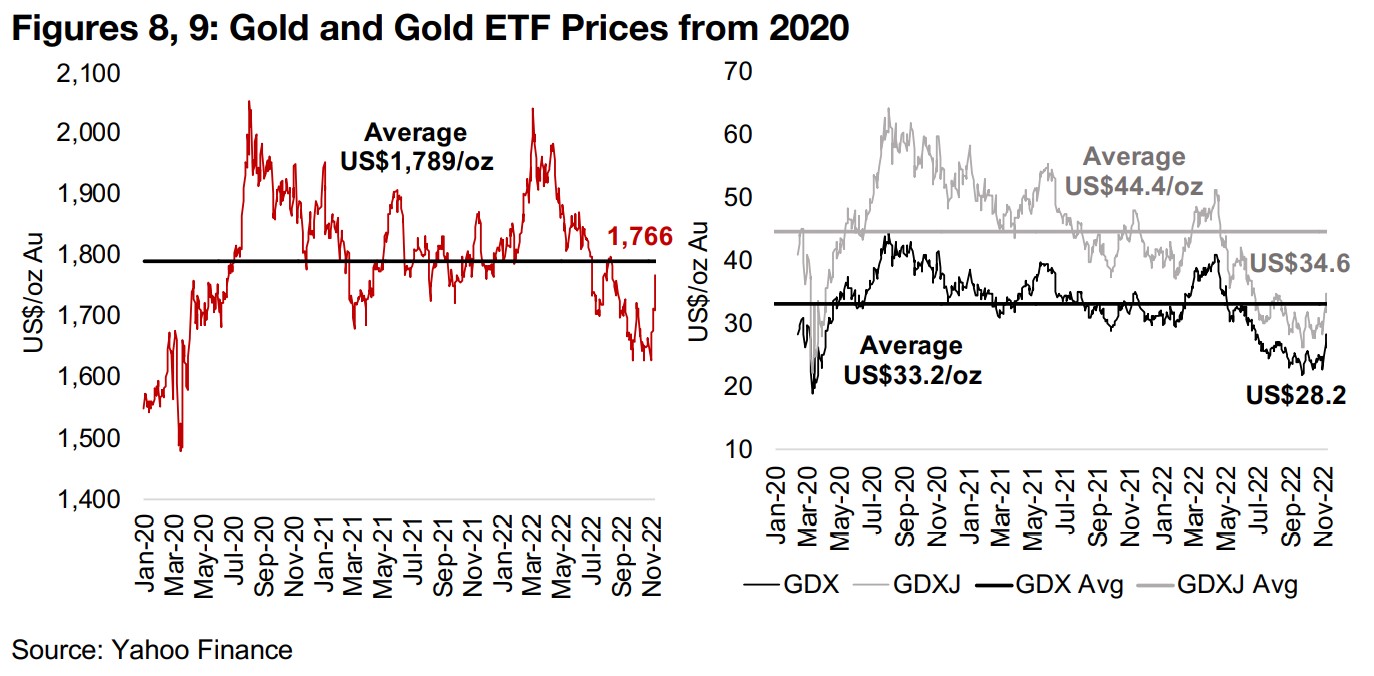
attractive versus bonds. However, the rip in gold this week has only just returned it
to its average of US$1,766/oz since 2020, and it is still considerably below its
US$1,804/oz average for 2022 (Figure 8). While with a continued slide in inflation gold
might actually see more of a respite that we were expecting for the rest of 2022, for
gold stocks we expect the pressure to continue, with the current interest rates already
high enough to perpetuate a bear market, and soon to get higher.
In contrast to gold, both the GDX and GDXJ ETFs, proxies for the producing and
junior mining sectors, respectively, are still well below their averages since 2020, as
the broader pressure on markets is hitting most stocks hard. While this has seen the
valuations of gold stocks certainly get much less expensive this year, we still expect
that we are more towards the middle of the bear market than the bottom. Therefore
more downside for gold stocks seems possible as the recent manic phase could fade.
We expect that strong bargains in the sector are more likely to be arising into 2023
than for the remainder of 2022.
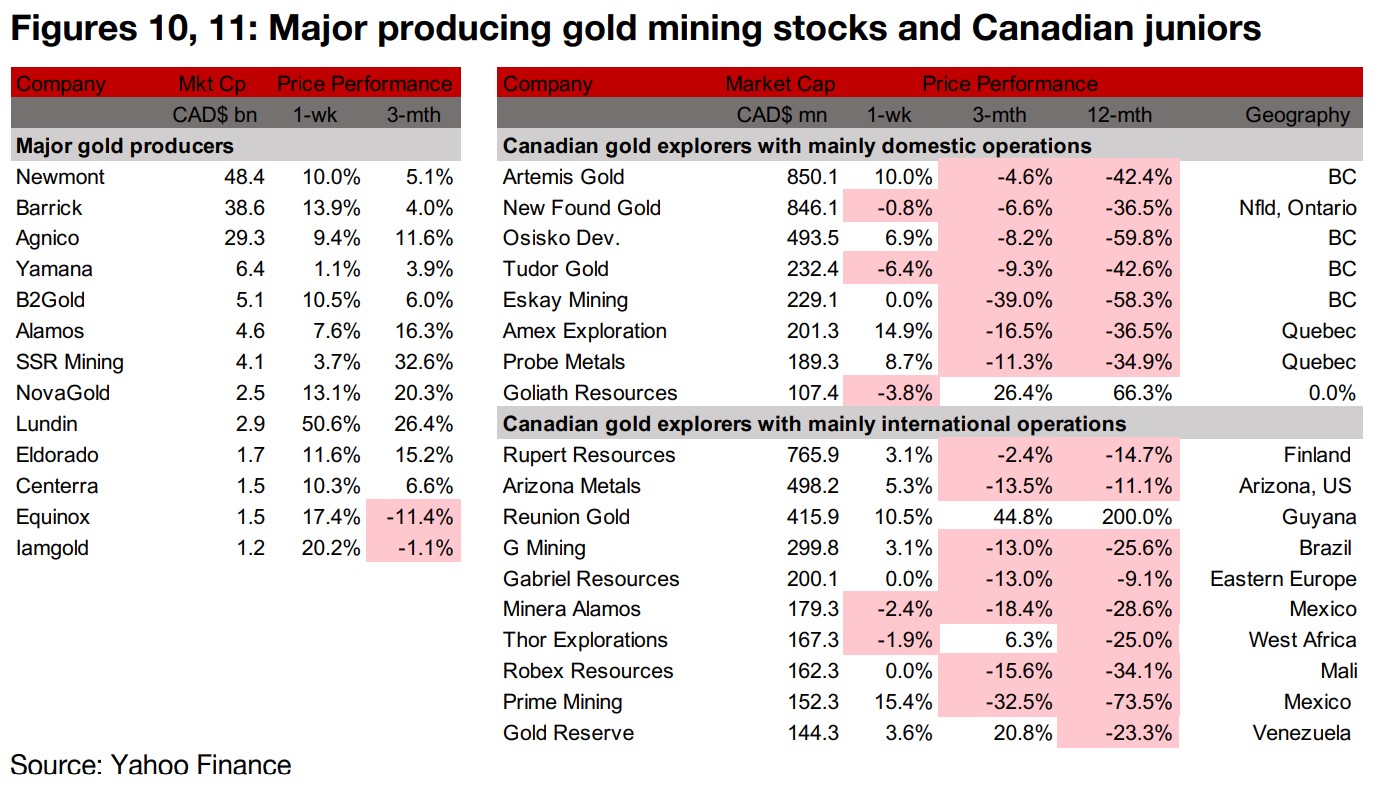
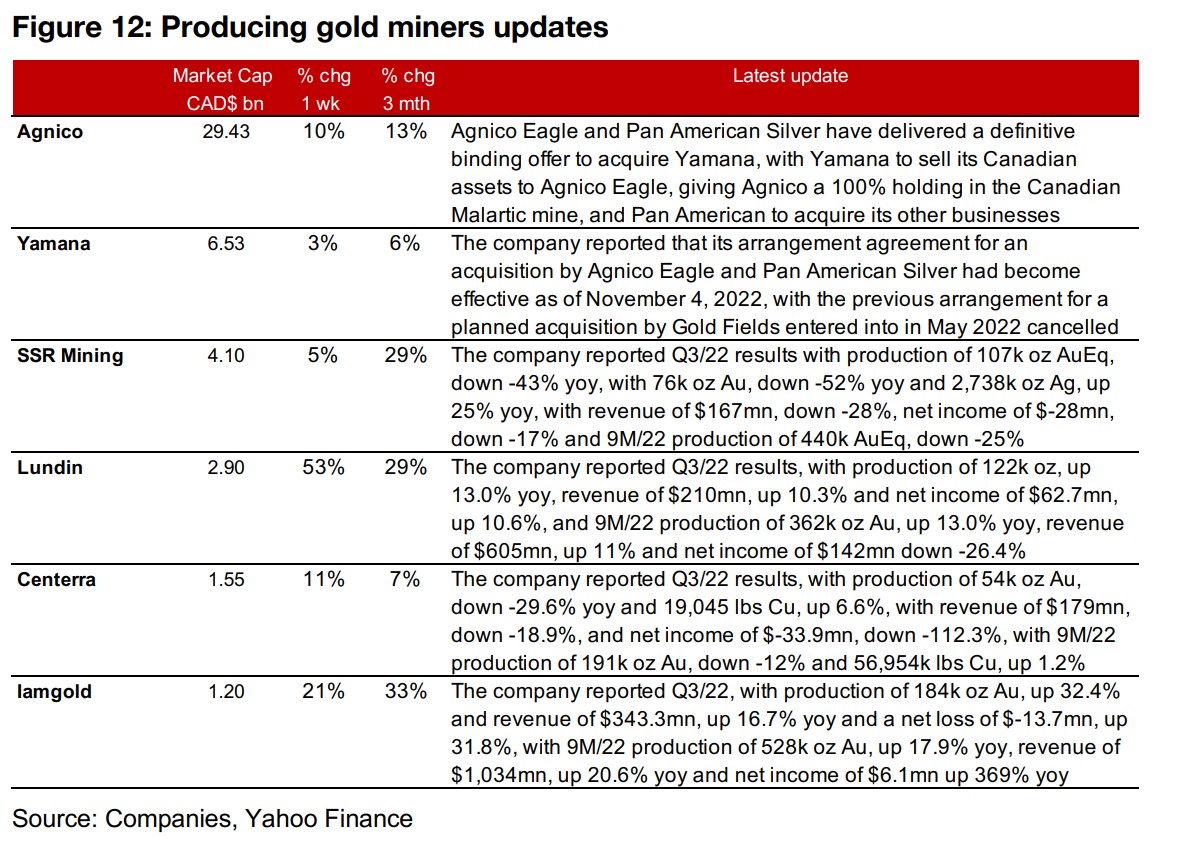
The producing gold miners all surged on the gold and market rip (Figure 10). The Q3/22 results season wrapped up with SSR Mining, Lundin Gold, Centerra Gold and Iamgold all reporting. The biggest news in the sector for the week was Yamana's announcement that the plan for its acquisition by Gold Fields would be cancelled, and that instead it would instead be acquired by both Pan American Silver and Agnico Eagle. Under the new acquisition plan Agnico Eagle would purchase Yamana's Canadian assets, giving it total control of the Canadian Malartic, which it had previously jointly owned with Yamana (Figure 12).
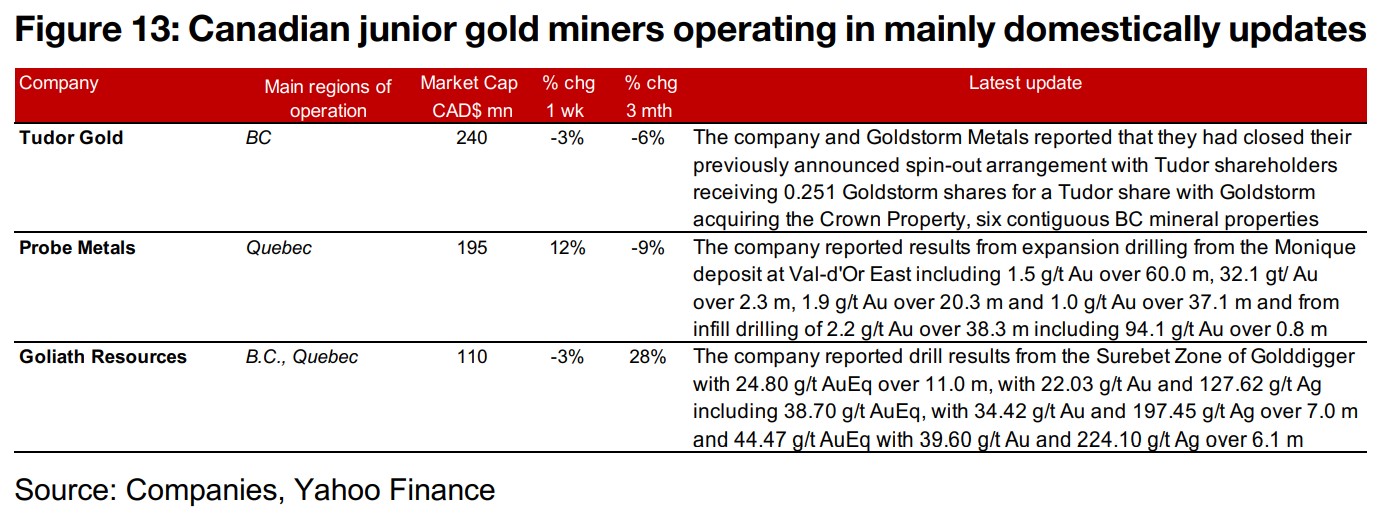
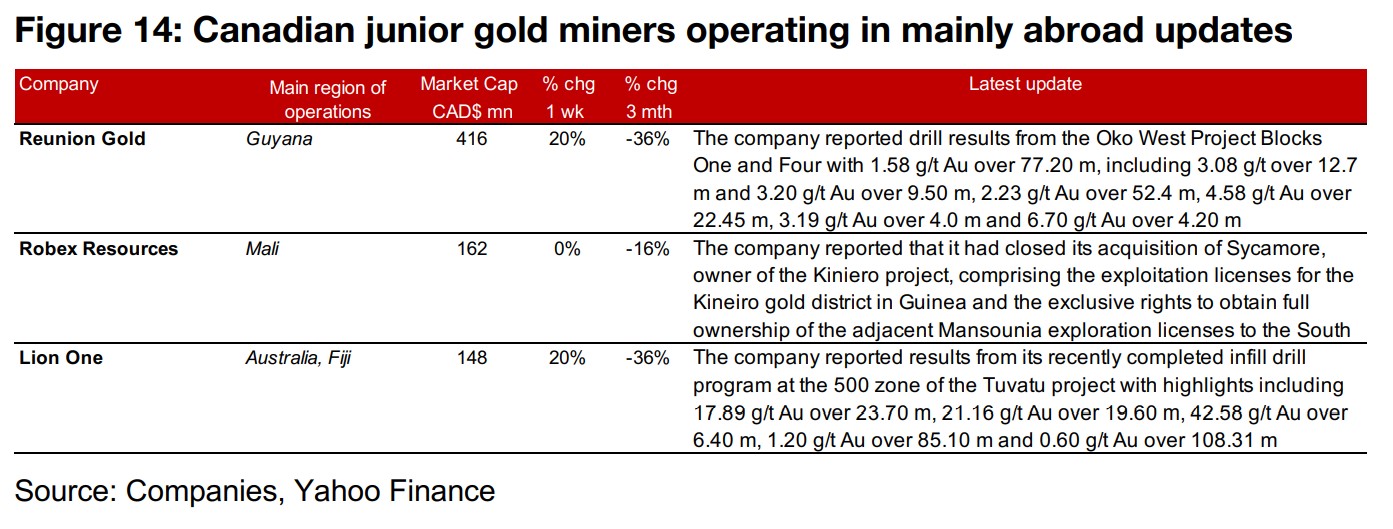
The larger cap TSXV gold stocks were mostly up on the surge in the gold price and stocks. For the Canadian juniors operating mainly domestically, Tudor reported that it had completed its sale of the Crown Property to Goldstorm, Probe Metals released drill results from the Monique deposit at Val-d'Or East and Goliath reported drill results from the Surebet zone of Golddigger (Figure 13). For the Canadian juniors operating mainly internationally, Reunion Gold reported drill results from the Oko West Blocks One and Four, Robex Resources completed its acquisition of Sycamore, which holds the Kiniero project, and Lion One reported drill results from the 500 Zone of the Tuvatu project (Figure 14).
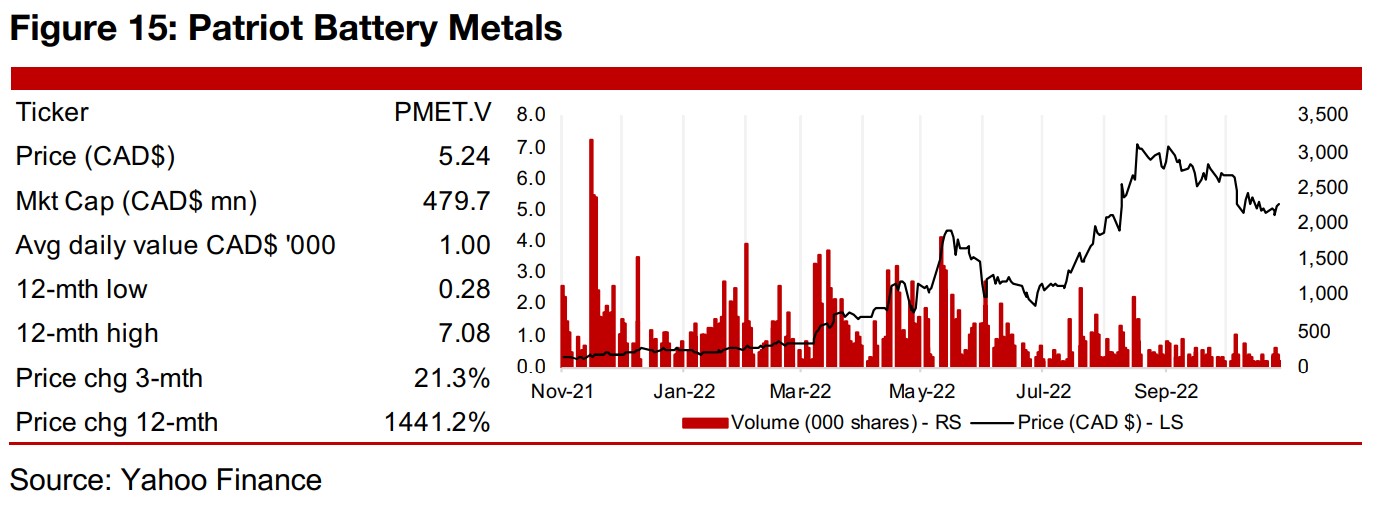
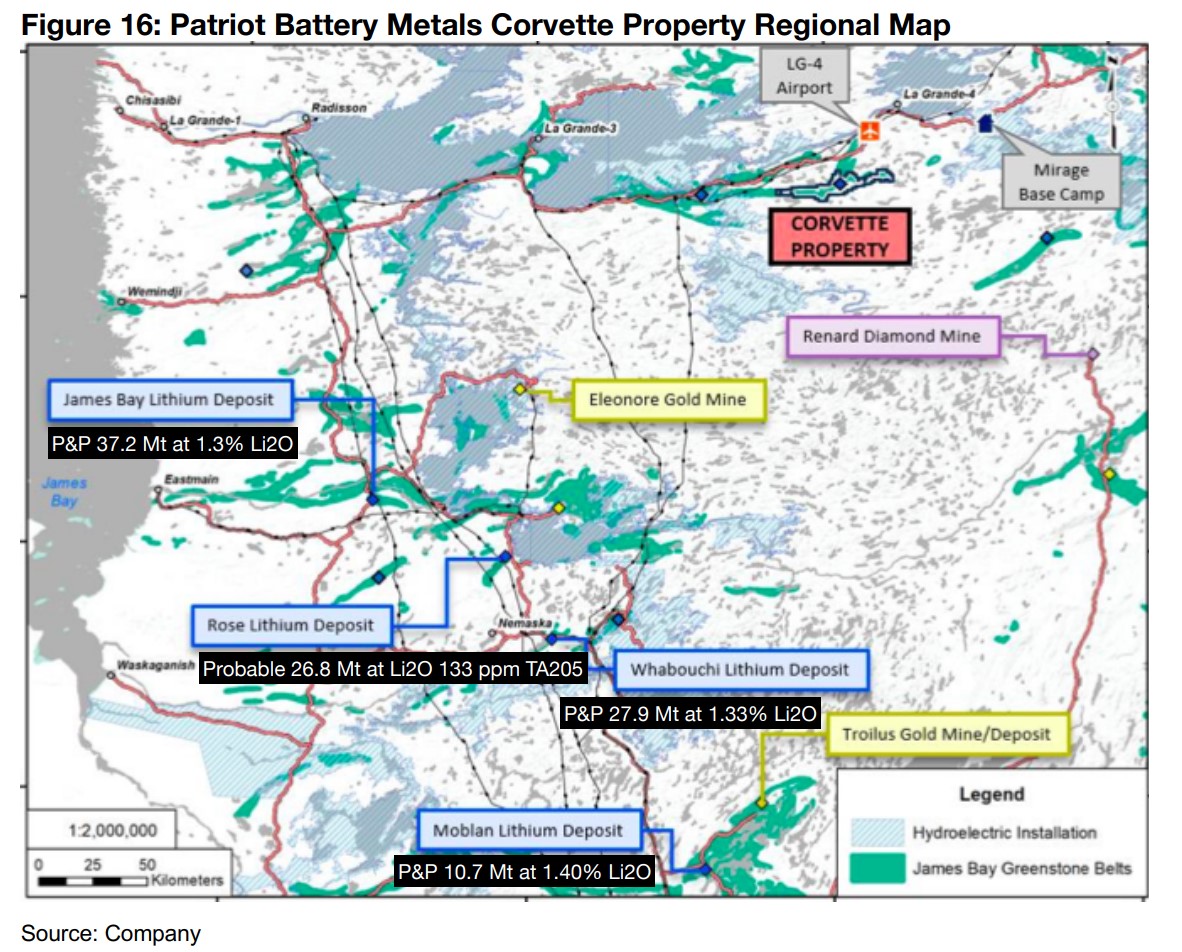
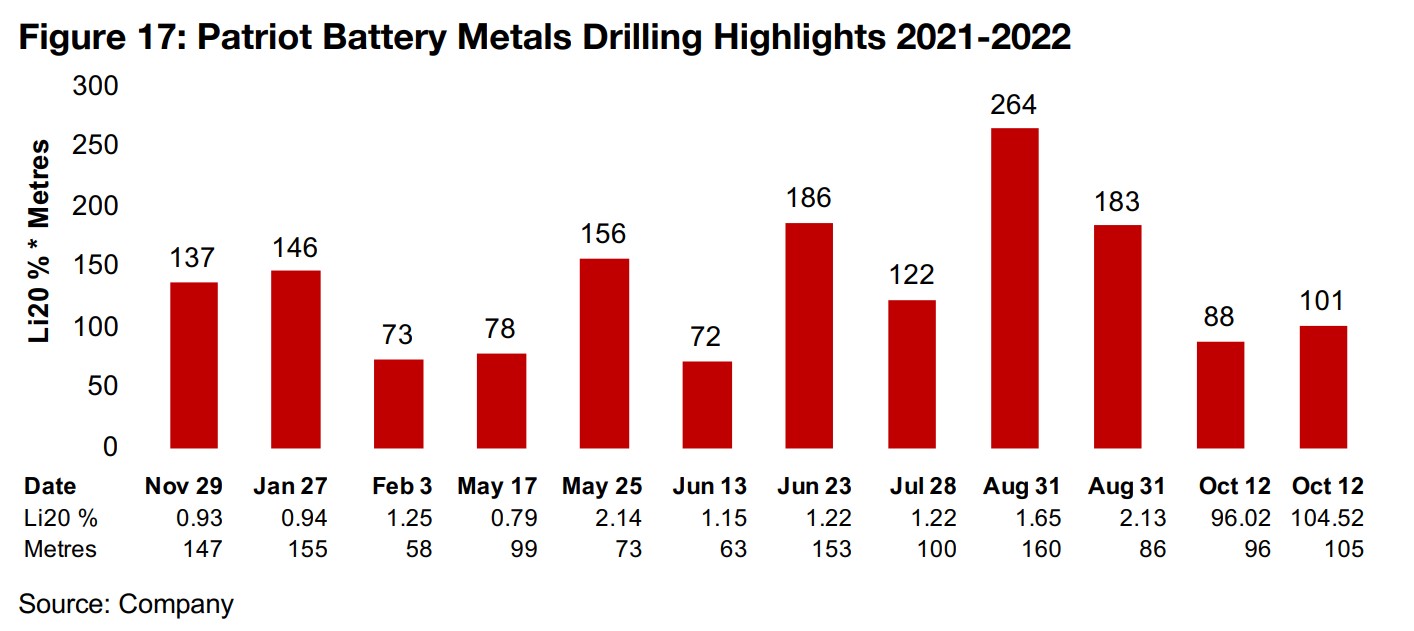
Patriot Battery Metals is exploring the Corvette project in Quebec, proximate to several lithium projects all with substantial reserves, including James Bay, Rose, Whabouchi and Mobium (Figure 16). The company has been driven by strong drilling results over most of 2022, with highlights including 1.22% Li2O over 153 m, for a Li20 x metres of 186 on June 23, 2022 and 1.65% Li20 over 160 m for a Li20 x metres of 264 on August 31, 2022 (Figure 17). The results have sent the company's share price soaring 1647% this year, far above the gains of the rest of the large cap TSXV lithium stocks (Figure 18), and seen its market cap rise over tenfold to CAD$447mn from CAD$41mn at the start of this year, becoming the fourth largest TSXV lithium stock by market cap (Figure 19).
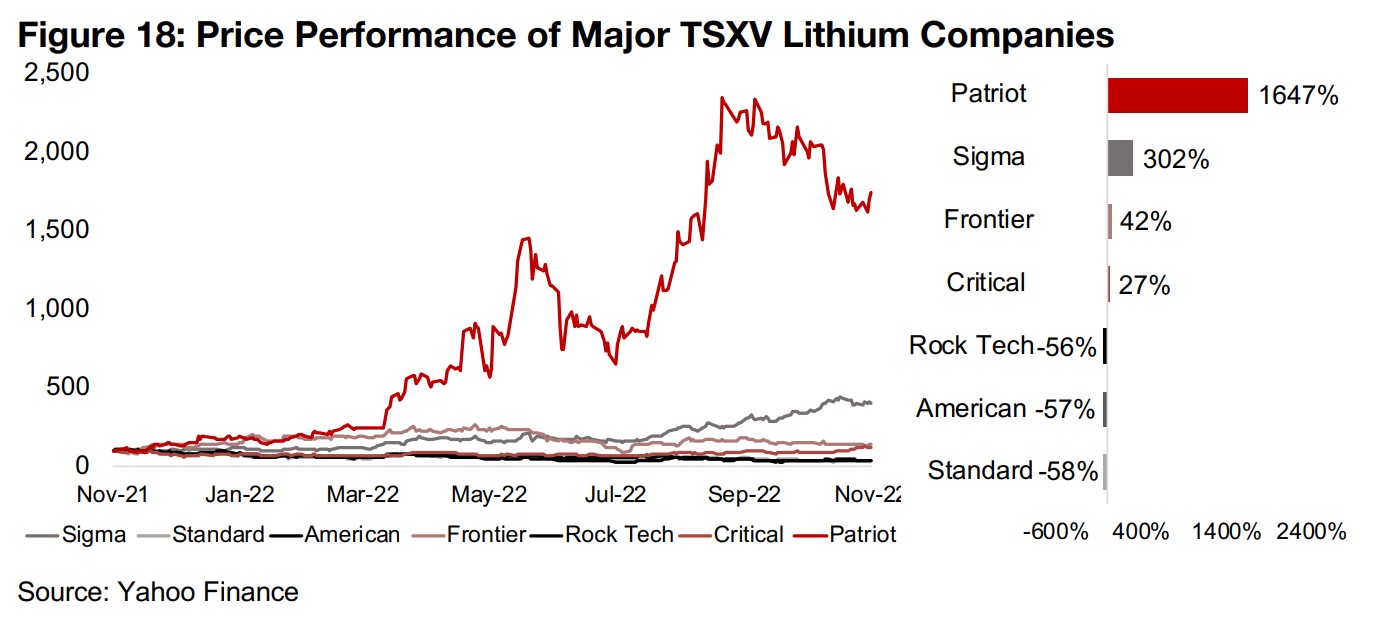
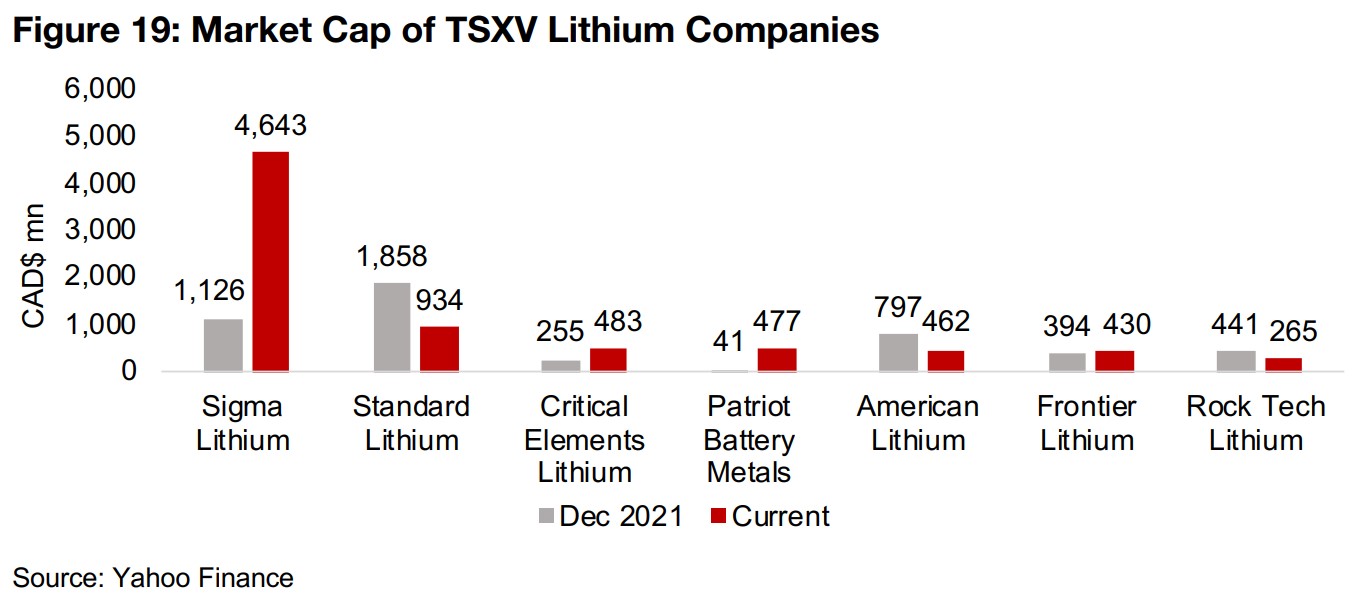
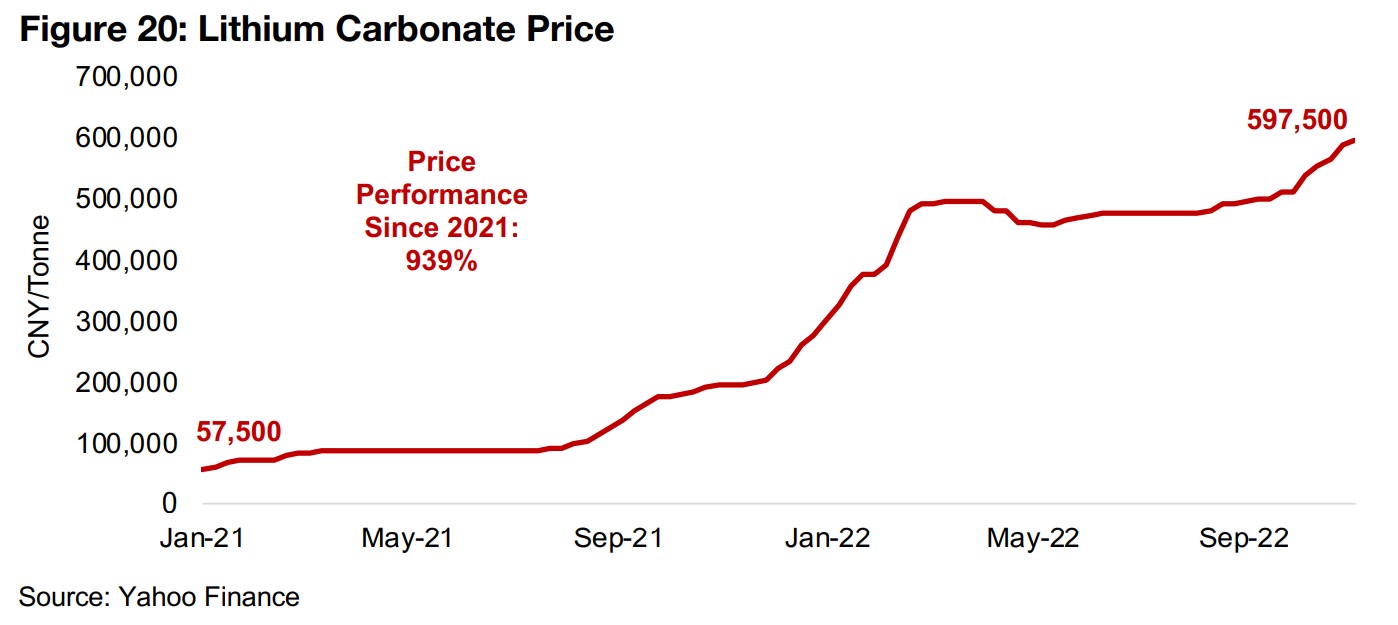
While it might be expected that the surging lithium price over the past year would have been a considerable driver for the stock, this rise seems to be more weighted towards the strong drill results (Figure 20). This is because several major TSXV lithium stocks including Rock Tech Lithium, American Lithium and Standard Lithium have all actually seen substantial declines over the past twelve months, even with the surge in the lithium price, showing that gains in the underlying metal have not been enough to drive up all of the larger cap TSXV lithium stocks this year.
Disclaimer: This report is for informational use only and should not be used an alternative to the financial and legal advice of a qualified professional in business planning and investment. We do not represent that forecasts in this report will lead to a specific outcome or result, and are not liable in the event of any business action taken in whole or in part as a result of the contents of this report.
Author
Ben McGregor authors the Weekly Roundup at CanadianMiningReport.com, providing sharp analysis of the metals and mining sector. With a talent for spotting trends, Ben distills complex market shifts into clear, engaging insights on TSXV junior miners. His weekly updates cover gold, copper, uranium, and more, blending data-driven perspectives with a knack for identifying opportunities. A vital resource for investors, Ben’s work navigates the dynamic junior mining landscape with precision.