
July 31, 2023
The gold price rose 1.7% to US$1,998/oz, nearly reaching the US$2,000/oz benchmark level for the first time in several months, even as the Fed raised interest rates, with the market apparently expecting this to be the last hike of this cycle.
This week we look at the earnings of largest global mining companies, which in 2023 are expected to continue a moderation that started in 2022, while valuations remain at inexpensive levels, having moved up to around their 20-year averages.
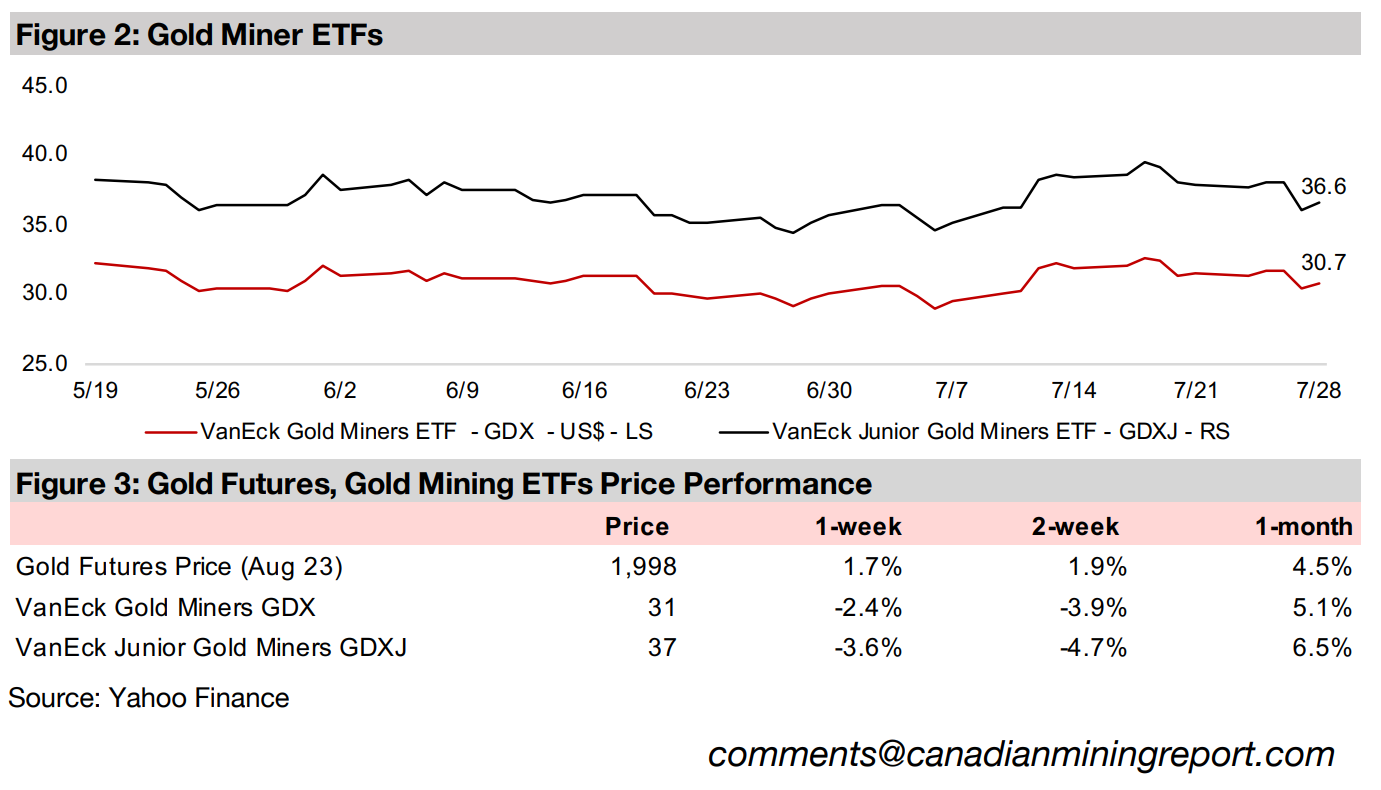
The gold stocks declined with the GDX down -2.4% and GDXJ losing -3.6% even given the support of both a rising gold price and a gain in small cap equity, with the Russell 2000 up 1.4%, while the large TSXV gold stocks were mixed.


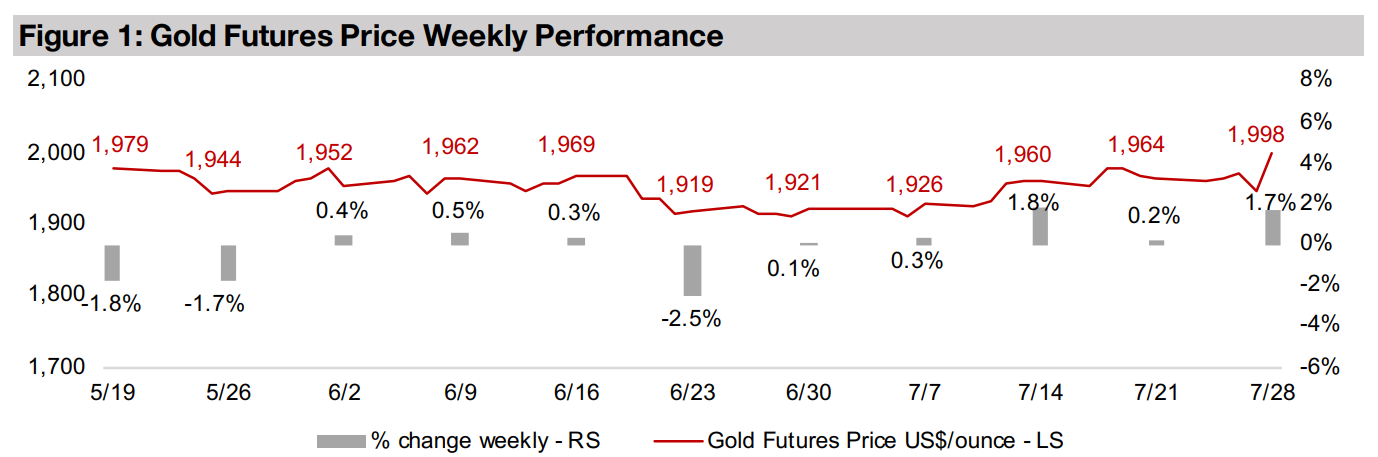
Gold increased 1.7% this week to US$1,998/oz, just on the verge of the key
US$2,000/oz benchmark, with a gain of nearly 2.0% for the second time in three
weeks. This came even as the US Federal Reserve hiked its base rate 25 bps, which
might have been thought to draw funds away from gold and into bonds given their
rising yields. However, the market seemed instead to be looking well beyond this hike,
believing that it could be last in this cycle, and anticipating rate declines to start by
next year, with a return to looser monetary policy expected to boost gold.
The rise in gold failed to boost gold stocks, with the GDX and GDXJ down -2.4% and
-3.6%, respectively, even as the Russell 2000 small cap index rose 1.4%. This
provided a mixed message on the sector, as while there have been periods over the
past year where gold gained but gold stocks declined, this was usually because the
gain in the metal was marginal, or a broader small cap sell off also hit gold stocks. A
gold jump of nearly 2.0% accompanied by a big slide in gold stocks has been rare.
It could partly be explained by what we view as irrational exuberance in the stock market overall. The market this week might have simply been viewing safe havens like gold stocks as uninteresting given the continued push into higher risk stocks. However, with valuations and interest rates extremely high and global yield curves back to their most heavily inverted in decades, the continued rise in the markets looks increasingly precarious. The US Effective Federal Funds Rate has risen sixty-six times in just a year and a half to 5.33% following the hike this week from 0.08% in December 2021 (Figure 4). Prior to the past year, rates have mainly been near zero since 2009, barring a brief rise towards 2.5% in 2017 and 2018.
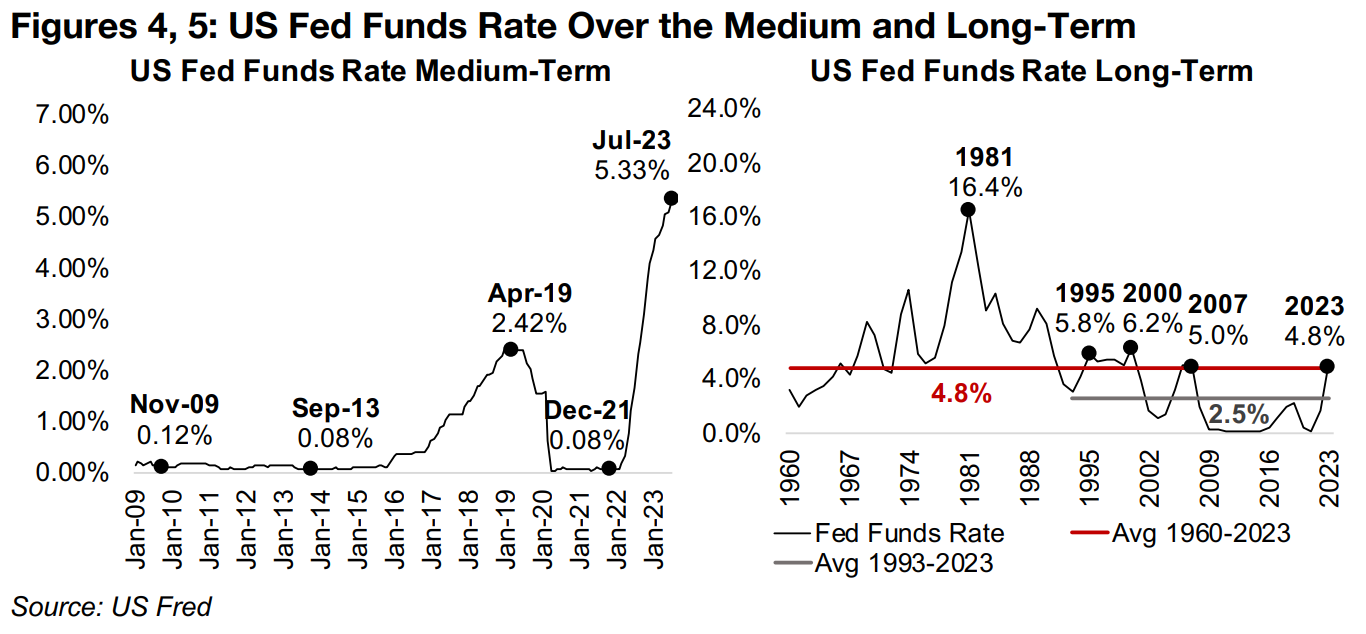
The Fed Funds Rate also looks very high in a long-term context, averaging 4.8% so
far this year, nearing the previous highs of the past three decades, at 5.0% in 2007,
6.2% in 2000 and 5.8% in 1995 (Figure 5). While the average rate so far this year
exactly matches the average Fed Funds Rate since 1960, this includes the spike in
the 1970s and early 1980s; if we only look at looking at the last thirty years since rates
have moderated, the US Fed Funds rate is nearly two times the 2.5% average.
It seems unlikely that such a huge and rapid change in rates to well above what the
economy has been used to over three decades will not eventually drive severe fallout.
While so far this has been limited to a brief banking crisis in March 2023, we anticipate
more disruption to come. This could continue to support gold, and potentially junior
gold stocks, assuming the upward driver of the gold price can offset any downward
pressure on small cap equities overall during a strong downturn.
Much of the market's exuberance this year has been driven by the major decline in headline inflation, with the CPI plummeting from an 8.9% peak in June 2022 to just 3.1% in June 2023 (Figure 6). Much of this has been driven by a decline in energy prices, with the brent crude oil price falling from a peak of US$123/bbl in May 2022 to US$73/bbl as of May 2023, and the US gasoline price declining from a May 2022 peak of US$3.92/gallon to a low of US$2.37/gallon in September 2022 (Figure 7).
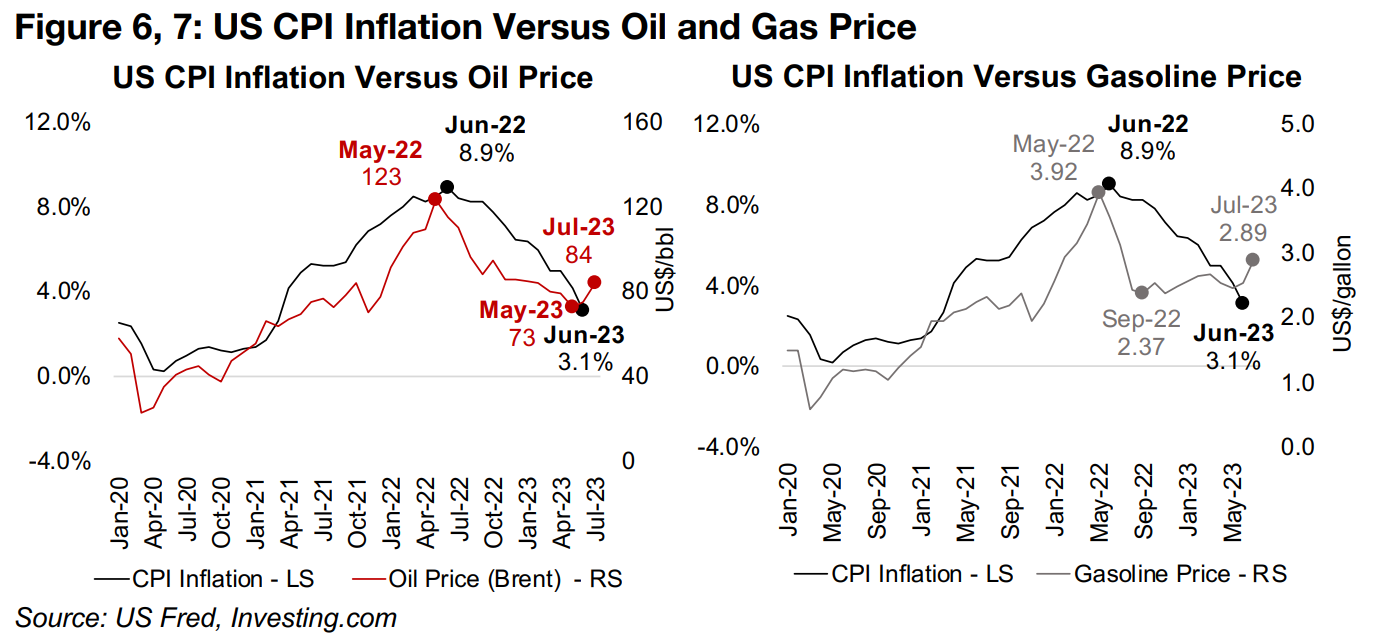
However, the oil and gasoline prices have picked up substantially over the past two
months, to US$84/bbl, and US$2.89/gallon, respectively, as of July 2023. This
suggests that the headline inflation could have risen substantially in July for the first
time in over a year. While the Fed focuses on core inflation, excluding energy and
food prices, such a rise might not necessarily have such a major effect on its outlook,
but an increase in headline inflation could still be enough to spook the markets.
However, core inflation has also persisted at relatively high levels, with the most
recent reading at 4.9% as of June 2023, only a moderate decline from a peak of 6.6%
in September 2022. This leaves it well above the Fed's 2.0% target, and implying that
even if rates have peaked, they will be held at this level for an extended period. So it
appears that the economy may be still far from out of woods on both headline and
core inflation, and that the equity market may be overweighting a bullish scenario.
The potential for a sudden reversal in this sentiment remains high in our view, should
another economic shock similar to March 2023 arise, which we expect would be
supportive of the gold price, driving a slight to safety.
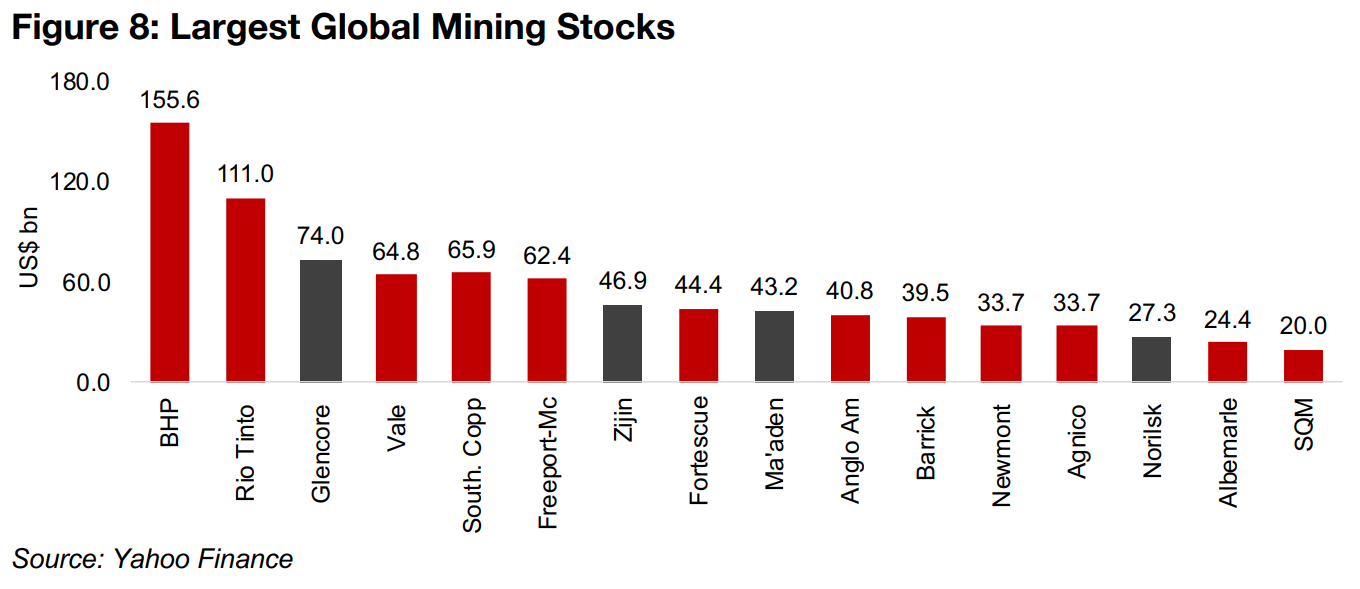
This week we look the recent earnings trends for largest market capitalization global mining stocks in the context of their long-term history, including BHP, Glencore, Vale, Southern Copper, Freeport McMoran, Fortescue Metals, Anglo American, Barrick Gold, Newmont, Agnico Eagle Mines, Albermale and SQM (Sociedad Quimaca y Minera) (Figure 8). Glencore has not been included in the long-term aggregates as it was only listed in 2011, but is included in the individual company charts, while Ma'adden (Saudi Arabian Mining), Zijin Mining and Norilsk Nickel have been excluded from both the aggregates and individual company charts given a lack of data.
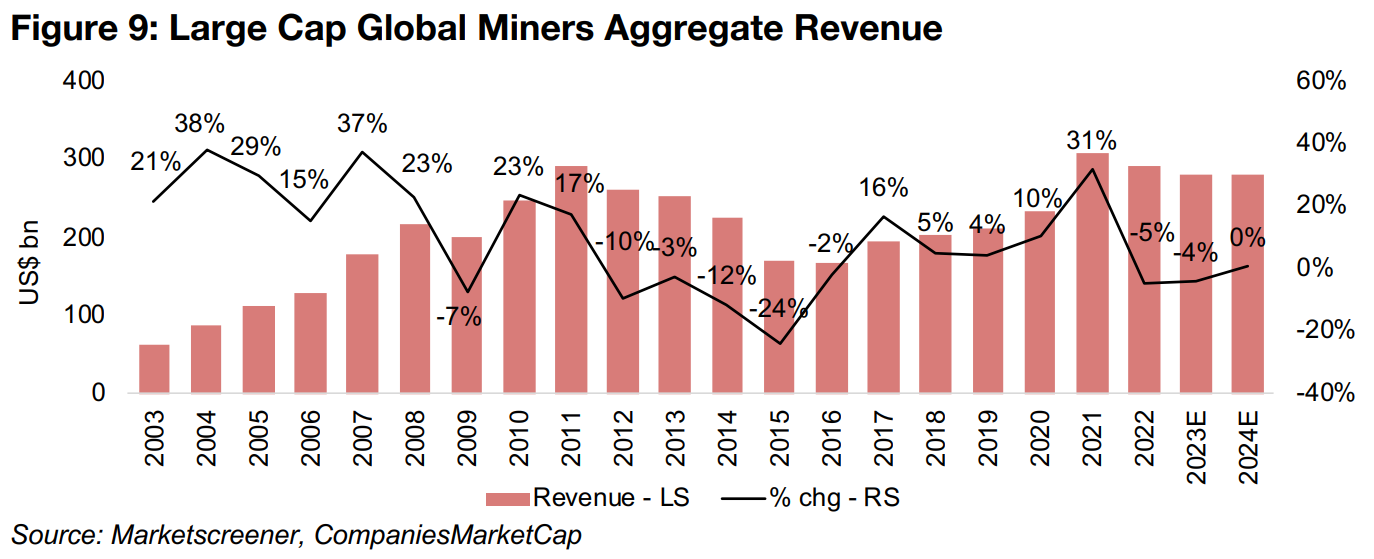
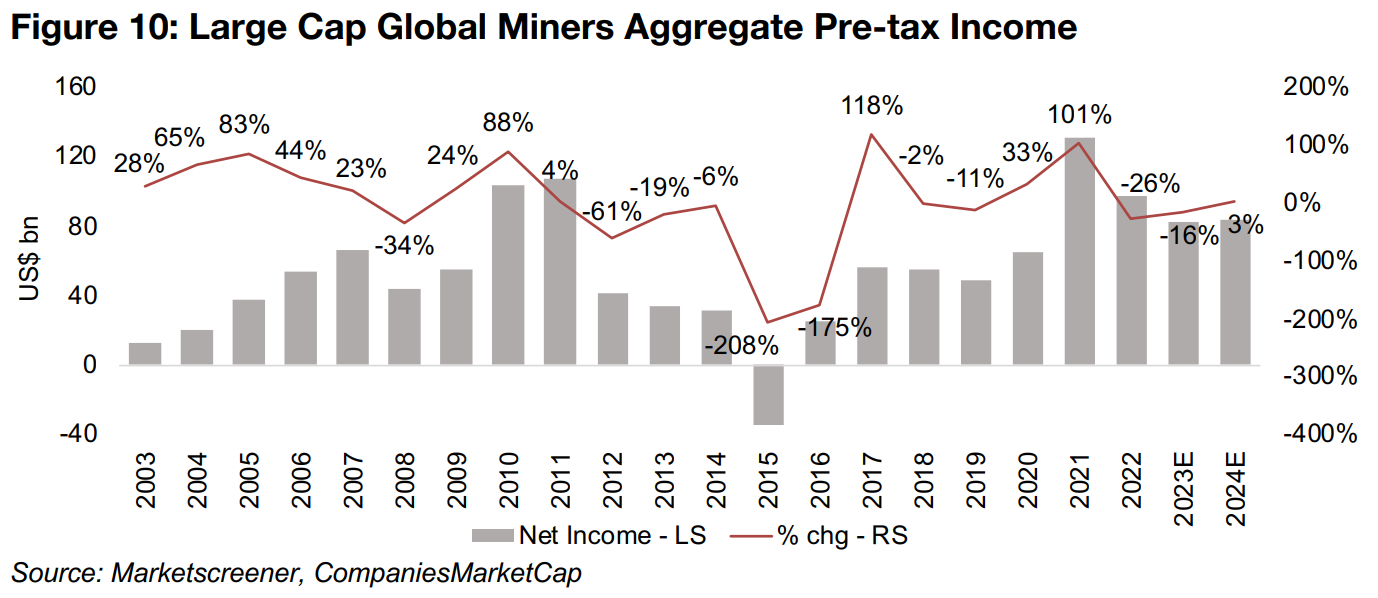
The aggregate revenue of the majors based on consensus forecasts is expected to slow for a second year, by -4% in 2023E after a -5% drop in 2022, down from a 31% surge in 2021 and 10% gain in 2020 (Figure 9). While this slowdown is moderate compared to the 2013 to 2016 bear market, the growth looks anemic compared to the 2003 to 2008 bull market. The revenue decline is expected to flow through to the bottomline, with pre-tax income dropping -16% in 2023E, less severe than the -26% slide in 2022, but well off the 33% and 100% growth of 2020 and 2021 (Figure 10). Again, this rate of decline is moderate compared to the extreme losses in the last bear market, with a -208% decline in 2015 and -175% decline in 2016.
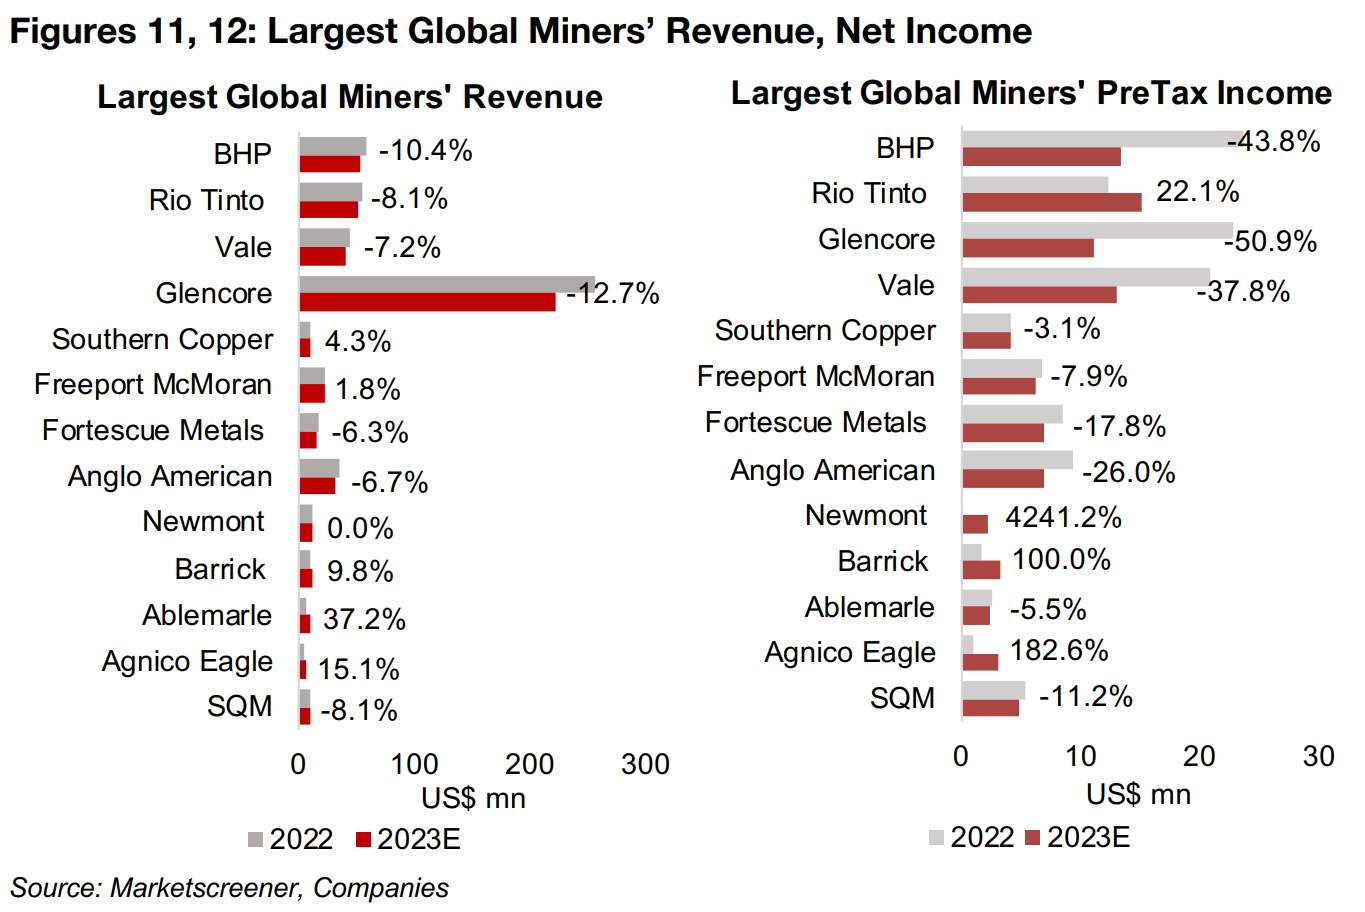
The revenue decline is expected to be driven mainly by the largest cap stocks, with
BHP, Rio Tinto, Vale, and Glencore down -10.4%, -8.1%, -7.2% and -12.7%,
respectively, with the weighting of Glencore especially high given by far the largest
revenue of the group (Figure 11). The companies forecast to boost revenue in 2023
are Southern Copper, up 4.3% and gold producers Barrick and Agnico Eagle, up 9.8%
and 15.1%, with the highest growth from lithium producer Albemarle, up 37.2%.
The giants BHP, Glencore and Vale are also the main drivers of the expected pre-tax
income decline, with a drop of -43.8%, -50.9% and -37.8% for 2023E, although this
is to be somewhat offset by a 22.1% gain from Rio Tinto (Figure 12). The biggest
gains in net income are forecast from the three largest gold producers, Newmont, up
4,241% because of a very low net income in 2022 mainly on extraordinary items, with
Barrick and Agnico Eagle estimated to rise 100% and 182.6%, respectively.
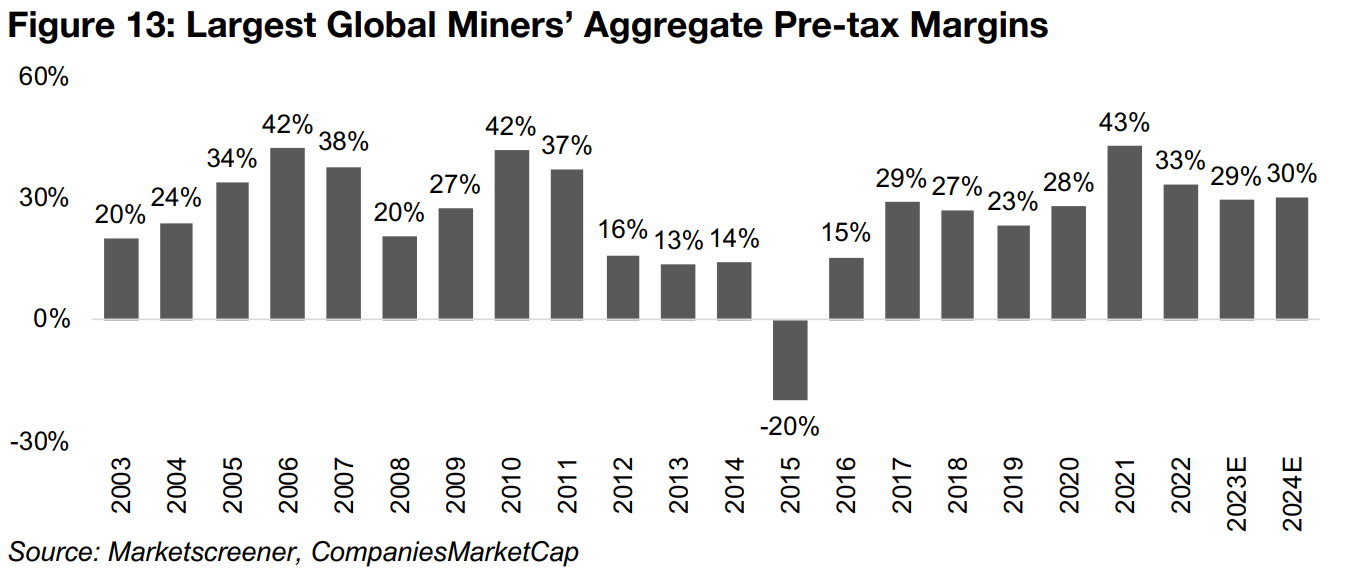
The average pre-tax margin for the group is expected to remain reasonably strong, at 29% in 2023E, and while down from 33% in 2022 and 43% in 2021, the latter was exceptional, at the highest level for the group in twenty years, with the previous peaks at 42% in 2006 and 2010 (Figure 13). The expected margin for 2023 is around twice the level of the margins that held during the 2012 to 2016 mining sector bear market.
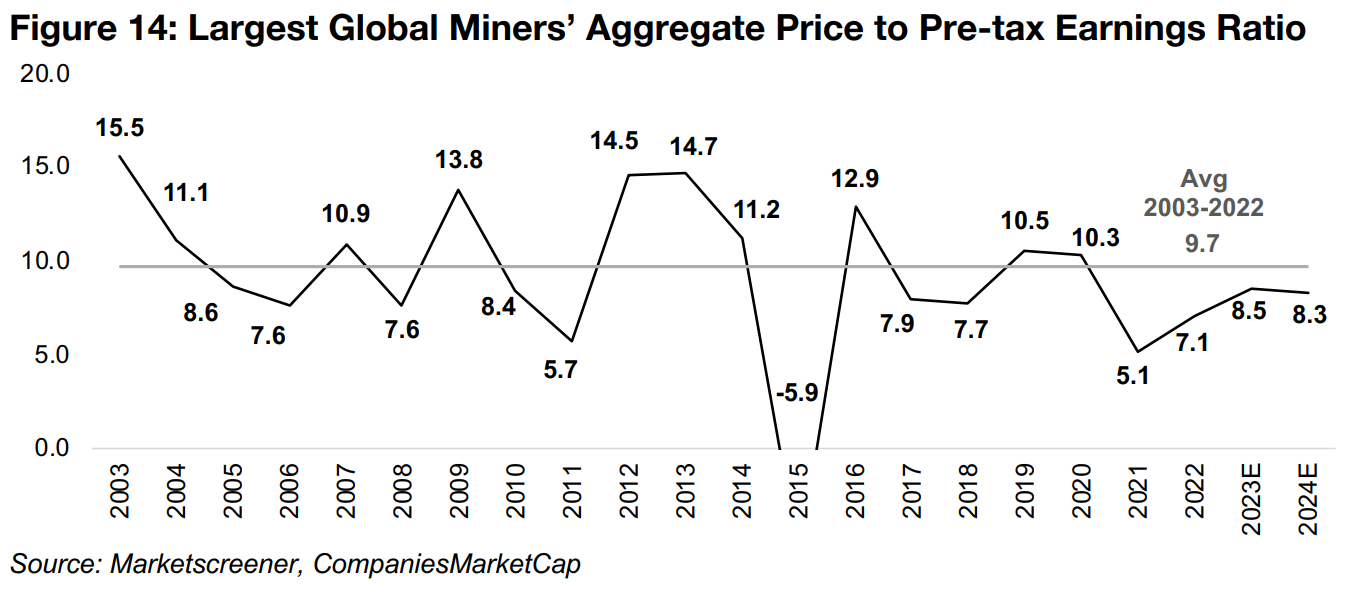
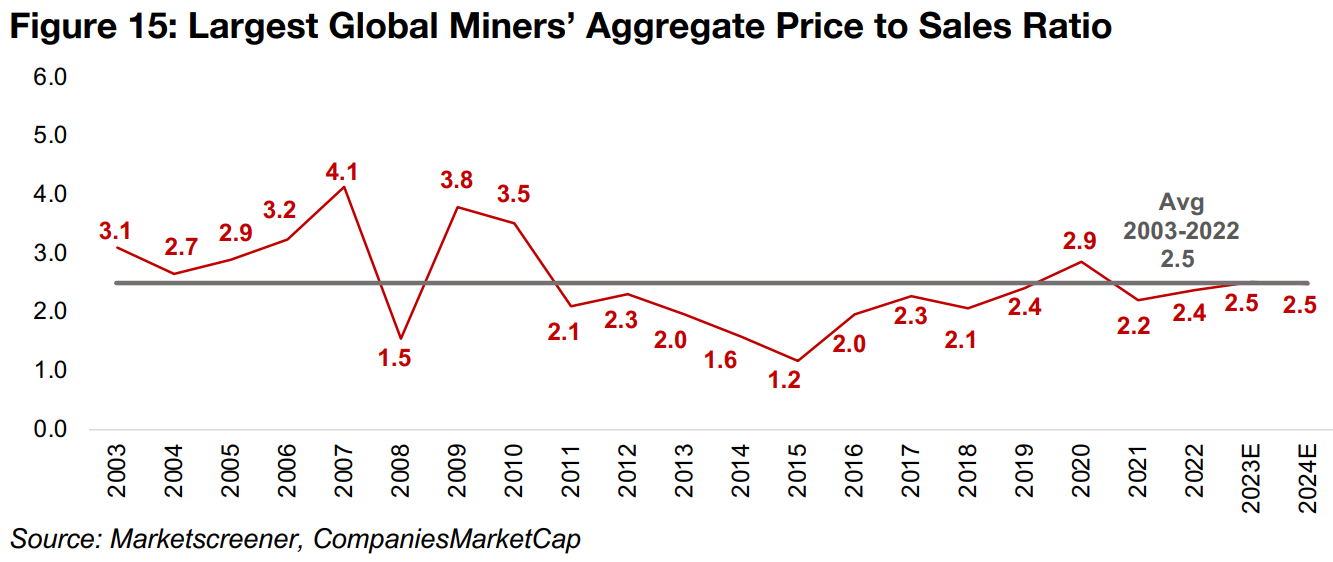
The sector's pretax earnings multiples have picked up from recent lows of 5.1x in 2021 to 8.5x for 2023E, moderately below the twenty-year sector average of 9.7x, well off two-decade highs at 14.0-15.0x, and a bit above the 7.9x and 7.7x multiples in 2017 and 2018 at the end of the previous bear market (Figure 14). The average price to sales ratio for the large caps, at 2.5x for 2023E, has converged to the long-term average. This is up from recent lows of 2.2x in 2021, and twice the 1.2x bear market trough in 2015, but far below the twenty-year high at 4.1x in 2007 (Figure 15).
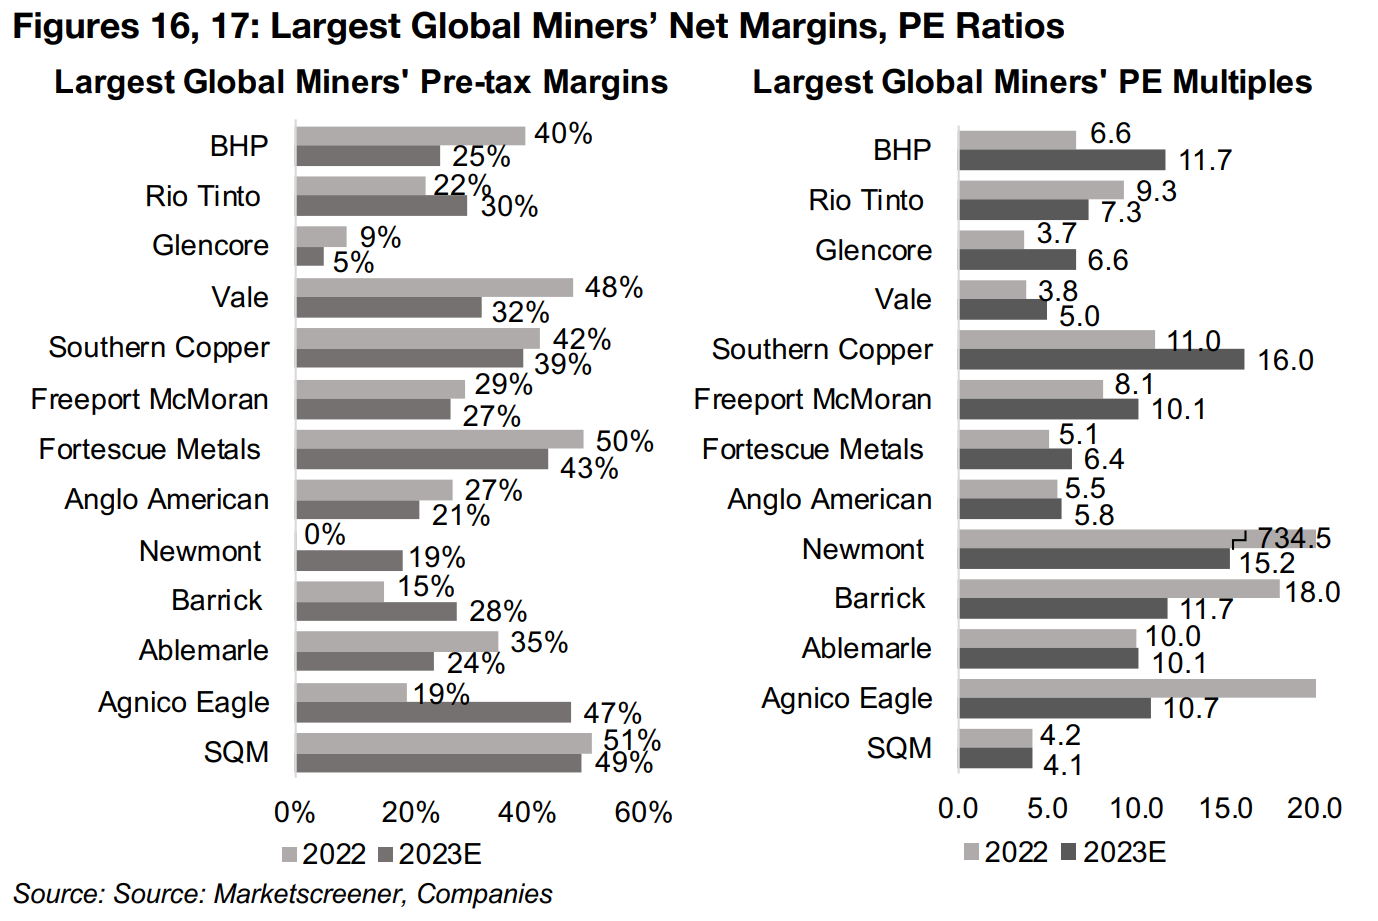
The margins vary widely among the large caps, with Glencore standing out for a low of 9% in 2022 and 5% in 2023E, and the rest ranging from 19% to 50% (Figure 16). Pre-tax income multiples also range considerably across the group, with BHP, Southern Copper and Freeport McMoran high among the largest stocks for 2023E, at 11.7x, 16.0x and 10.1x, respectively, and Rio Tinto, Glencore, and Vale relatively low at 7.3x, 6.6x and 5.0x (Figure 17). For the smaller caps, gold producers Barrick and Newmont have the highest 2023E multiples, at 15.2x and 11.7x, respectively.
Overall, the numbers show industry revenue and earnings continuing to moderate after the big rebound in 2020 and 2021. While certainly not as inexpensive as in 2021, multiples still remain reasonable, at just below long-term averages on a pre-tax income basis and exactly at the average in terms of revenue multiples.
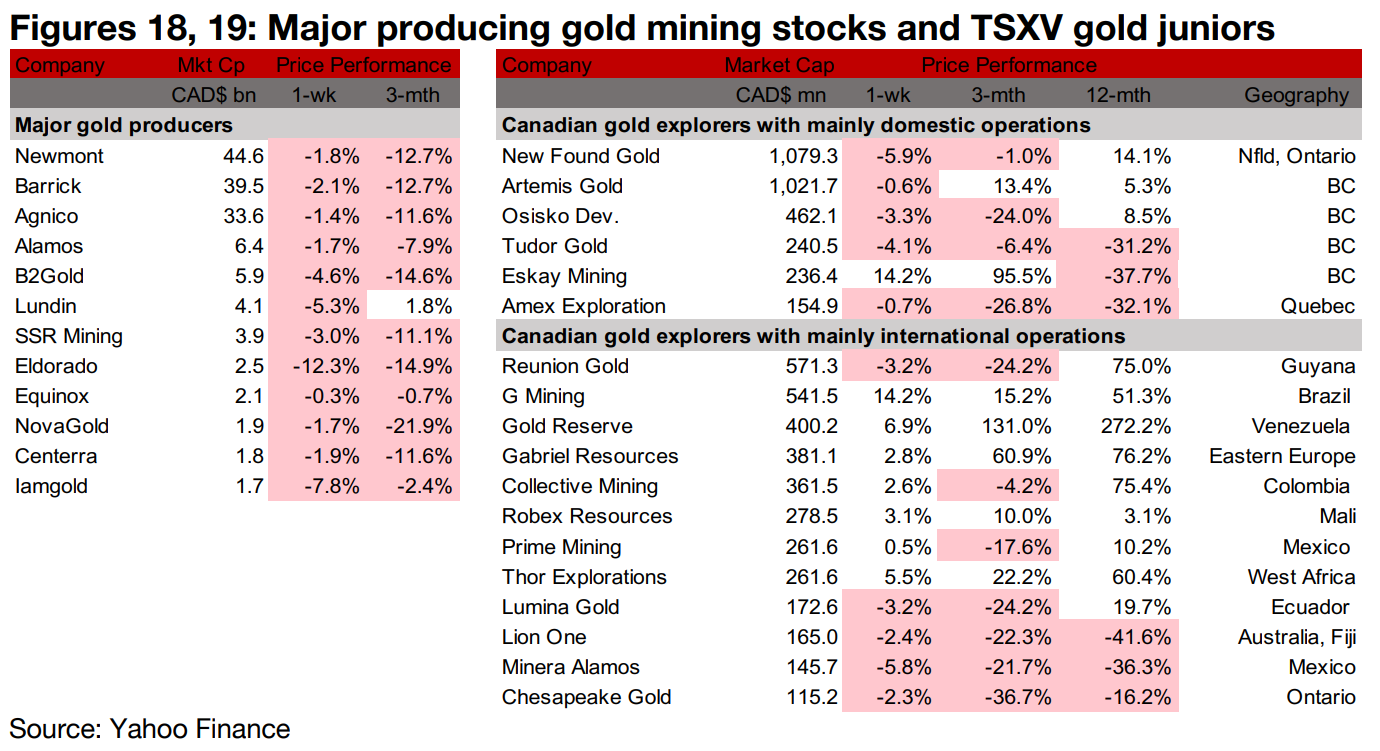
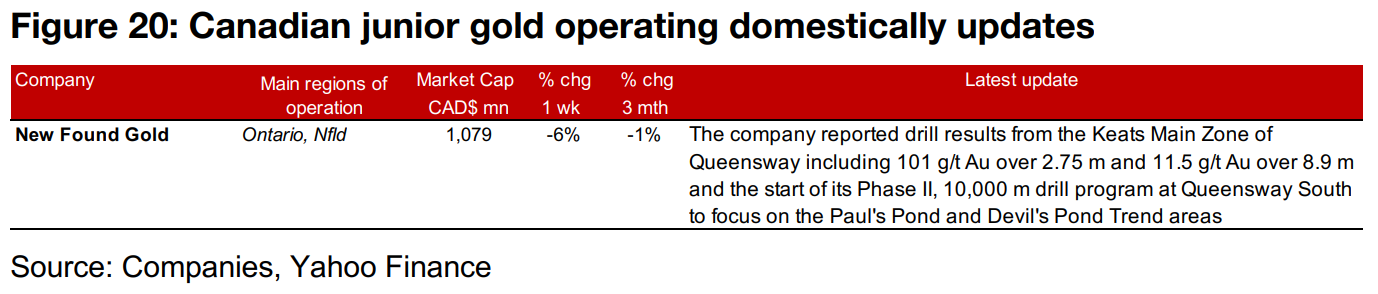
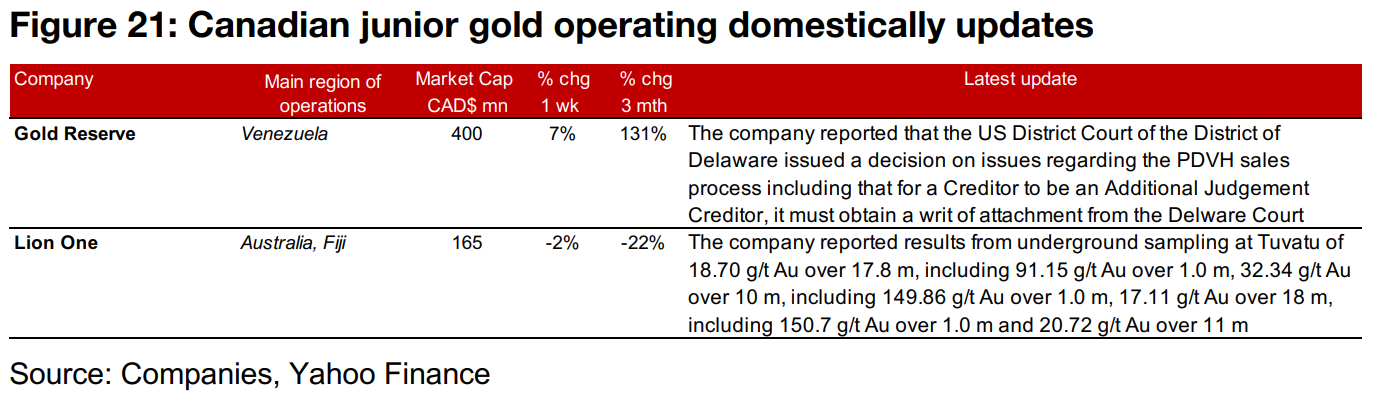
The large gold producers all declined and the large TSXV gold stocks were mixed (Figures 18, 19). For the TSXV gold companies operating domestically, New Found Gold reported drill results from the Keats Main Zone of Queensway (Figure 20), and for those operating internationally, Gold Reserve reported on a court ruling and Lion One announced underground sampling results from Tuvatu (Figure 21).
Disclaimer: This report is for informational use only and should not be used an alternative to the financial and legal advice of a qualified professional in business planning and investment. We do not represent that forecasts in this report will lead to a specific outcome or result, and are not liable in the event of any business action taken in whole or in part as a result of the contents of this report.
Author
Ben McGregor authors the Weekly Roundup at CanadianMiningReport.com, providing sharp analysis of the metals and mining sector. With a talent for spotting trends, Ben distills complex market shifts into clear, engaging insights on TSXV junior miners. His weekly updates cover gold, copper, uranium, and more, blending data-driven perspectives with a knack for identifying opportunities. A vital resource for investors, Ben’s work navigates the dynamic junior mining landscape with precision.