
November 27, 2020
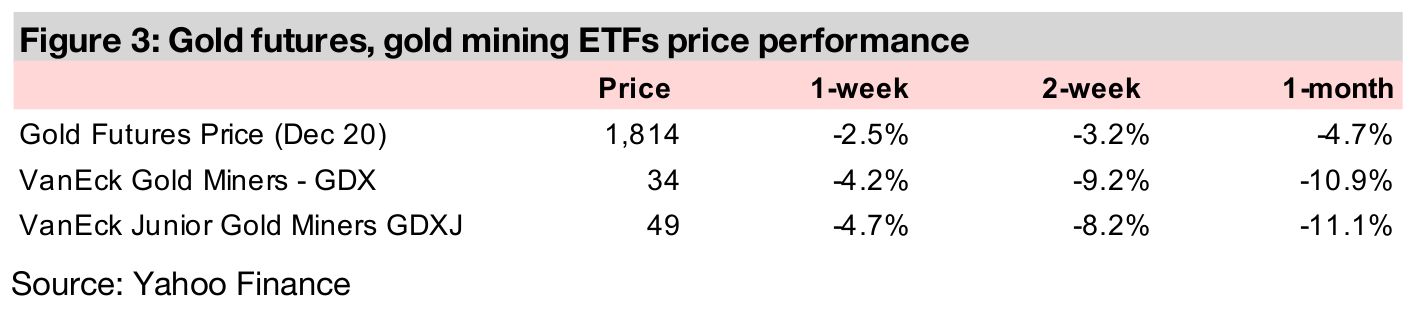
While gold declined -2.5% this week to US$1,814/oz, and is down -6.9% off recent highs of US$1,950/oz in early November, it is still well and firmly in a bull market, and the market consensus is still targeting an average above US$2,000/oz for 2021.
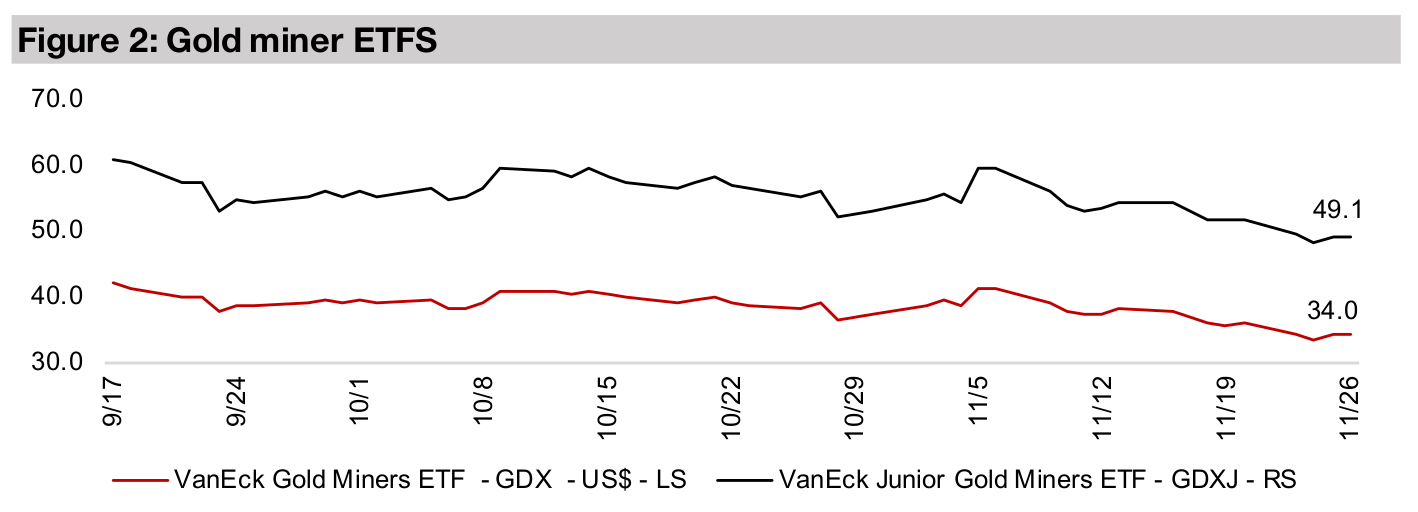
While most large global gold producers declined this week, and the GDX was down -4.2%, the sector's fundamentals remain strong, with an average gold price of US$1,762/oz YTD for 2020, versus just US$1,392 in 2019 and US$1,268 in 2018.
This week we look at the jump in the Canadian junior gold mining sector's cash and opex, and Great Bear Resources (GBR.V) is In Focus, as it continues to hold up well even with the gold price decline, on a continued series of strong drilling results.


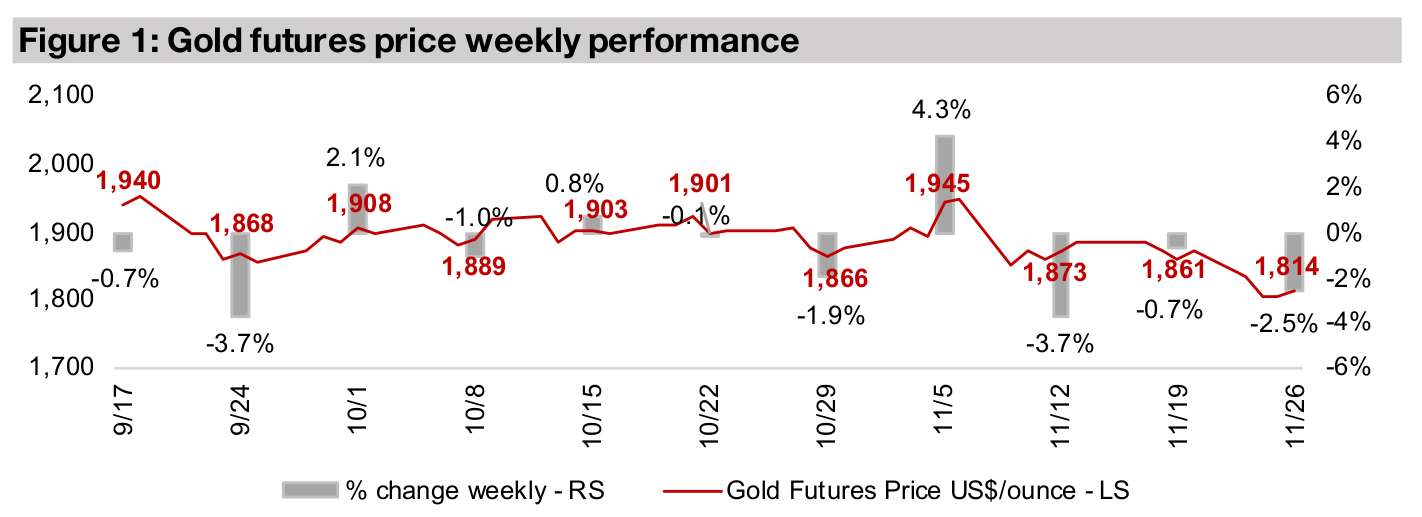
While gold has been relatively weak over the past month, down -6.9% off recent highs of US$1,950/oz in early November, and down -2.5% this week to US$1,814/oz, the bull market continues, and moderate pull backs can be expected, especially in light of the major rip in the gold price over the past year. The gold price has averaged US$1,762/oz this year, up 26.6% from the US$1,392/oz in 2019, and up 39.0% from the 2018 average of US$1,268/oz (Figure 4). In this context, gold levels above US$1,800/oz are hardly a cause for concern and would have been the dream of gold investors from the point of view of 2018.
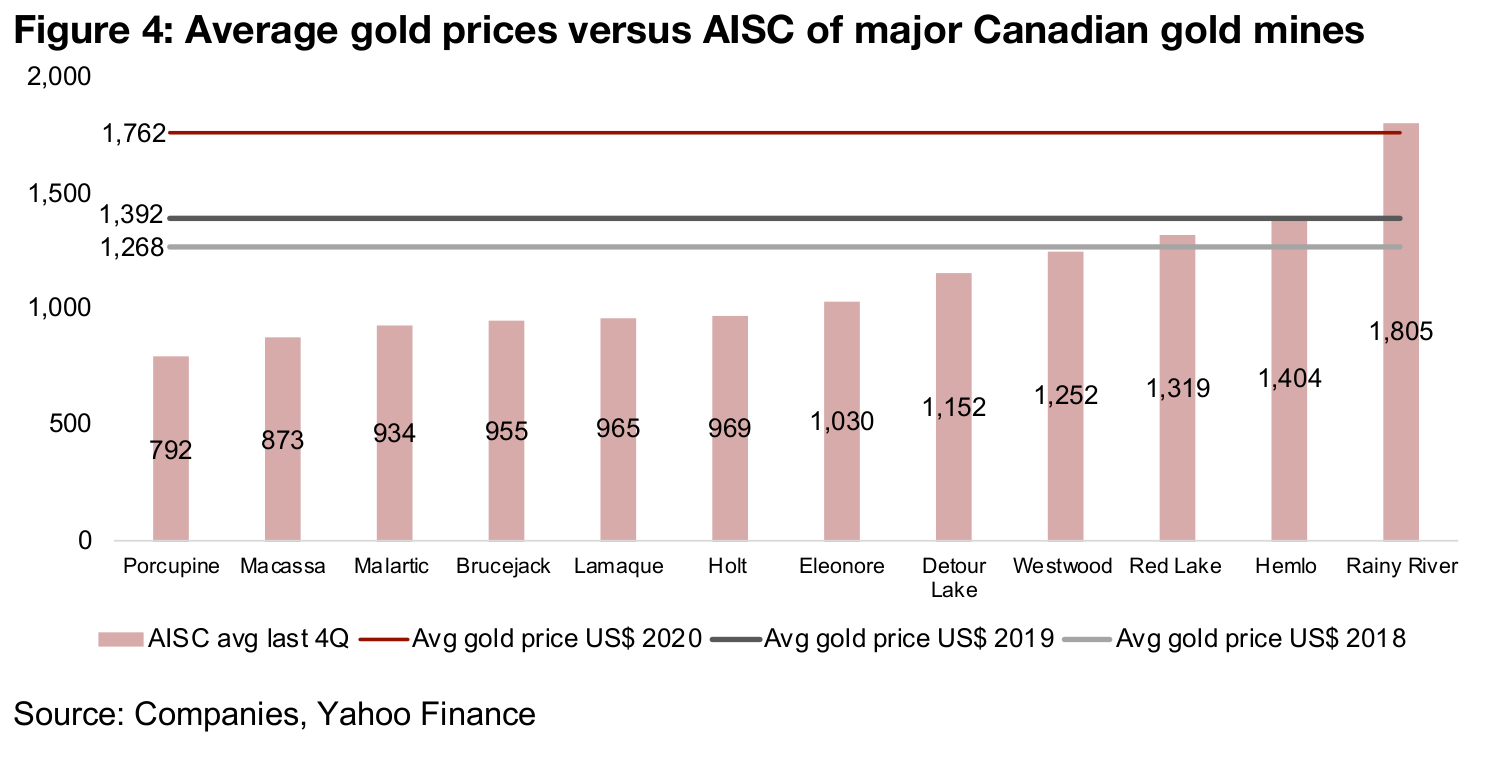
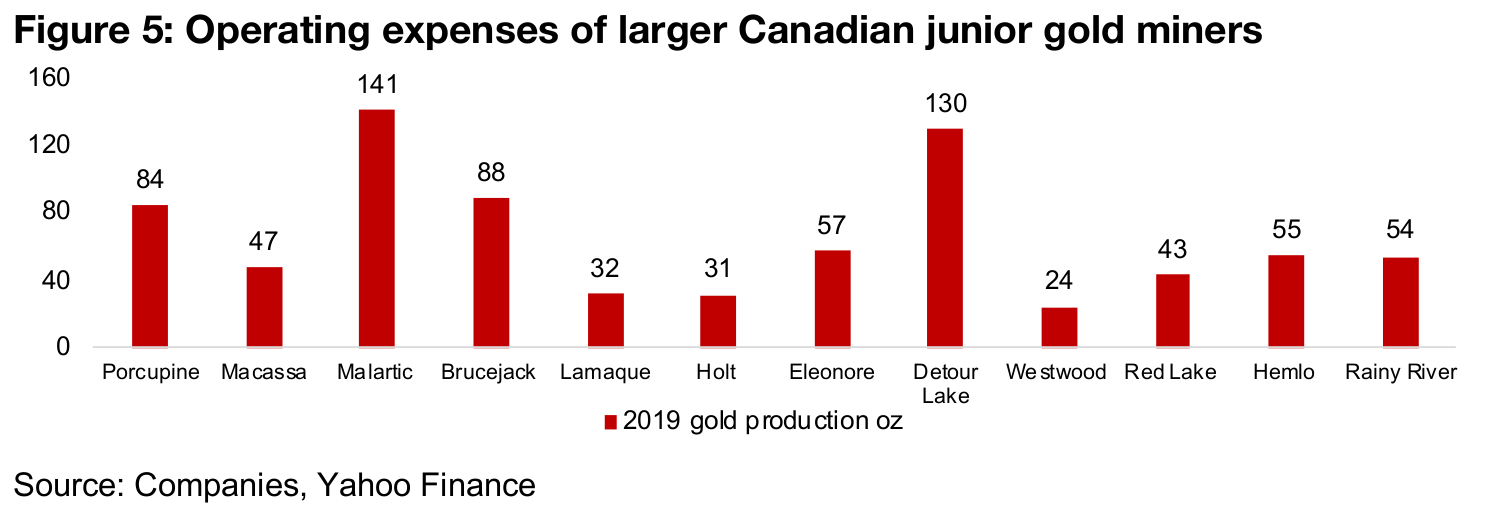
Figure 4 compares these gold price annual averages to the average all-in-sustaining-
costs over the past four quarters of most of the major producing Canadian gold mines.
The US$1,762/oz average for 2020 clearly ensures substantial profitability for all but
one mine of the group, the particularly high-cost Rainy River, but even this mine is
close to break-even at current prices, and it is a relatively small producer, and thus
would have a limited effect on average costs for these mines (Figure 5). All the other
mines are making strong margins at the 2020 average gold price, and prices would
have to plummet towards US$1,400/oz before profitability would become a major
concern for the sector. Such a severe decline seems extremely unlikely, and analysts
are hardly turning bearish, on average still forecasting US$2,000/oz for 2021. This is
because high global risks still remain, and the core driver for gold, global monetary
expansion, is extremely likely to continue whether or not the health crisis abates
further.
While Bank of America has pulled back on its outlier US$3,000/oz forecast for 2021,
the new forecast is still above US$2,000, which is more than enough to drive very
high margins for the average producing Canadian mine, as demonstrated above.
While some investors may be disappointed that the US$2,000/oz level was only held
very briefly 2020, and some particularly high levels of fear were needed to get there,
this level is not out of reach for 2021, especially as major global monetary expansion
will certainly continue over the next few years. Meanwhile, US$1,800/oz is still being
held even with global health crisis concerns dramatically decreasing over the past
few months, suggesting that the underlying fundamentals, even without the support
of peak-health-concern, are still robust for gold.
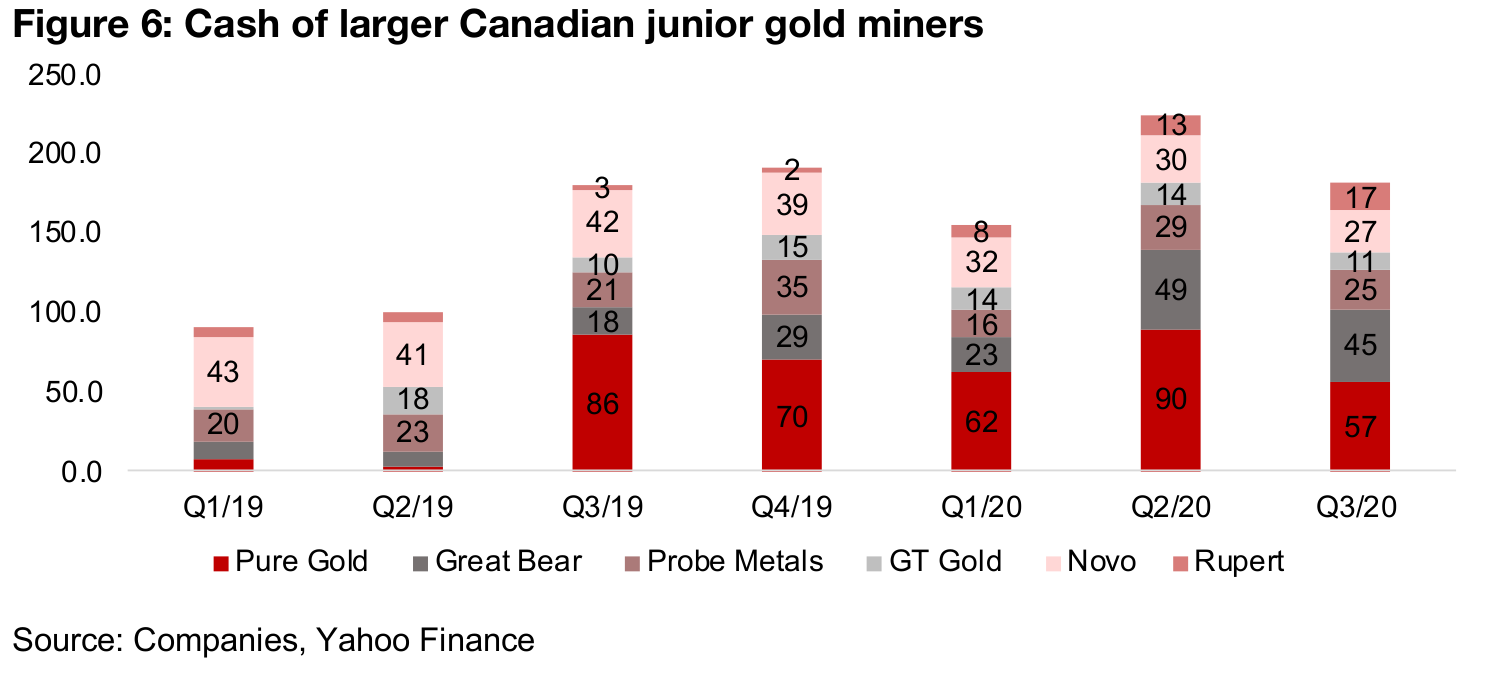
Turning to a more micro view, this week we look at the movement in cash balances and operating expenses for several of the larger Canadian junior gold miners, including Pure Gold, Great Bear, Probe Metals, GT Gold, Novo Resources, and Rupert Resources. The cash balance of the sector has jumped considerably, starting in Q3/19, to levels about twice that of Q1/19 and Q2/19. This big shift in Q3/19 was almost entirely driven by Pure Gold, which has been one of the outstanding plays in in the sector in 2020, as the company heads for first gold pour by the end of 2020 at its Red Lake project, and therefore has been able to raise major amounts of capital (Figure 6). By Q2/20, we also see Great Bear's cash balance start to boost the group total. Great Bear is another Red Lake play, with its Dixie Project showing strong drilling results for most of 2020 (for more detail, see the In Focus section), with the project at an earlier stage than Pure Gold, and it has still not released an initial resource estimate resource or PEA. The other firms have either seen a relatively steady level of cash, or balances that are too small to move the overall total, with the Red Lake plays the big drivers.
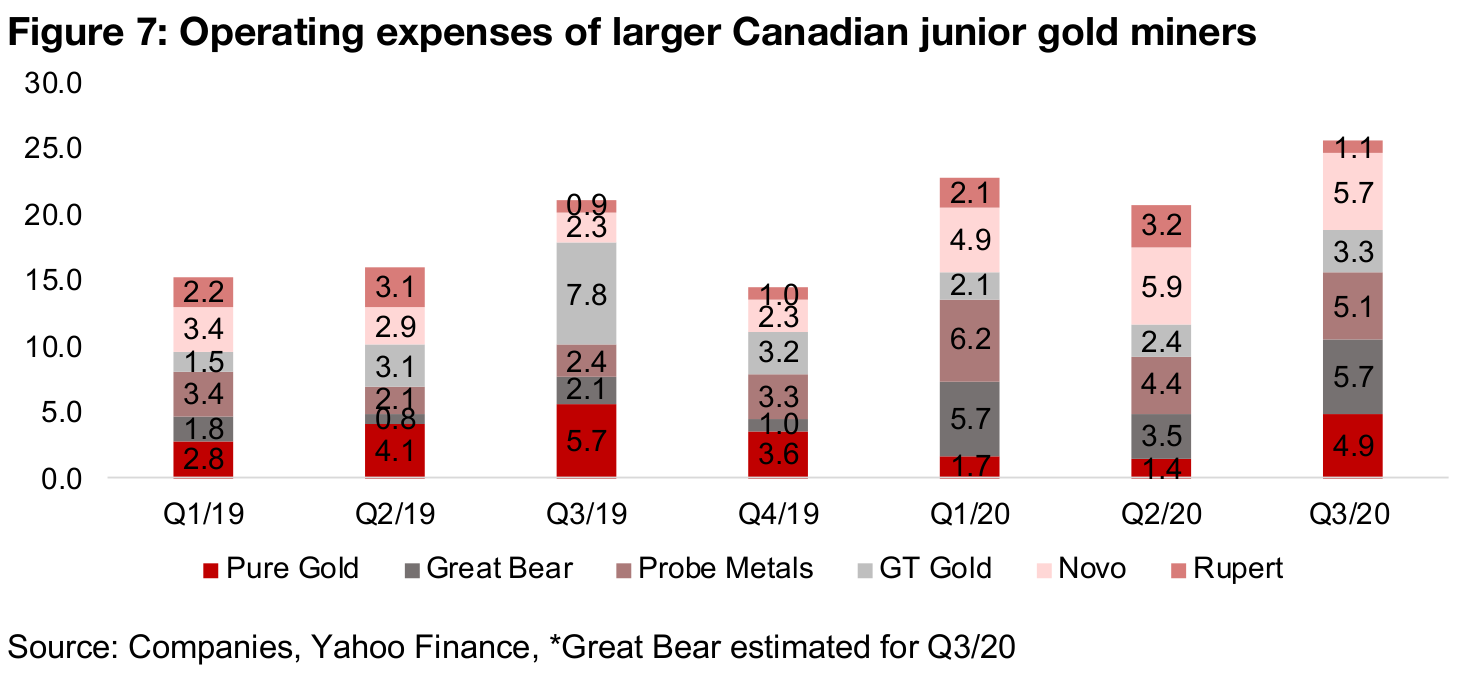
The rise in cash balances has been followed by a rise in the large Canadian junior
miners putting capital to work overall as group, as measured by rising operating
expenses (Figure 7). For most of the Canadian juniors the rising availability of cash
will generally translate into rising operating expenses, especially for exploration.
However, Pure Gold is a special case, as it is the farthest along in its development of
the group, and shifting away from junior explorer and towards junior producer. While
its cash balance jumped 26-fold from just US$3.3mn in Q2/19 to $85.7mn in Q3/19
its opex rose only 39% to $4.1mn from $5.7mn.
Pure Gold's operating expenses actually dipped after this huge increase in capital, to
just US$3.6mn in Q4/19, or just 5.1% of their available cash, and to marginal levels
below US$2.0mn in both Q1/20 and Q2/20 as the focus became less on further
exploration, and more on conserving capital to support eventual production. The rest
of the group, still all deep in the exploration phase, have had a higher operating
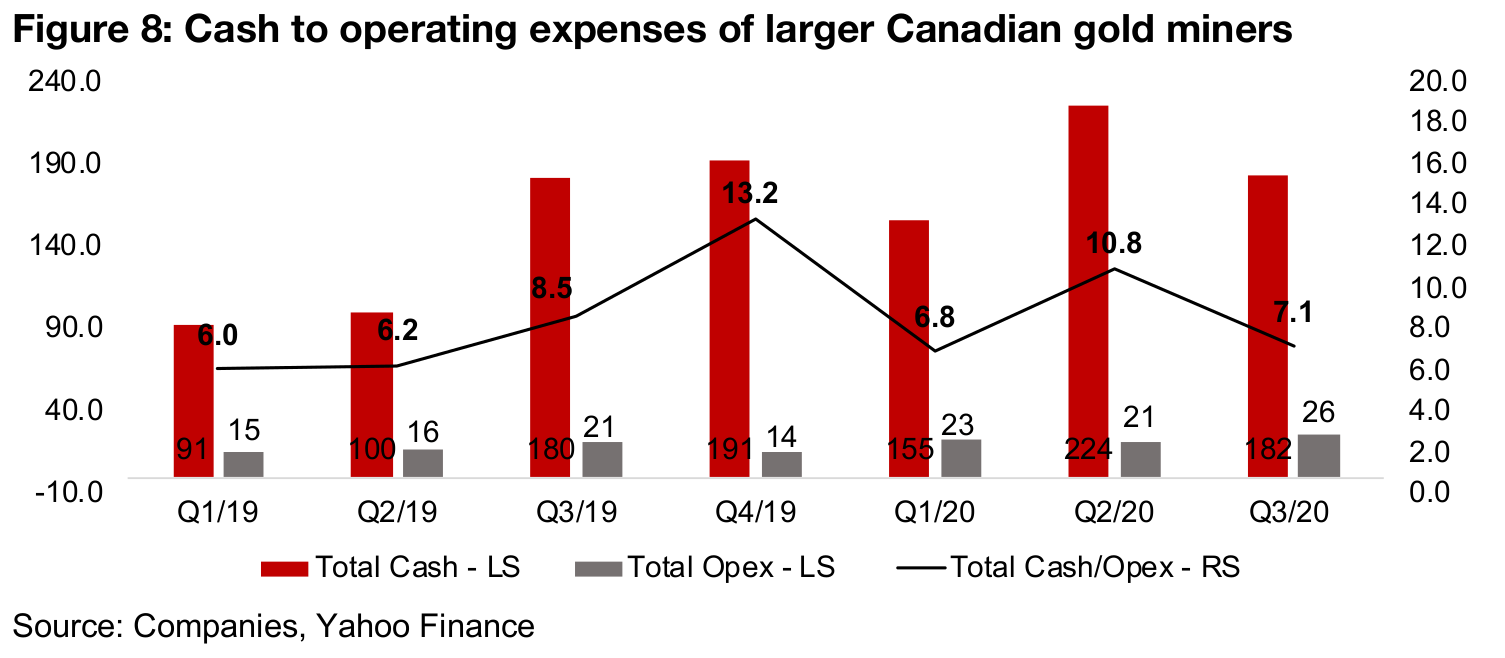
expense/cash ratio than Pure Gold. In aggregate, the cash/operating expenses ratio
for the group peaked in Q4/19 at 13.2x, driven by the winter low season and high
Pure Gold cash balance, and has declined to 7.1x as of Q3/20, as opex has risen
from $14mn in Q4/19 to $26mn in Q3/20 (Figure 8).
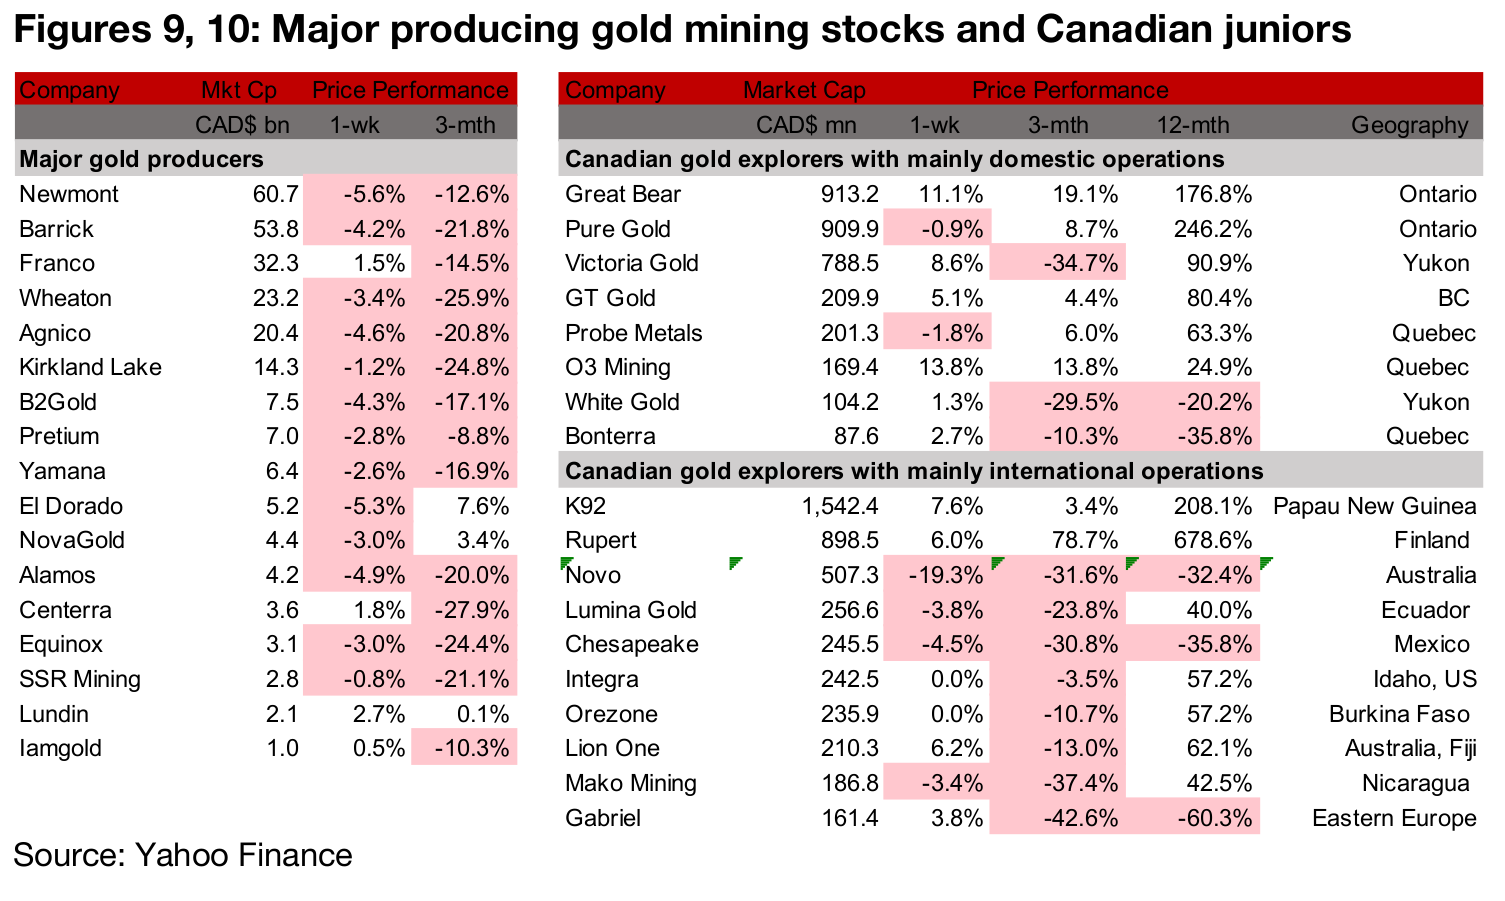
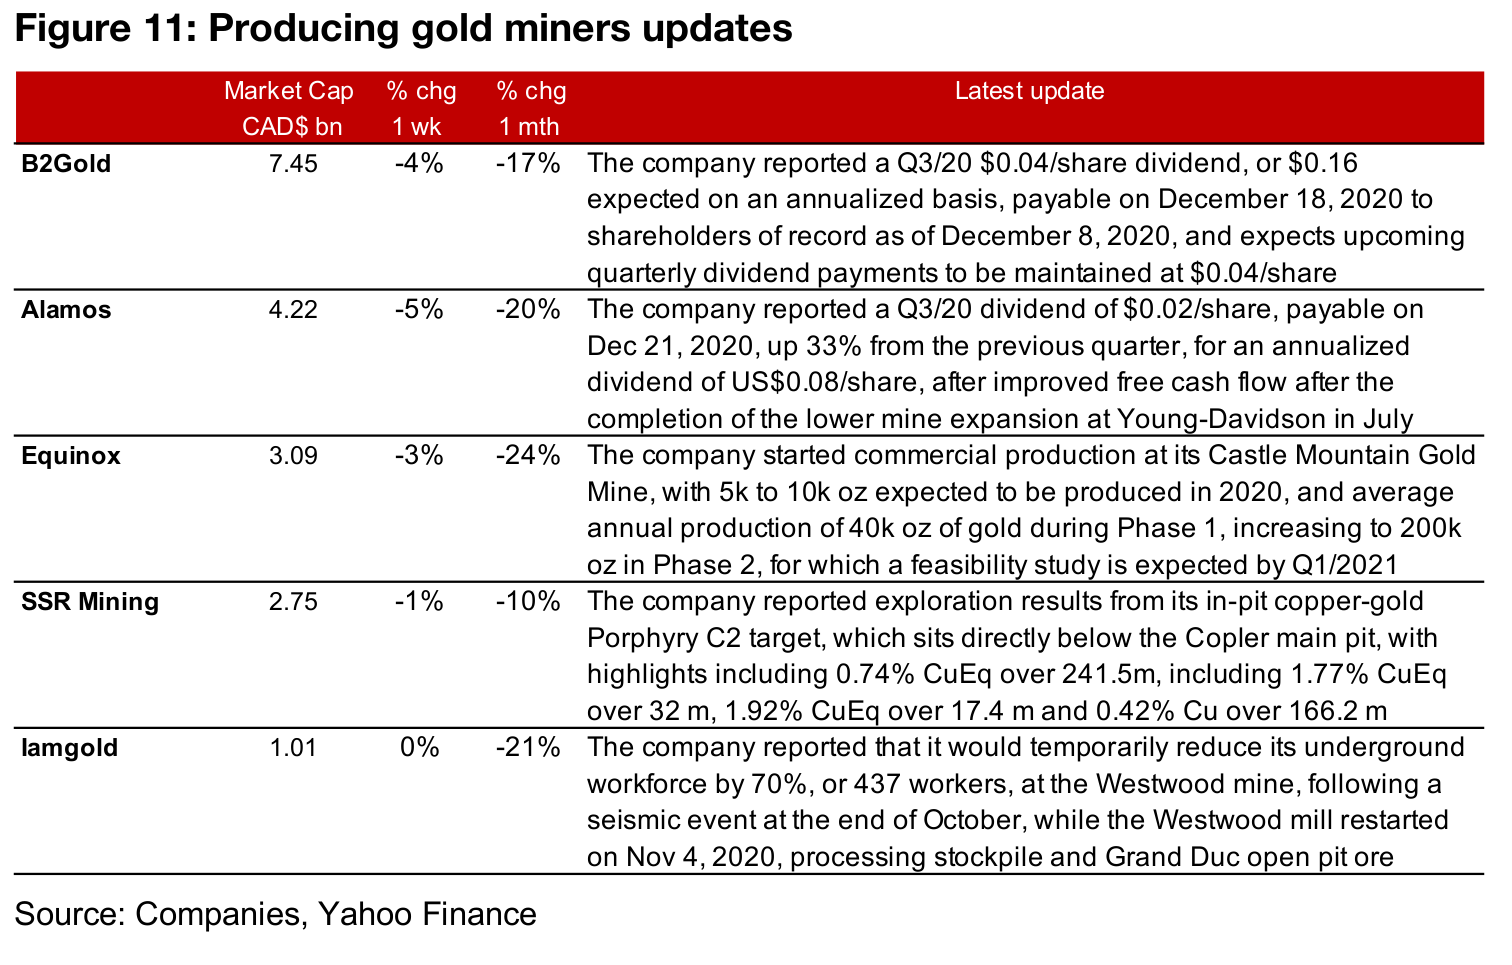
The producing miners mostly edged down by single digits this week on the slide in the gold price (Figure 9). There was no news flow from the major producers following the end of the Q3/20 results season earlier this month, but there were some press releases from medium-sized and smaller producers. Both B2Gold and Alamos reported their Q3/20 dividends, Equinox announced the start of commercial production at its Castle Mountain Gold Mine, SSR Mining reported drilling results from a target below the main pit of the Copler mine, and Iamgold temporarily reduced its underground workforce at its Westwood mine after a seismic event there on October 30 which is still being investigated (Figure 11).
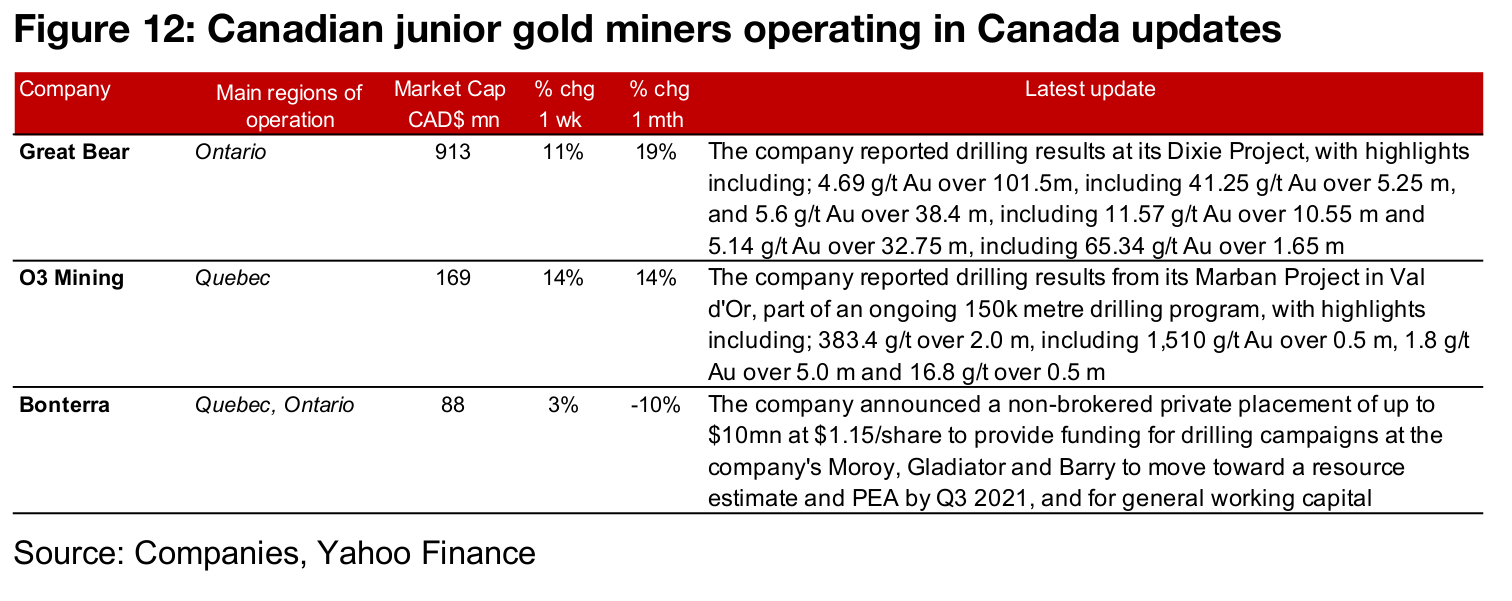
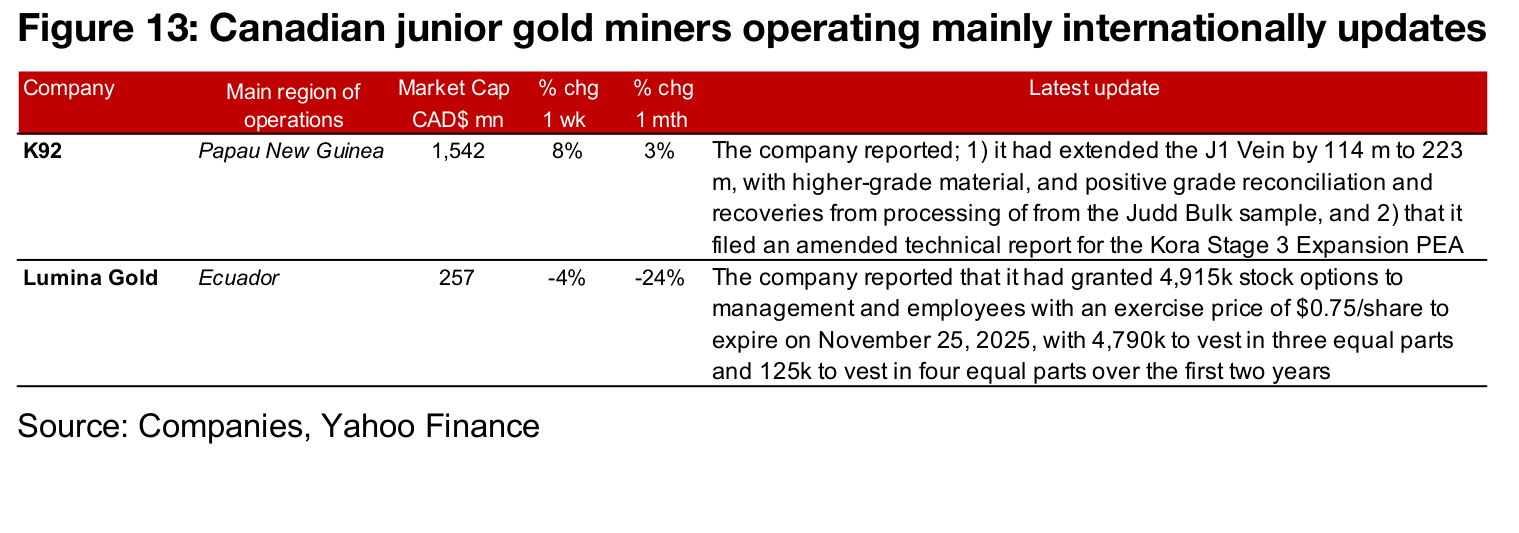
The Canadian juniors were mixed this week, with some gaining on company specific drivers even as the gold price fell (Figure 10). For the Canadian juniors operating domestically, both Great Bear, up 11% (see the In Focus section below for more detail) and O3 Mining, up 14%, were driven by strong drilling results reported this week, and Bonterra rose 3% on news of a private placement (Figure 12). For the Canadian juniors operating internationally, K92 reported an extension of the J1 Vein and the filing of an amended technical report for the Kora Stage 3 Expansion PEA, and Lumina reported stock options granted to management and employees (Figure 13).
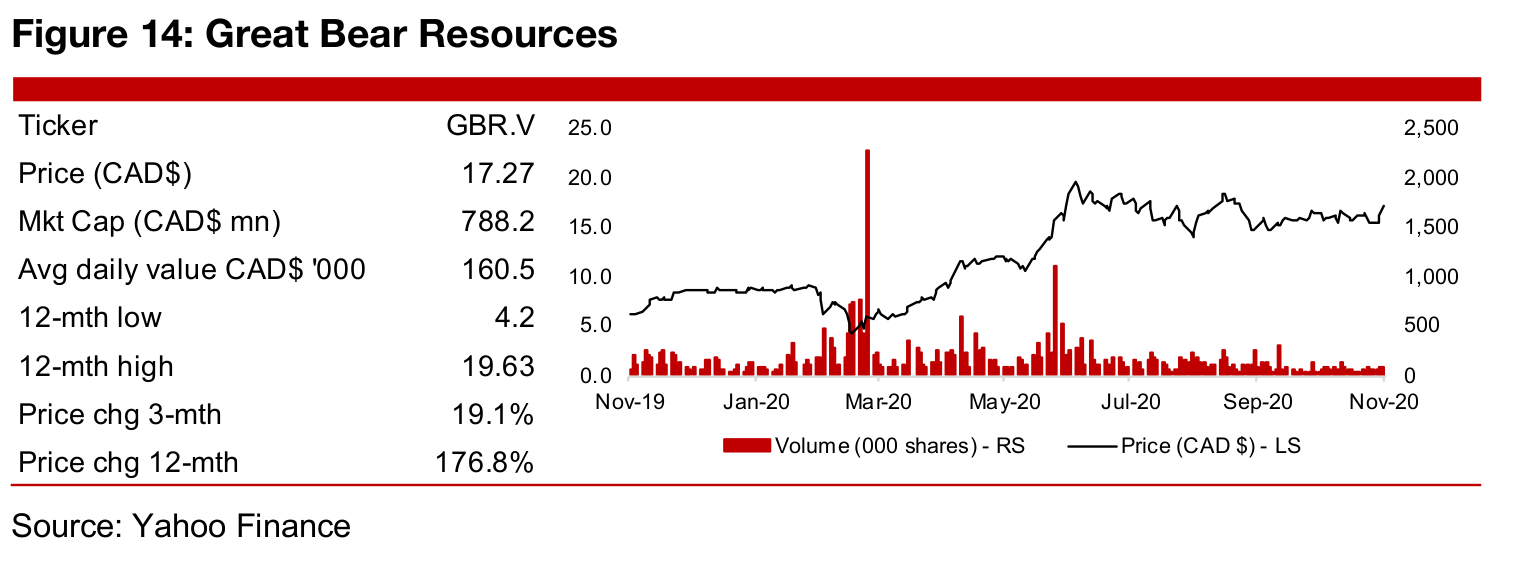
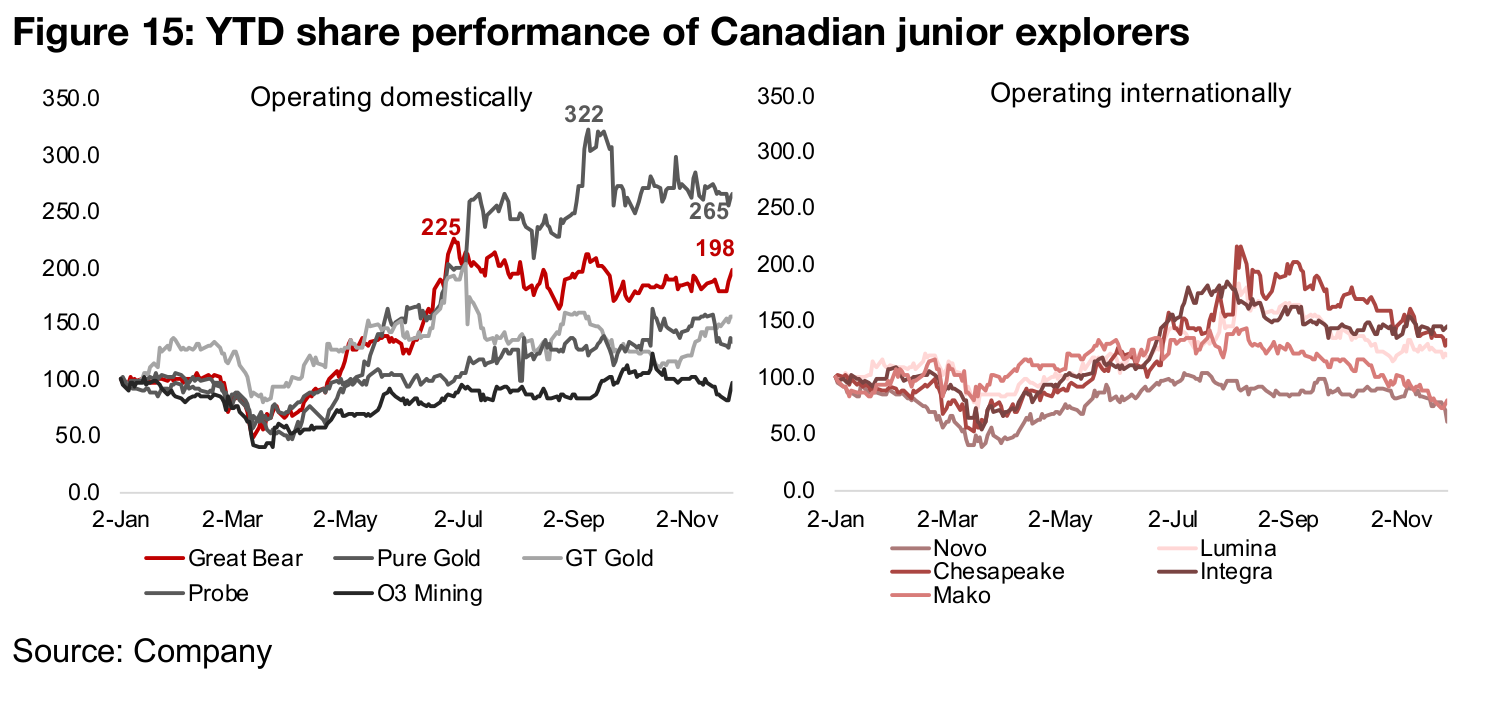
Great Bear Resources reported another set of strong drilling results this week, and continues to hold up well, even as the sector has cooled down over the past two months. The larger Canadian junior explorers had seen an impressive run off the March 2020 lows through to July 2020 (Figure 15). However, by August 2020, most of these stocks peaked, as the spike in the global-health-crisis-fear-premium baked into gold had started to subside as worst-case scenarios did not come to pass, and most of the sector has seen a slide from September to November. However, two stocks have not succumbed so much to this trend, the Red Lake plays Pure Gold and Great Bear, with Great Bear especially holding up well, having dipped just 12.0% from its highs for the year, compared to Pure Gold, off 17.7%.
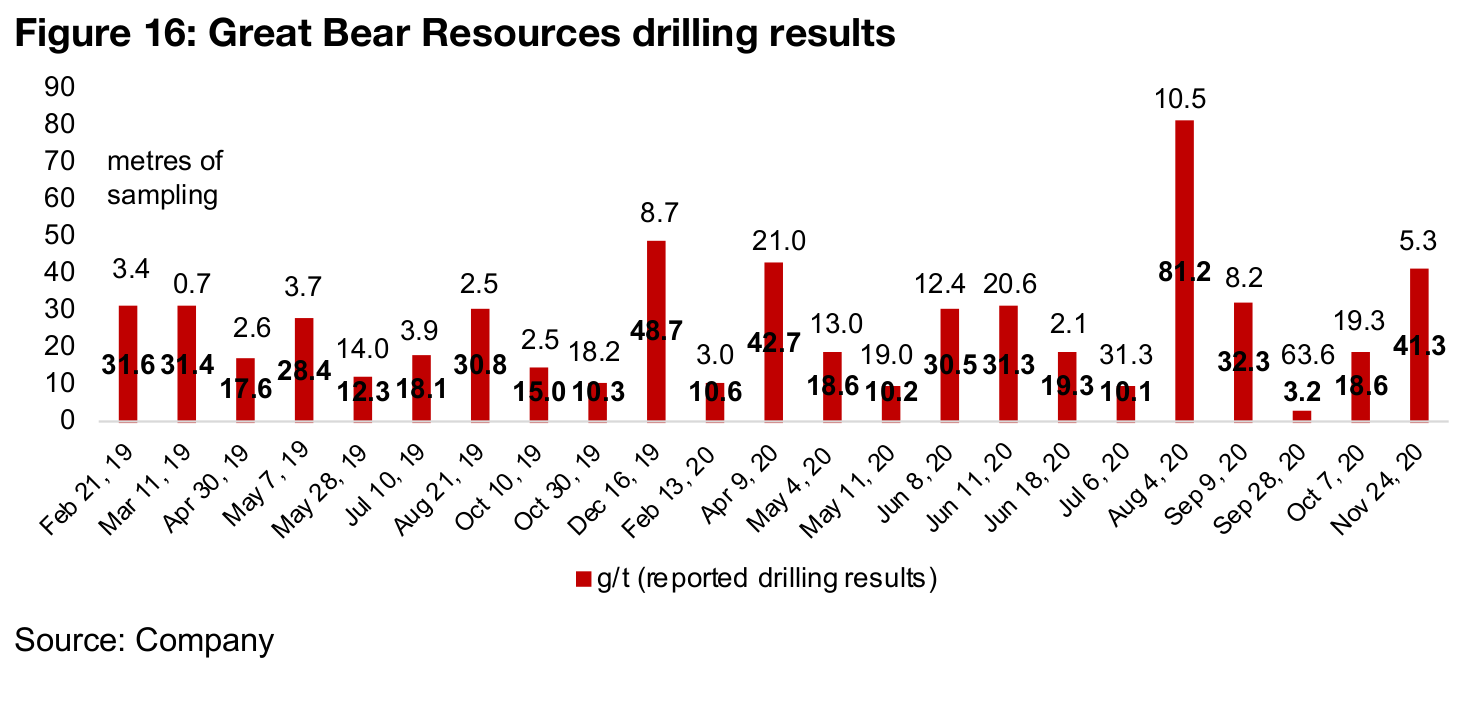
This is because the company has continued to deliver a series of strong drilling results
from its Dixie Project since 2019, and these have improved in recent months. The
most recent results this week with a highlight of 41.3 g/t Au over 5.3 m is the fourth
best result over the past two years based on grade, surpassed only by the 81.2 g/t
Au over 10.5 m result reported on August 4, 2020, the 42.7 g/t Au result over 21.0m
reported on April 9, 2020, and the 48.7 g/t Au over 8.7 m from December 16, 2019
(Figure 16). The company is also reporting increased potential continuity at the project,
which has led the market to attribute a value to the stock of $913mn based on its
market cap, marginally higher than even Pure Gold, with a market cap of $910mn.
This is even though Pure Gold is at a considerably advanced stage versus Great Bear,
expecting its first gold pour by the end of this year. Great Bear in contrast, has yet to
release an initial mineral resource estimate or PEA, and is likely strategically holding
off on these as the potential size of the resource continues to grow as exploration
continues. If Pure Gold meets its first gold pour targeted by the end of this year and
Great Bear continues to produce strong drilling results and is able to demonstrate
increasing continuity at Dixie, the stocks may be able to continue to hold up against
the general cool down in the larger Canadian junior gold mining sector.
Disclaimer: This report is for informational use only and should not be used an alternative to the financial and legal advice of a qualified professional in business planning and investment. We do not represent that forecasts in this report will lead to a specific outcome or result, and are not liable in the event of any business action taken in whole or in part as a result of the contents of this report.
Author
Ben McGregor authors the Weekly Roundup at CanadianMiningReport.com, providing sharp analysis of the metals and mining sector. With a talent for spotting trends, Ben distills complex market shifts into clear, engaging insights on TSXV junior miners. His weekly updates cover gold, copper, uranium, and more, blending data-driven perspectives with a knack for identifying opportunities. A vital resource for investors, Ben’s work navigates the dynamic junior mining landscape with precision.