
Sep 04, 2020
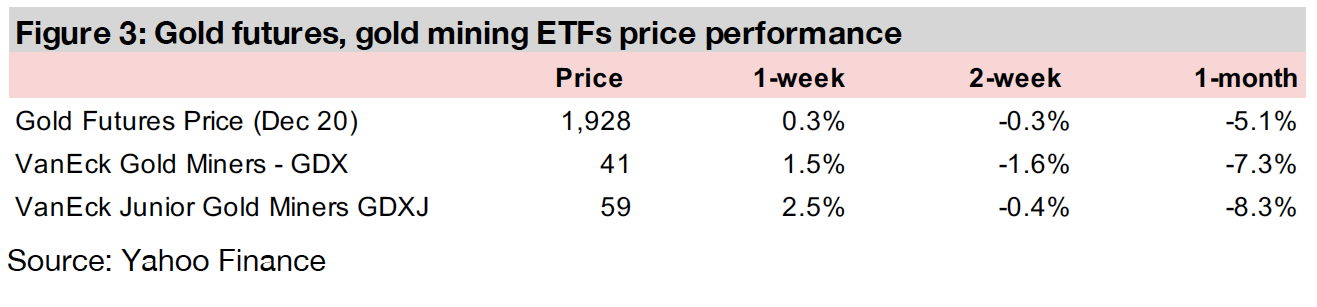
The gold price was near flat this week, up 0.3%, closing at US$1,928/oz, continuing to trade in the US$1,900/oz-US$2,000/oz range of the past six weeks, with macro risks remaining high but not trending up or down substantially.
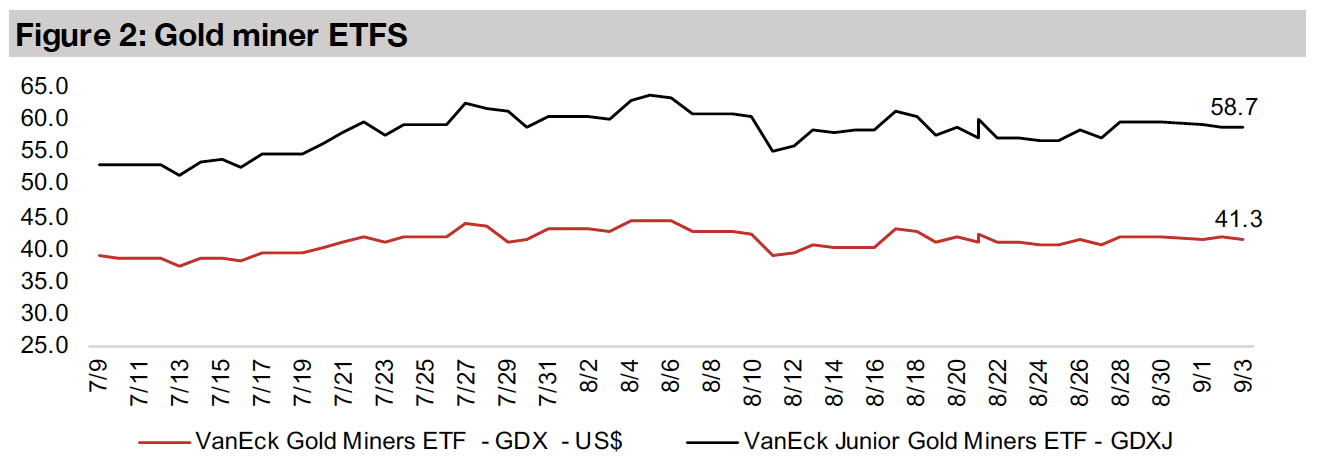
Producing miners edged up this week, with the GDX rising 1.5%, and nearly all of the major listed producers gaining, mostly by low single digits, with limited material news flow from the sector.
The global gold juniors were up this week, with the GDXJ gaining 2.5%, and most Canadian juniors rising. In Focus this week is Integra Resources, which is exploring several projects in Idaho, US, including its flagship Delamar project.


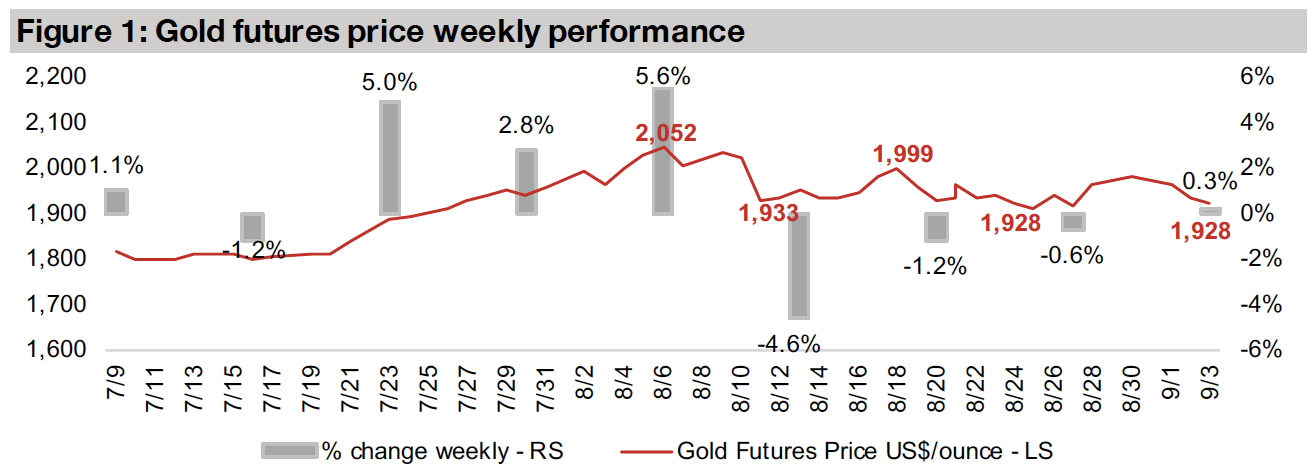
The gold futures price was near flat this week, up just 0.3%, closing at US$1,928/oz, continuing to trade in a range between around US$1,900/oz-US$2,000/oz that has held for six weeks. While macroeconomic risks are still high, there has been no substantial trends of risk either becoming more extreme or declining, so we could potentially see gold continue to hold around this trading range short-term. One major issue that could keep gold range-bound is traders not making major moves in advance of the US election. With the two sides having wide differences on economic policy and given the US's major effect on the global economy, the election could have a substantial effect on the global macro picture, and in turn gold. The election could drive big moves in the US$, which is inversely related to gold, and which as the reserve currency also affects the pricing of many other global assets.
We have outlined in recent weeklies the many factors affecting the gold price (see our
August 28, 2020 weekly for a summary chart of these factors) but we would target
the recent monetary expansion as one of the most, if not the most, significant factors
driving gold since the crisis. We can look at three main data sets to show the change;
1) an index of global central policy ranging from easing to tightening, 2) global central
bank balance sheets, where an expansion shows an increase in the availability of
'high-powered' money, and 3) the change in the M3 money supply, which is the
broadest measure of the monetary base. In the last six months we see a major move
towards policy easing by the central banks, and a major resultant increase in the
money supply.
When considering the monetary expansion's effect on gold, we need to consider a
few main factors. The first is that gold is considered a currency as much as it is a
commodity. This is according to; 1) all of the world's central banks, which include
some gold in their asset holdings, and 2) Bloomberg, one the largest suppliers of
financial information globally, which while it does list gold under a commodity ticker,
or COM, on its website, also lists it as a currency, or CUR. Second, if the supply of
some currencies, in this case the major fiat currencies like the US$, Euro and Yen, is
expanded at a greater rate than other currencies, in this case gold, which is expected
to see near zero mining supply growth this year, we would expect the relative value
of the fiat currencies to decline and gold to rise, other things held constant. While
there are other factors at work, like economic and global risk, driving gold, we could
say that at root, these drivers are also monetary, as the market may expect monetary
expansion by global monetary authorities in response to rising economic risks.
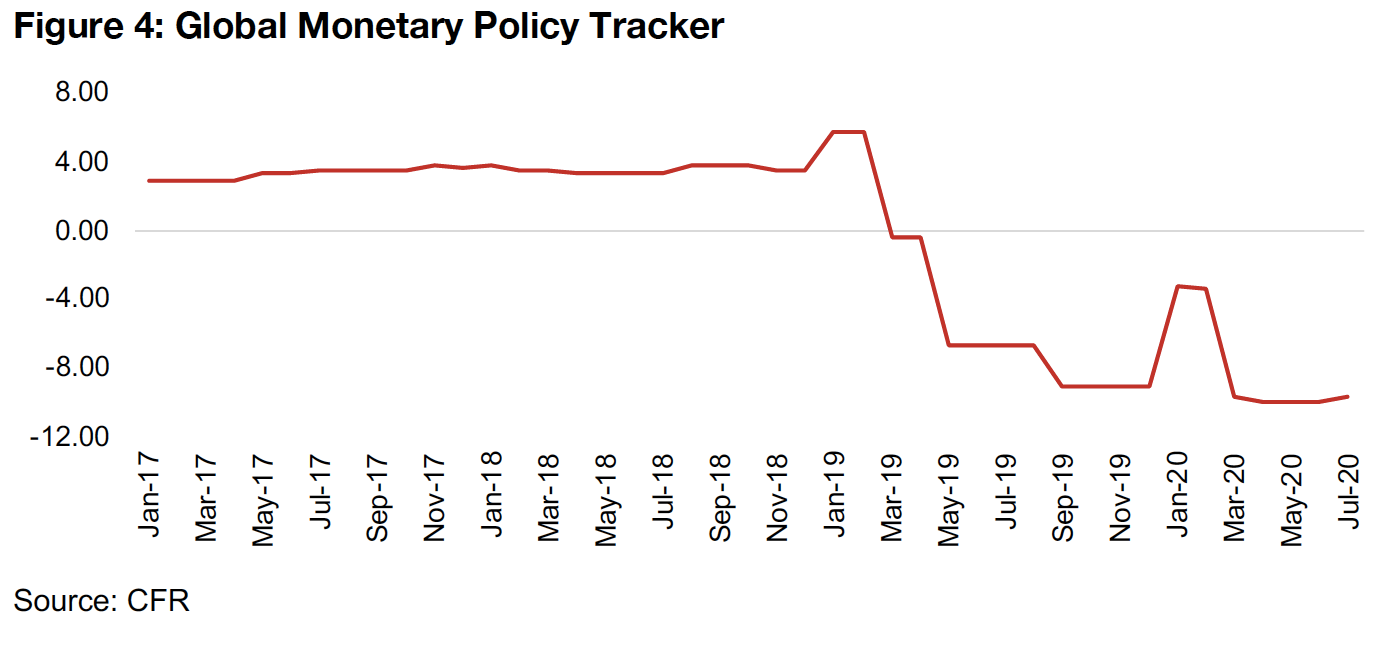
All three of the data sets we have referred to show that we are clearly in a period of
major monetary expansion. First, the Global Monetary Policy Tracker in Figure 4
shows the combined monetary policy of the world's central banks. As we move above
zero, more central banks are tightening monetary policy or reducing the money
supply, and as we move below zero, banks are easing, or expanding the monetary
base. We can see that after a trend towards tightening overall from 2017 into Q2/19,
monetary easing began in earnest, and as it continued into the middle of the year, the
gold price began to pick up. After a brief tightening phase in late 2019-early 2020,
the crisis drove another major wave of easing, with the index now at its lowest point
in several years.
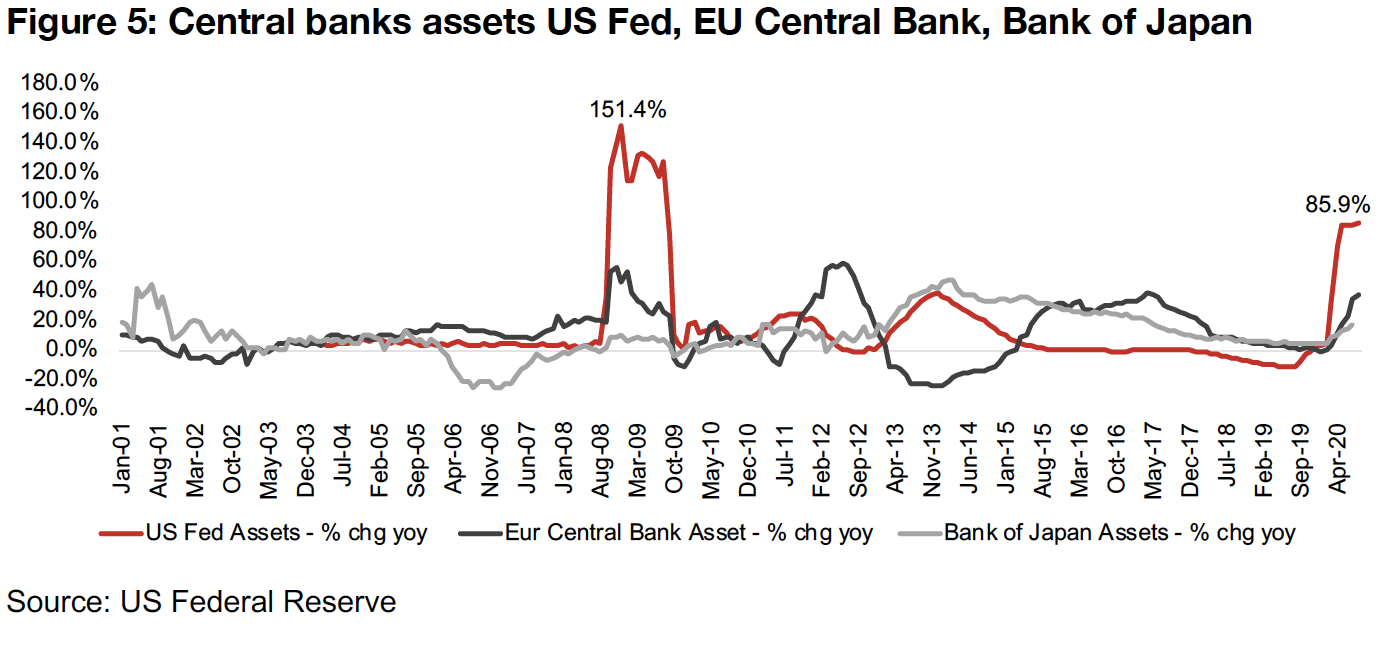
Related to this is the increase in central bank assets, with the yoy growth shown in
Figure 5. Growth in the assets of the US Fed have spiked to the highest level since
the 2008-2009 peak in the previous financial crisis, and the European Central Bank
and Bank of Japan have also seen a large jump in central bank asset growth.
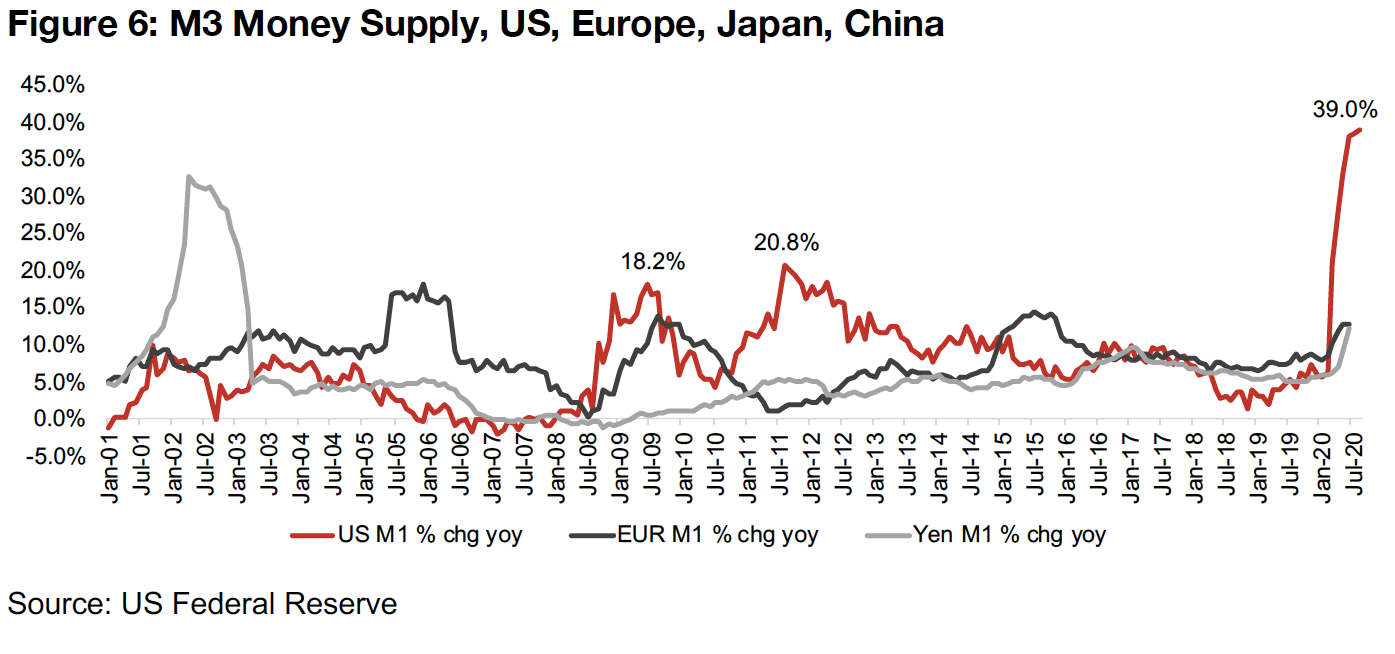
While the US Fed assets are the base of US the money supply, the M3 money supply
is one of the widest definitions of money, including M1 (physical currency and
checkable deposits), M2 (adding savings deposits, smaller time deposits money
market securities, and mutual funds) and adding large time deposits, institutional
money market funds, short-term repurchase agreements and larger liquid assets. The
M3 therefore represents all of the instruments that can be relatively quickly and easily
converted to cash. Along with US Fed Assets, the M3 in the US has also spiked,
actually at a much higher rate than even during the last financial crisis, when it peaked
at 18.2% and 20.8%, as shown in Figure 6. Overall the numbers demonstrate a
massive and abrupt expansion in the monetary supply with the only comparable
period being the last financial crisis, which drove a major rise in the gold price from
2009-2012 until the monetary authorities started to slow the money expansion.
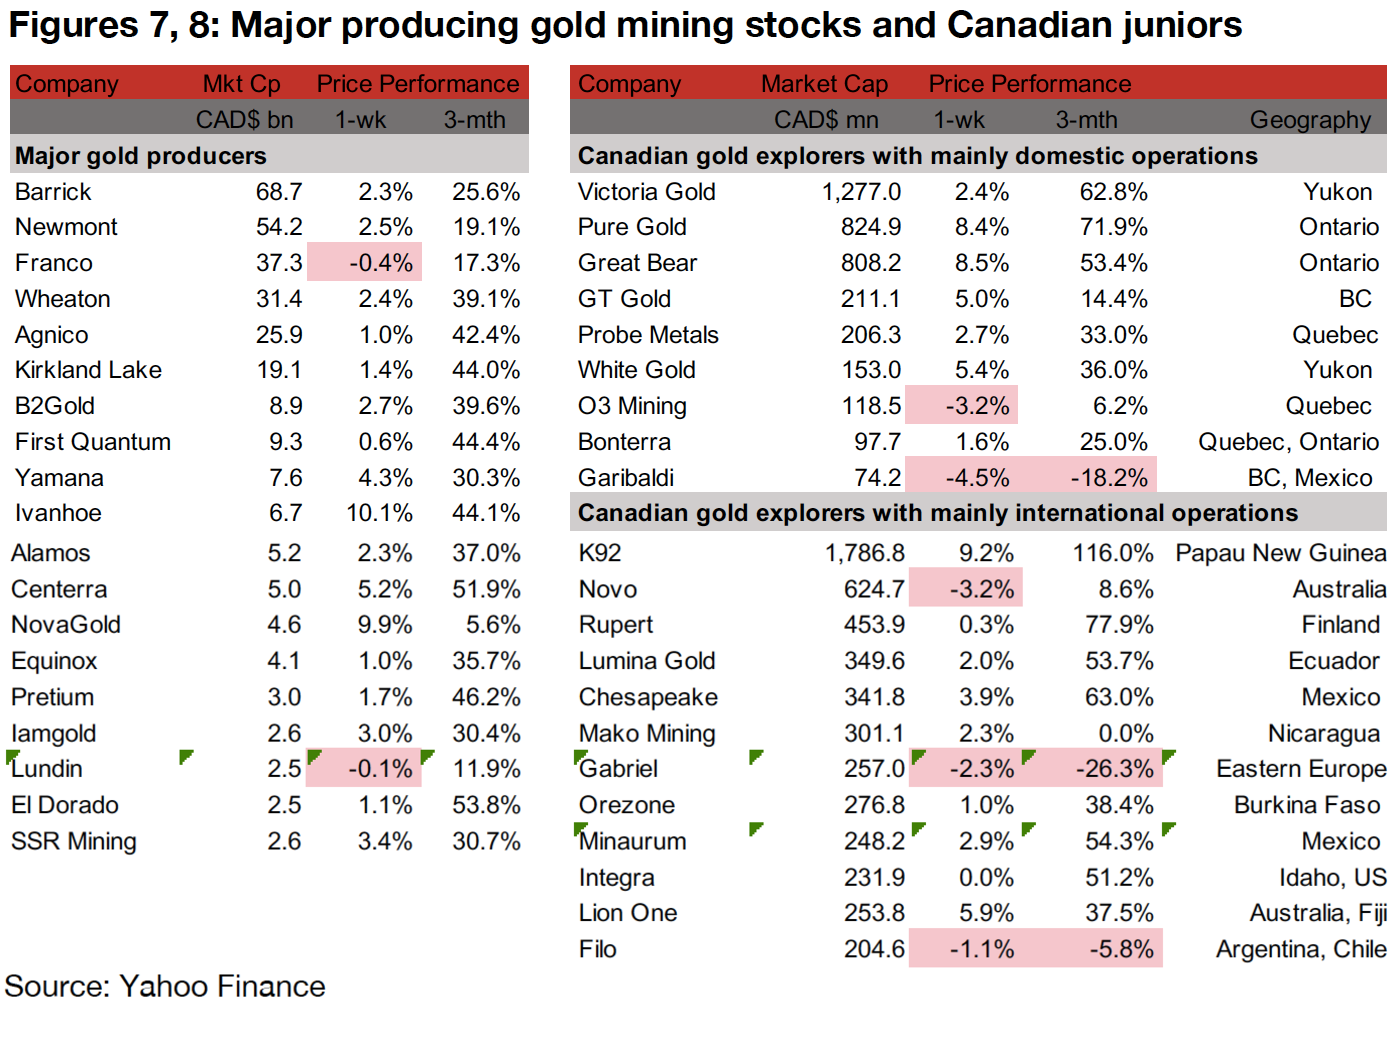
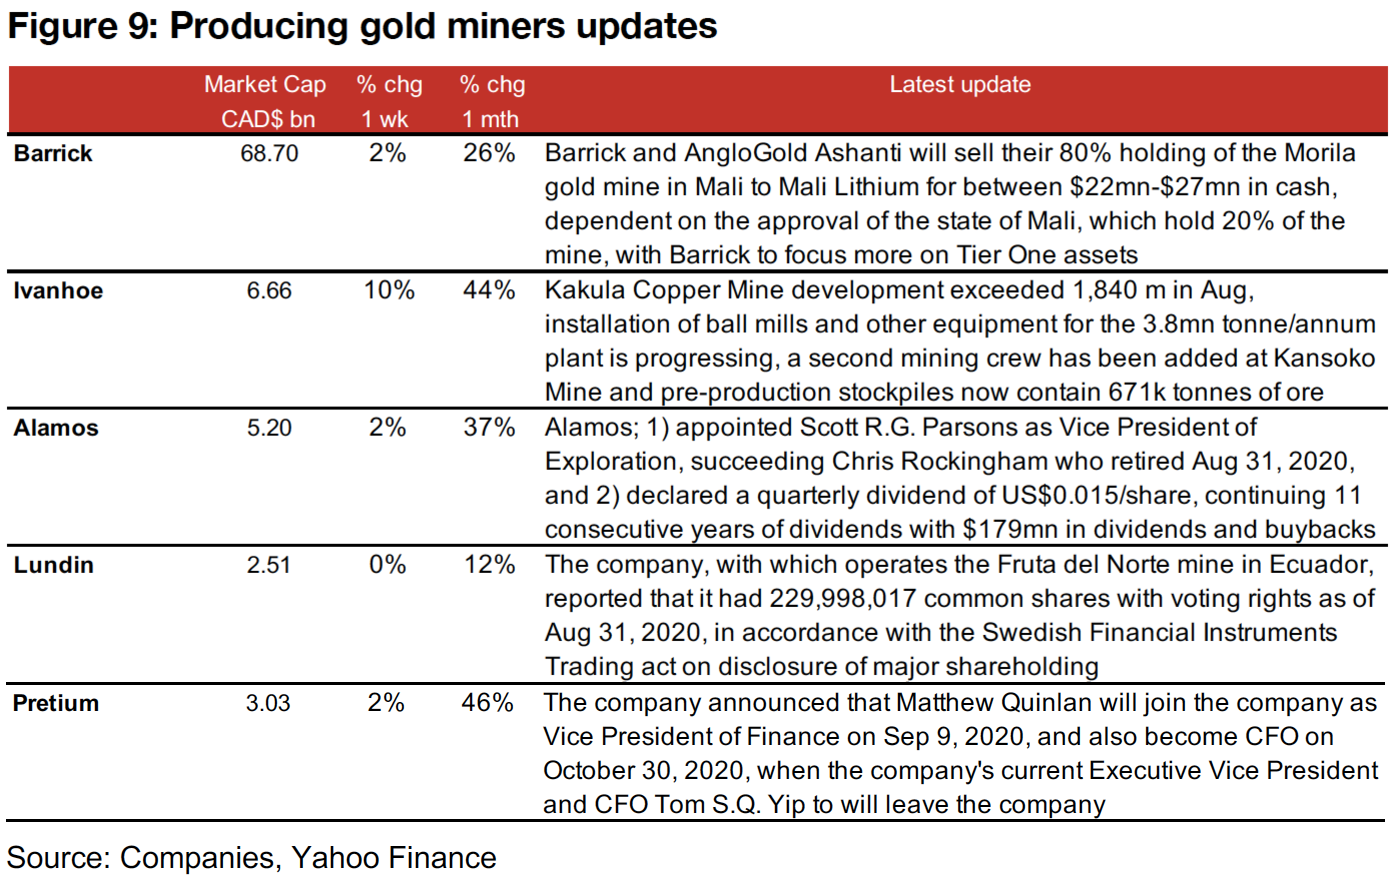
The producers were mixed this week as gold remained within its range of the past six weeks between US$1,900/oz-US$2,000/oz (Figure 7). News flow for the week included Barrick and AngloGold Ashanti's announcement that they will sell their 80% holding of the Morila gold mine to Mali Lithium. Both Alamos and Pretium announced management changes, and Alamos also announced its quarterly dividend. Ivanhoe gave an update on continued progress at its Kakula mine and Lundin announced its number of common shares in-line with Swedish regulatory requirements (Figure 9).
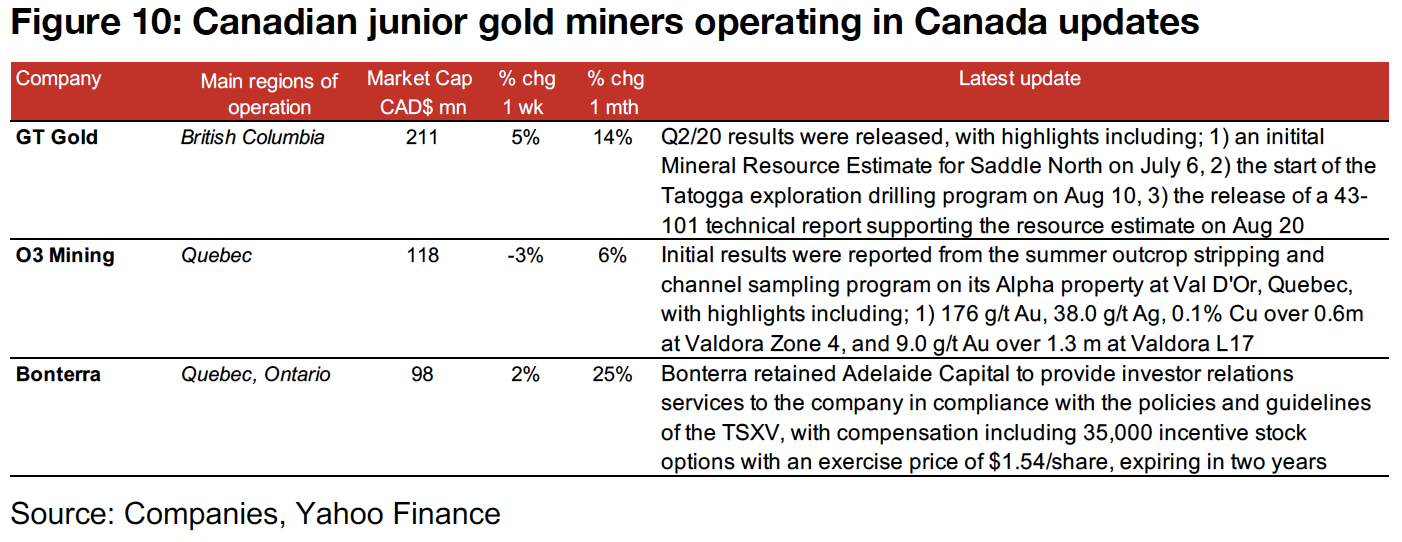
The Canadian juniors with mainly domestic operations mainly rose this week (Figure 8). GT Gold announced Q2/20 results, with highlights including the release of an initial mineral resource and an 43-101 technical report for Saddle North, and the start of its exploration program at Tatogga (Figure 9). O3 Mining reported initial results from its sampling programming on its Alpha property at Val D'Or, Quebec and Bonterra announced that it had retained Adelaide Capital to provide investor relations services.
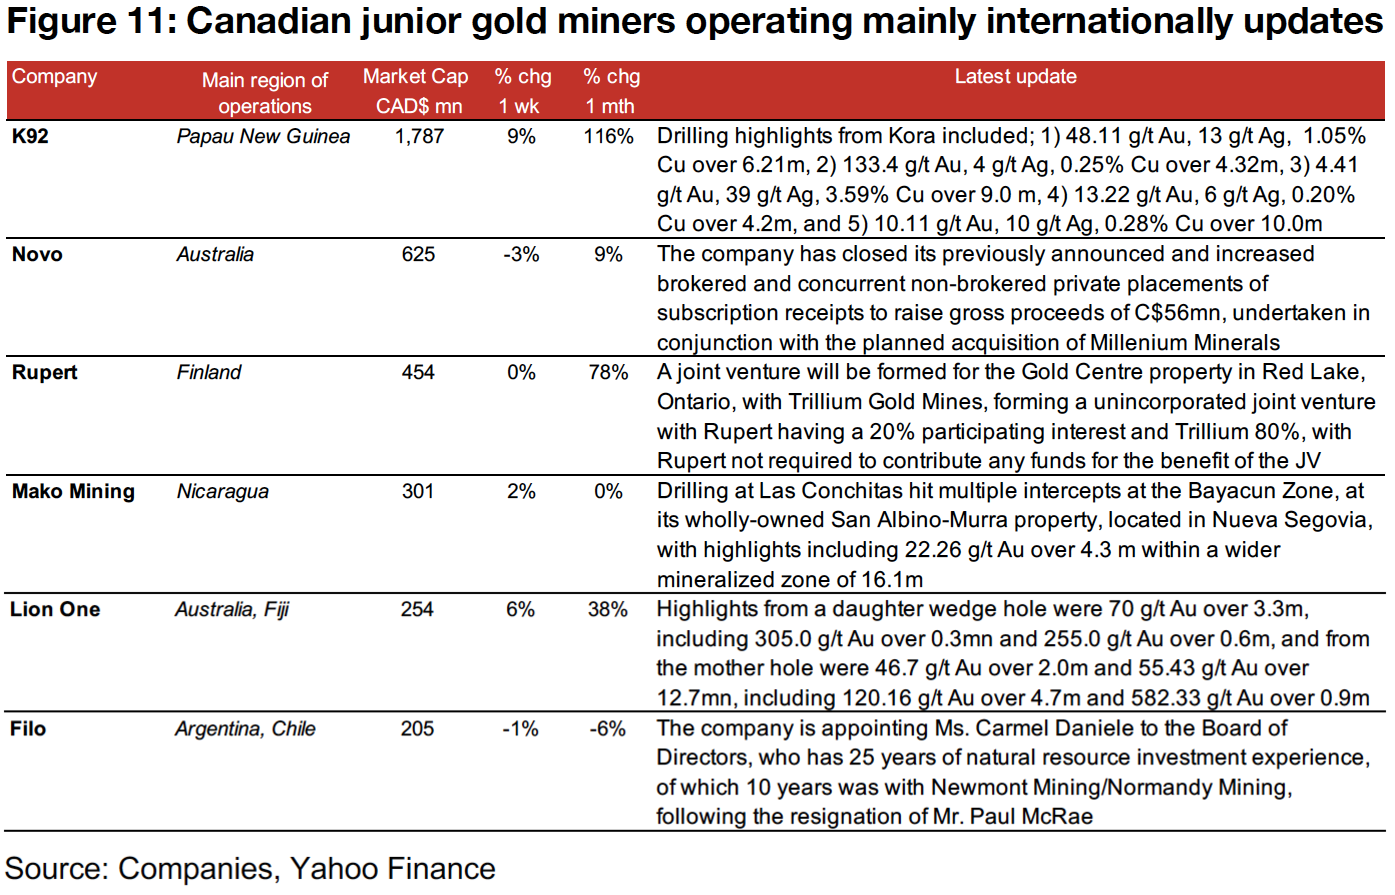
The Canadian juniors operating internationally were mixed (Figure 8). K92 was up 9% on reported drilling results from Kora, Mako Mining was up 2% on drilling at Las Conchitas, and Lion One was up 6% on drilling results at Tuvatu (Figure 10). Novo Resources was down -3% even as it announced the closing of its previously announced private placements, Rupert was flat on the announcement of a JV for the Gold Centre property at Red lake, and Filo was down -1% on the announcement of management changes.
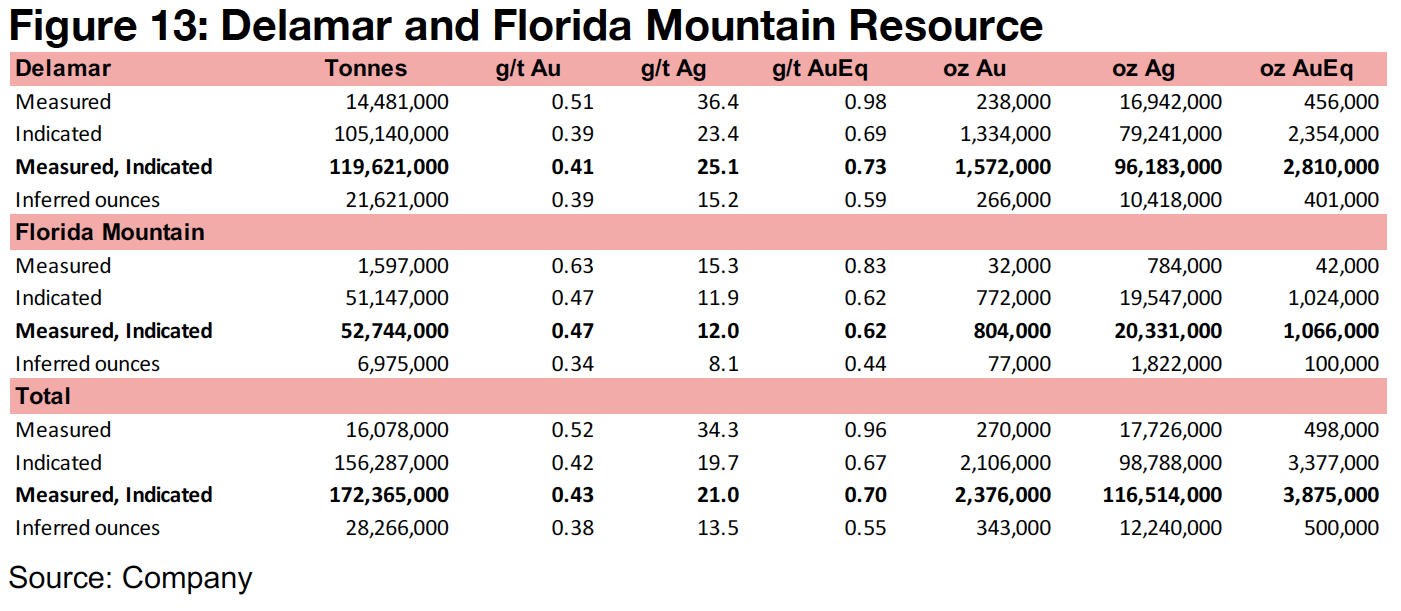
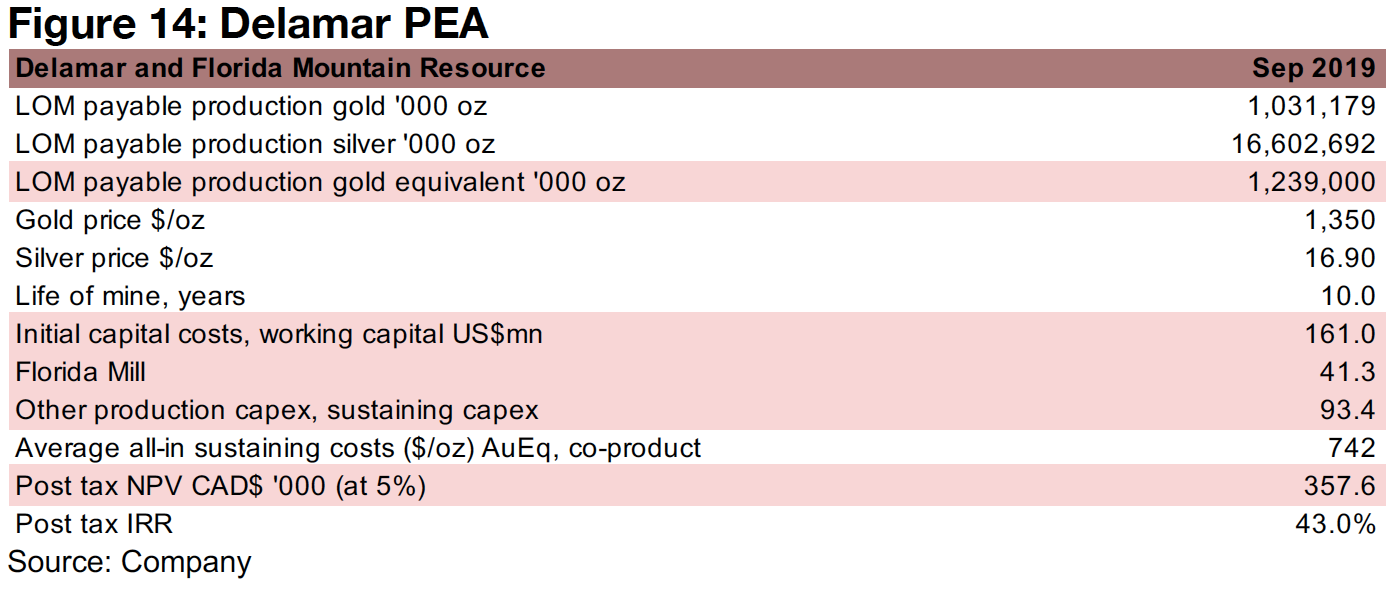
Integra Resources has four projects in Idaho, U.S., 1) Delamar, which has advanced to the PEA Stage, and has 2.81mn AuEq in Measured and Indicated Resources (M&I) and 0.40mn AuEq in Inferred Resources, 2) Florida Mountain, which has 1.06mn AuEq in M&I and 0.10mn AuEq in Inferred Resources, and is part of the focus of the current drilling season 3) War Eagle, which is under exploration and another focus of the current drilling season, and 4) Black Sheep, a large, greenfield property (Figure 13). The Delamar PEA targets LOM payable gold production of 1.23mn AuEq, with 1.03mn oz Au and 16.60mn Ag, with a 10 year mine-life, initial capex of $161.0mn, capex for the Florida Mill of $41.3mn, and other production and sustaining capex of $93.4mn, and an all-in sustaining cost of $742/oz, for a post-tax NPV of CAD$357.6mn, and post-tax IRR of 43% (Figure 14). However, with the PEA using US$1,350/oz and US$16.9/oz gold and silver prices, respectively, more recent averages would see the project valued at much higher levels. With the market cap of Integra Resources at just CAD$239mn, the market has not incorporated in even the entire value of Delamar estimated in the PEA, before even considering strong gold and silver prices.
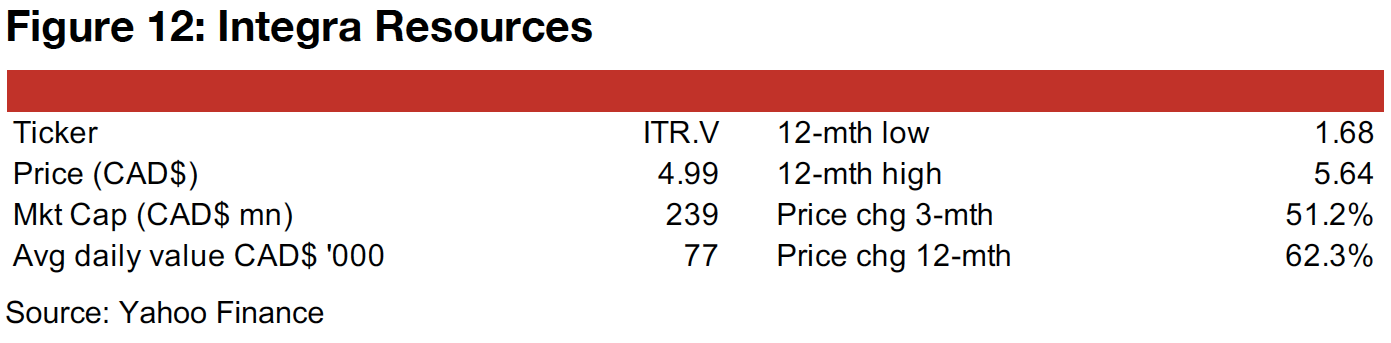
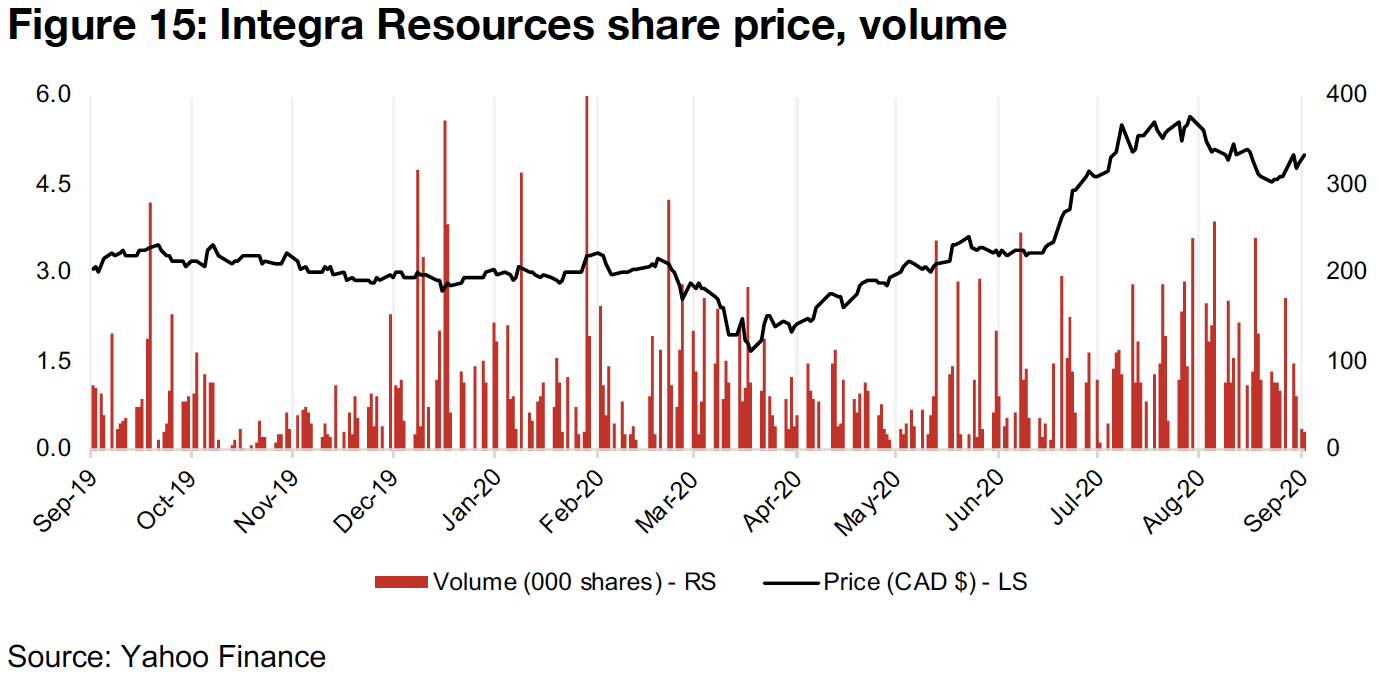
The share price is up 51.2% over the past three months, and 62.3% over the past year (Figure 12, Figure 15), as the company continues to progress on its projects, and is boosted by the jump in gold and silver prices. News flow this year has been focused on exploration results from Florida Mountain and War Eagle, the listing of the company's shares on the NYSE American exchange, where it was previously only available for OTC trading in the U.S., and some updates on permitting for Delamar.
Author
Ben McGregor authors the Weekly Roundup at CanadianMiningReport.com, providing sharp analysis of the metals and mining sector. With a talent for spotting trends, Ben distills complex market shifts into clear, engaging insights on TSXV junior miners. His weekly updates cover gold, copper, uranium, and more, blending data-driven perspectives with a knack for identifying opportunities. A vital resource for investors, Ben’s work navigates the dynamic junior mining landscape with precision.