
February 26, 2021
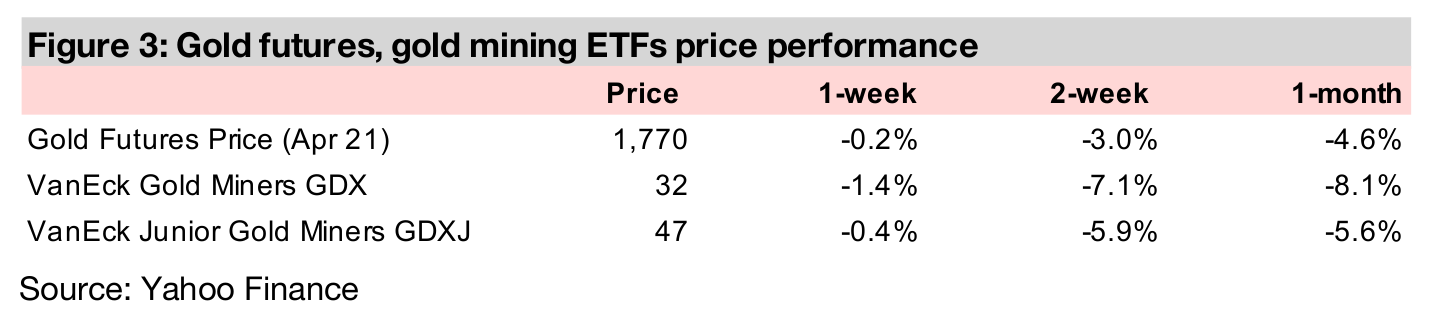
Gold held below US$1,800/oz for the second week in a row, and was near flat, down -0.2% to US$1,770/oz, on a surge in global bond yields, as an explosion in the US money supply growth continues to have some interesting effects on markets.
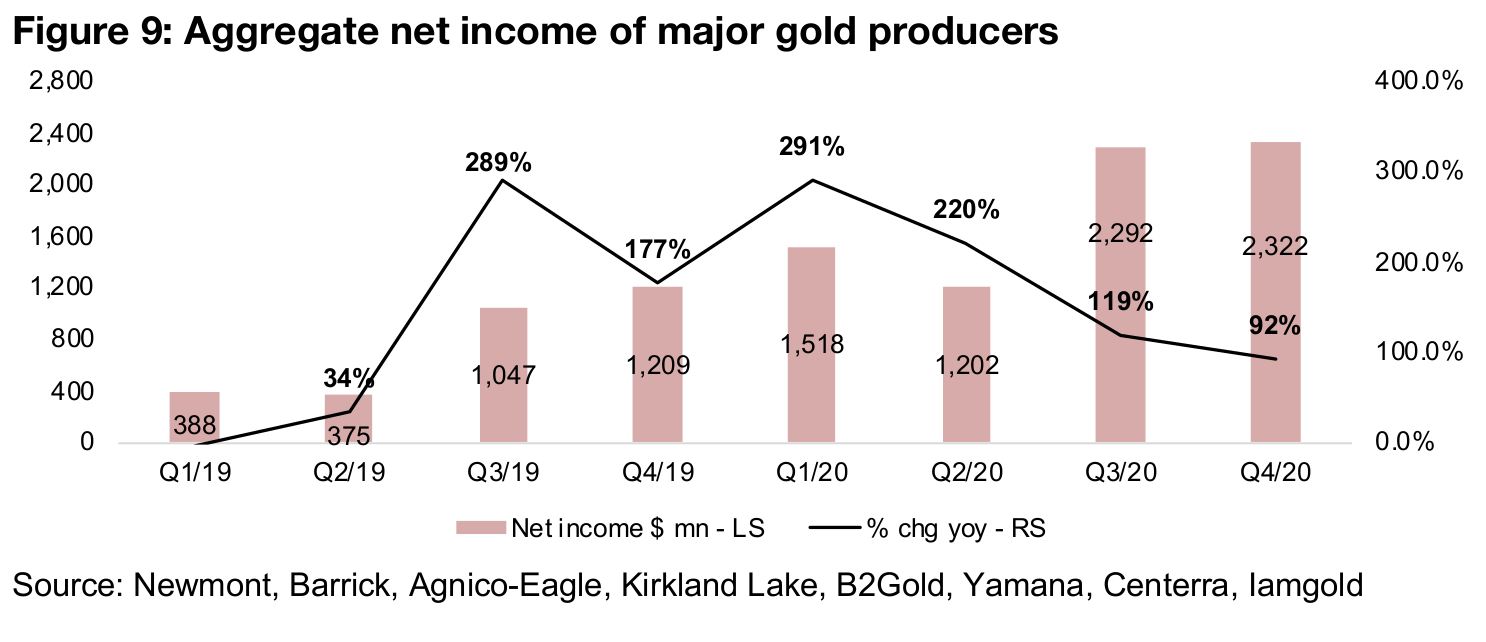
The major gold producers have now reported Q4/20, and while aggregate production for the top eight producers declined -7.1% yoy, revenue rose 19.7% and net income nearly doubled, up 92% as leverage to the high gold price came through.
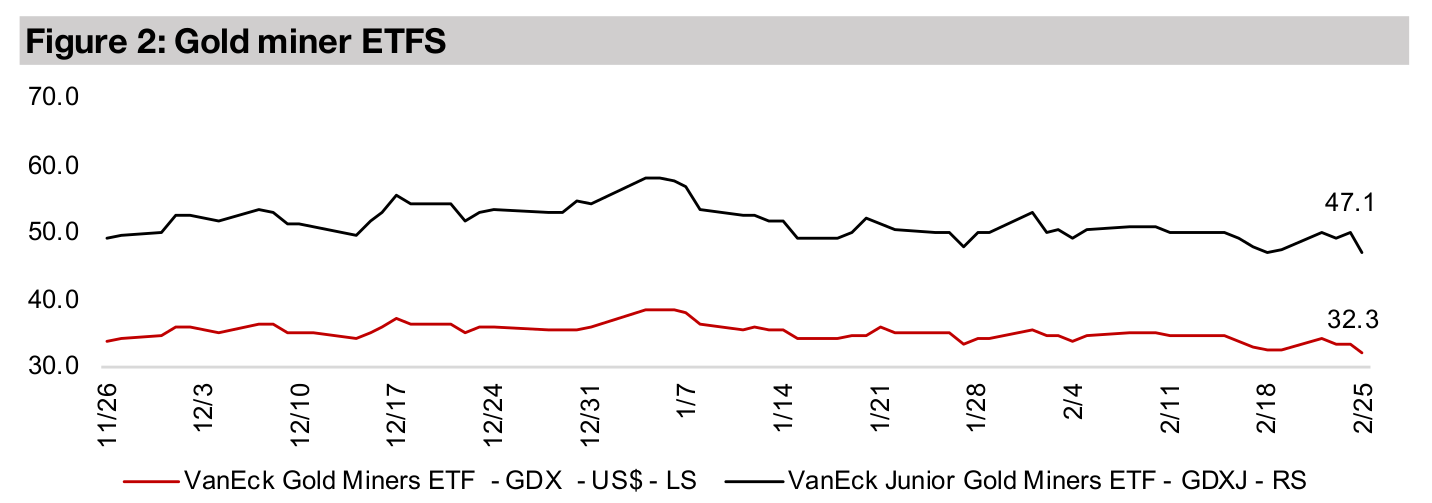
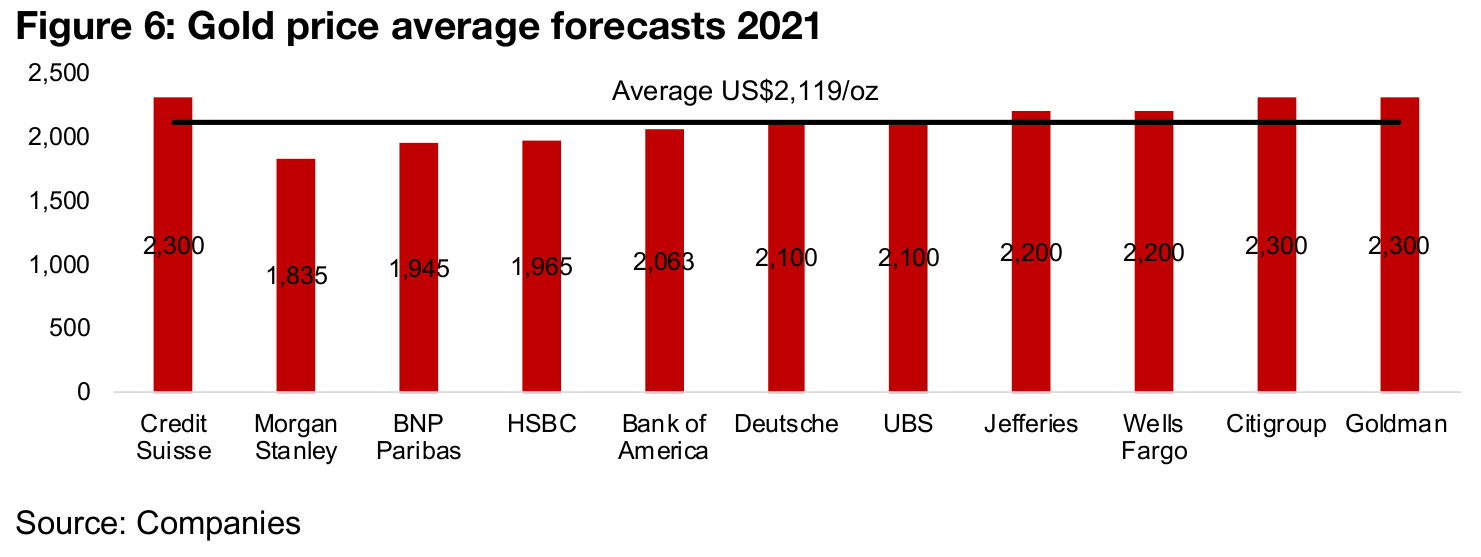
The gold producers and juniors dipped slightly this week, with the GDX down -1.4% and the GDXJ marginally dropping -0.4%, as market forecasts from the major investment banks continue to point to gold above US$2,000/oz on average for 2021.


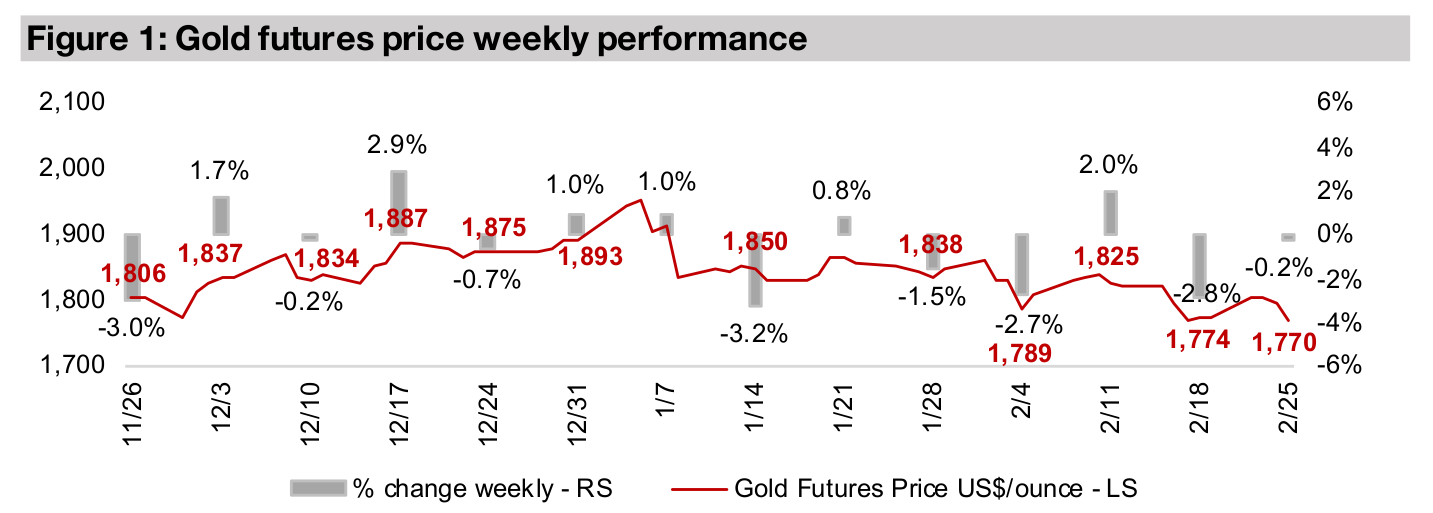
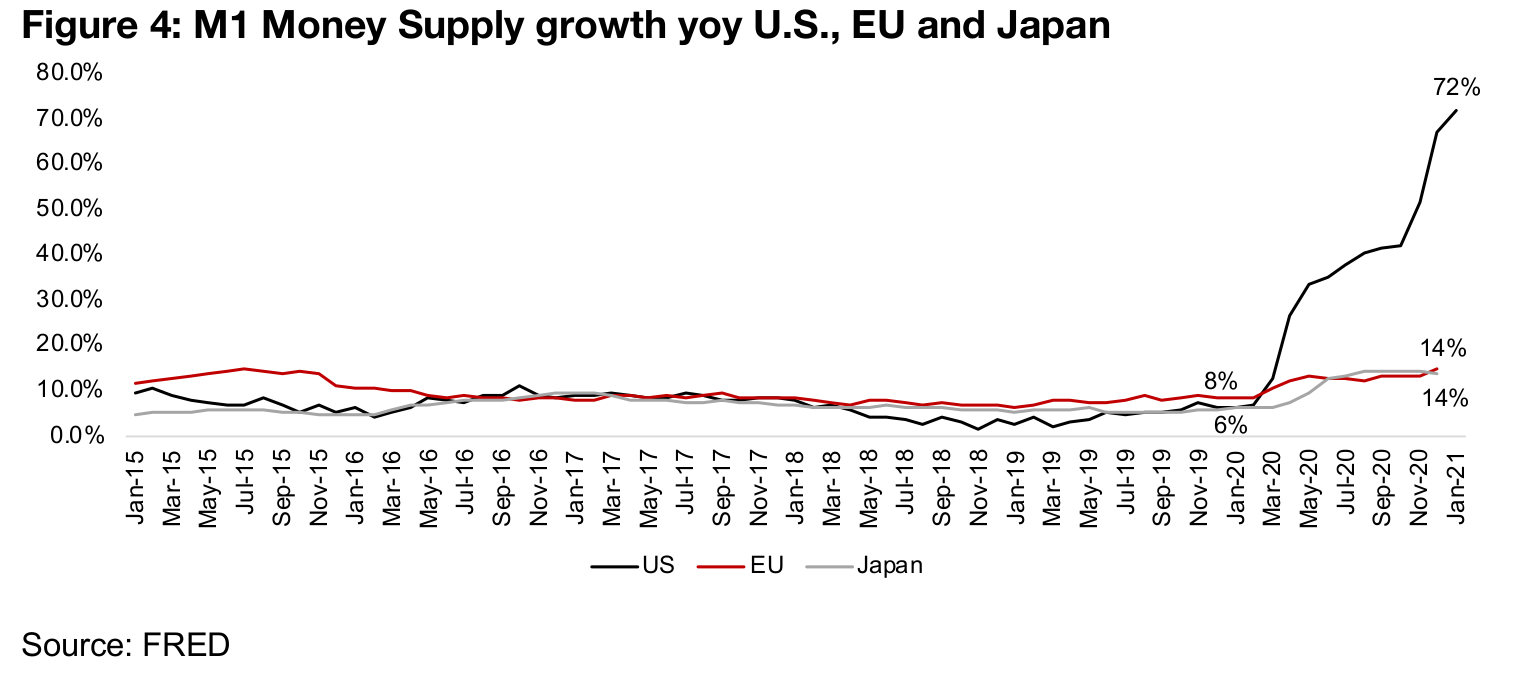
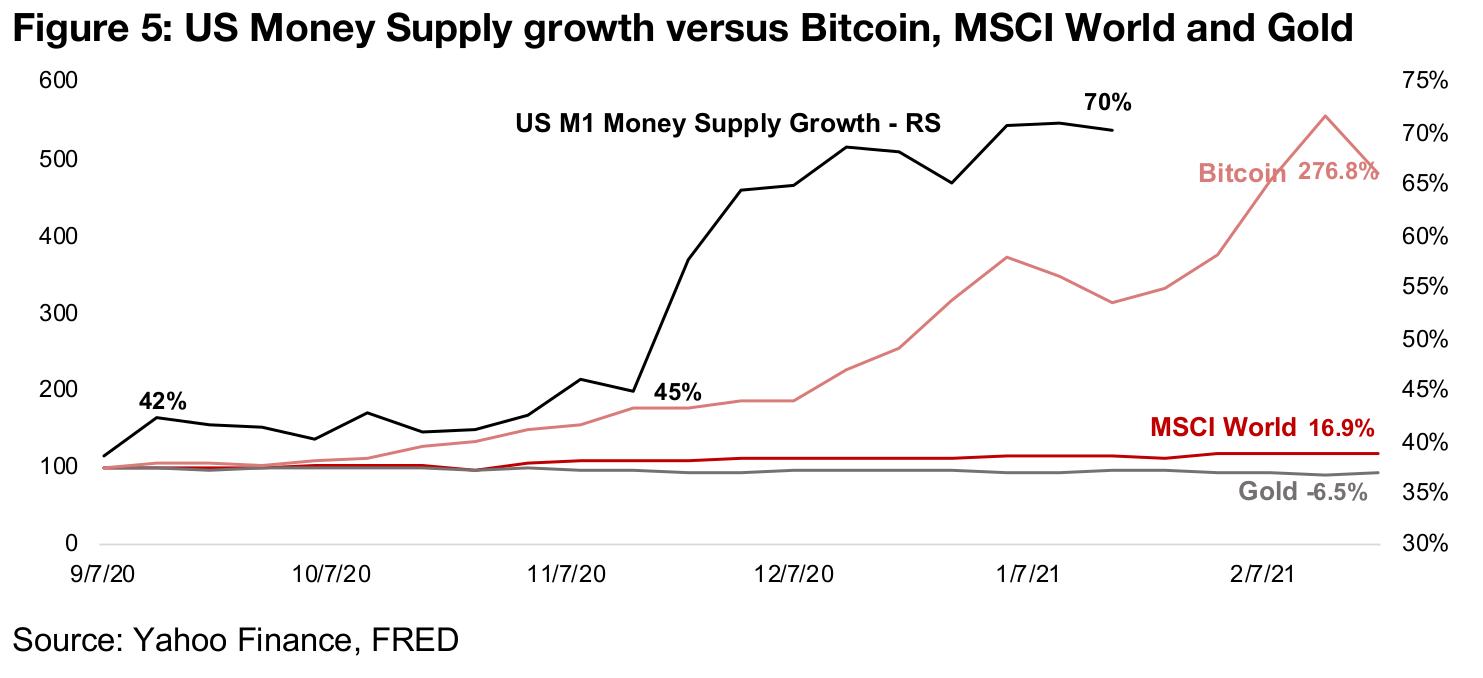
Gold traded below US$1,800/oz for the second consecutive week, but was nearly flat, down just 0.2% to US$1,770/oz, as US yields surged and traders chased the higher rates. However, while gold bears continue to hold gold down below the US$1,800/oz level, we expect that the market will eventually take this as a buying opportunity. Figure 4 says it all; M1 money supply growth continues to go exponential, and this fundamental devaluing of the US$ necessarily should translate to gold at the very least maintaining its value versus the US$, in our view. While compared to the US, the EU and Japan money supply growth looks entirely relaxed, the growth rates are not low in historical terms, and nearly doubled for the EU and more than doubled for Japan compared to January 2020. The monetary expansion is therefore international across the largest, most traded currencies, and while it is not as severe as in the US, regardless, gold should theoretically be gaining value against these currencies.
We are certainly seeing the monetary tsunami spilling over into other assets, with the MSCI World up 16.9% since September 2020 and Bitcoin up a whopping 276.8%, but somewhat suspiciously the liquidity flood is not pushing up gold, which is down -1.4% (Figure 5). We believe that this will not be the case for long, with the major investment banks forecasting a gold price averaging above US$2,000/oz this year (Figure 6). While some have viewed the recent price action in gold as a bearish signal, we believe another leg up may be looming, especially after it has consolidated (or should we say languished?) around US$1,800/oz for a considerable time. For more of our analysis regarding gold and money supply growth see our Weekly report from February 12, 2021. (In Figure 5, notice that the black line for weekly M1 money supply growth stops a month ago - this is because the Fed discontinued it. And while the monthly series is still available, it has been rebased from May 2020, so we can no longer calculate a meaning yoy growth rate, which is interesting given that growth in these series was becoming exponential).
Gold production for the top eight major producers in aggregate declined -7.1% yoy to 4,454k oz in Q4/20, the third straight quarter of yoy declines, with production down -12.8% in Q1/20 and -1.9% in Q2/20 (Figure 7). While the dip in Q2/20 and Q3/20 was partly driven by the global health crisis shutdowns, this was not a major factor in Q4/20. Production growth had already been generally trending down off a peak of 20.5% in Q2/19 even in advance of the crisis, and while the Q2/20 dip was below trend, actually the Q4/20 looks inline with the downward trend. We have to consider that the current production environment is largely based on production decisions made two or more years ago, as there is a significant lag between production decisions and actual output. And given that two or more years ago the industry was still at the tail end of an extended gold price slump, producers were not particularly inspired to expand production. We could conceivably see producers look to expand production now given the current improved gold price environment, but the effect of these decisions will take some years to appear in production figures.
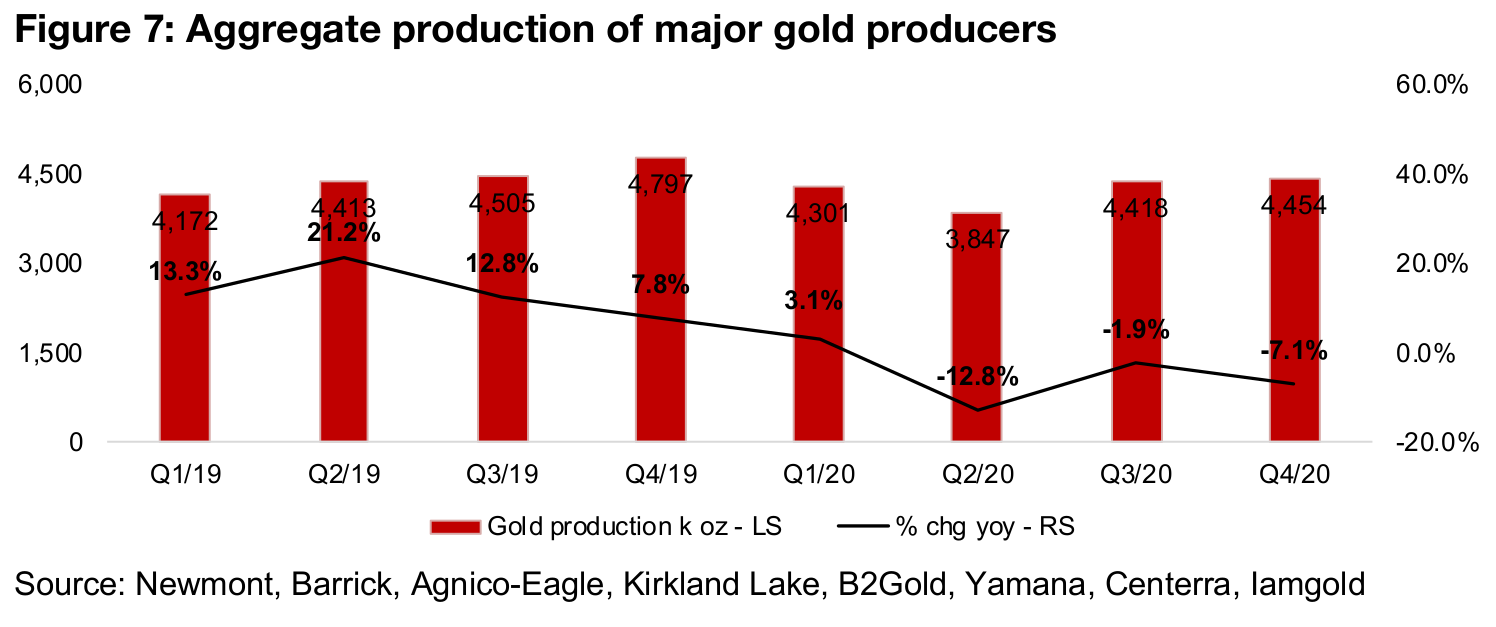
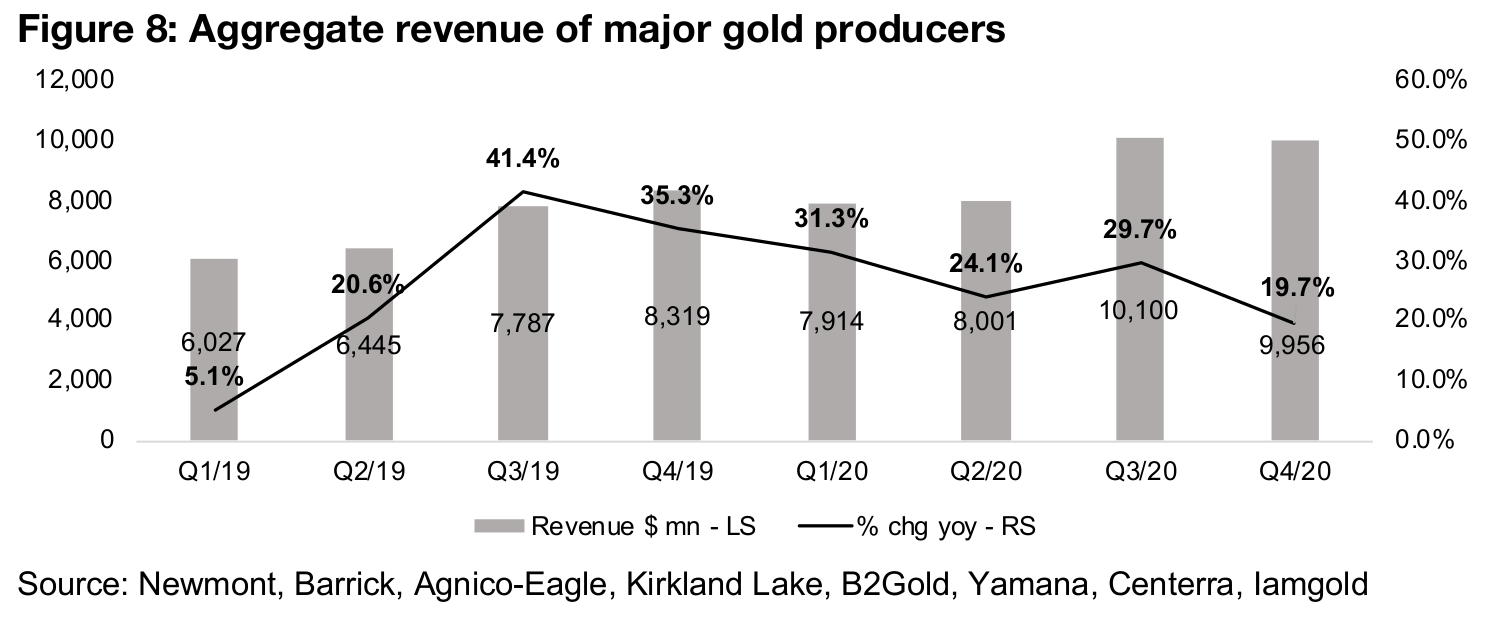
The contraction in production was more than offset by the yoy rise in the gold price, with revenue growth for the quarter a reasonably strong 17.6% yoy. The growth rate has generally come down from a peak in Q3/19, as a continued strong rise in the gold price yoy was offset by the production declines outlined ab'ove (Figure 7). However, net income growth saw another outstanding quarter, up 92%, nearly doubling yoy, as the gold producers' leverage to the gold price continues to come through (Figure 8). Gold producers have a relatively fixed costs of production over the short to medium-term so any rise in price above that level drops right to the bottom line, a phenomenon we have seen for the last six quarters of massive net income growth yoy. However, the net income growth has been trending down, from peaks in Q3/19 and Q1/20, as yoy gains in the gold price were at their peaks in those quarters, and also as production growth has been trending down.
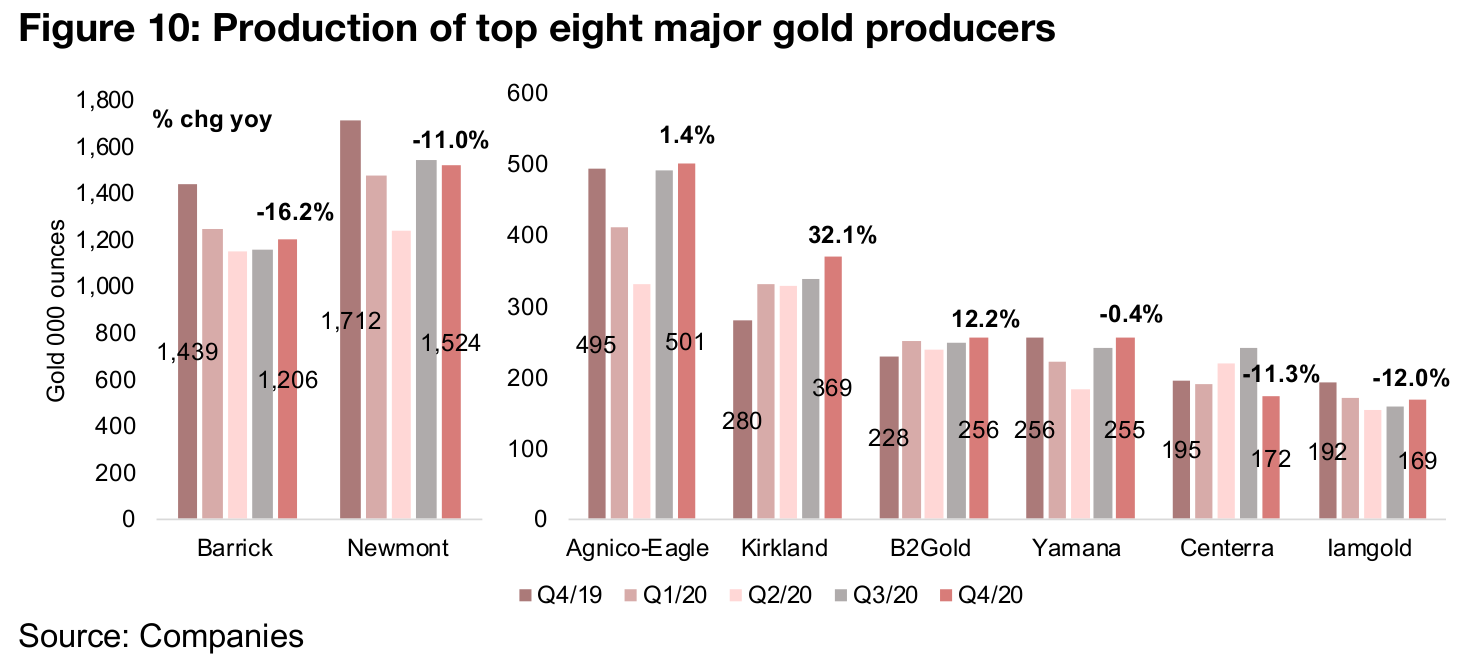
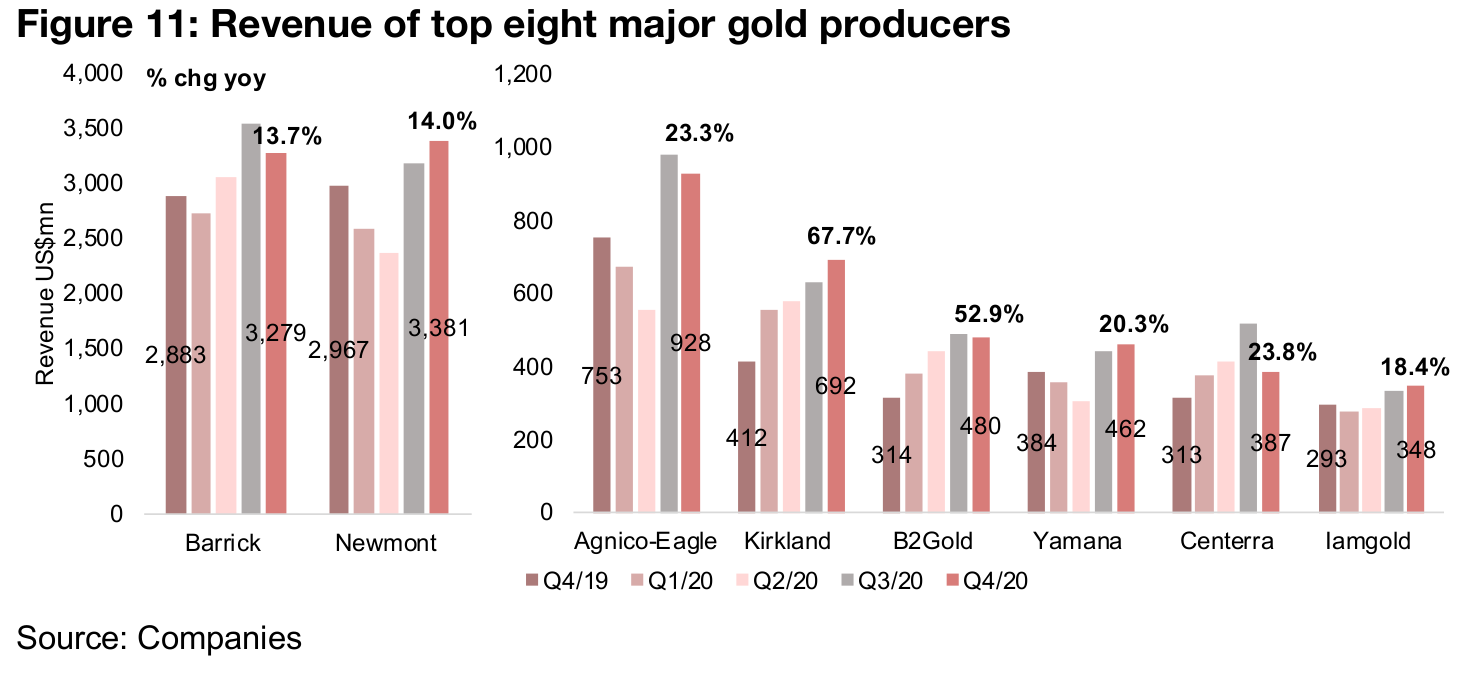
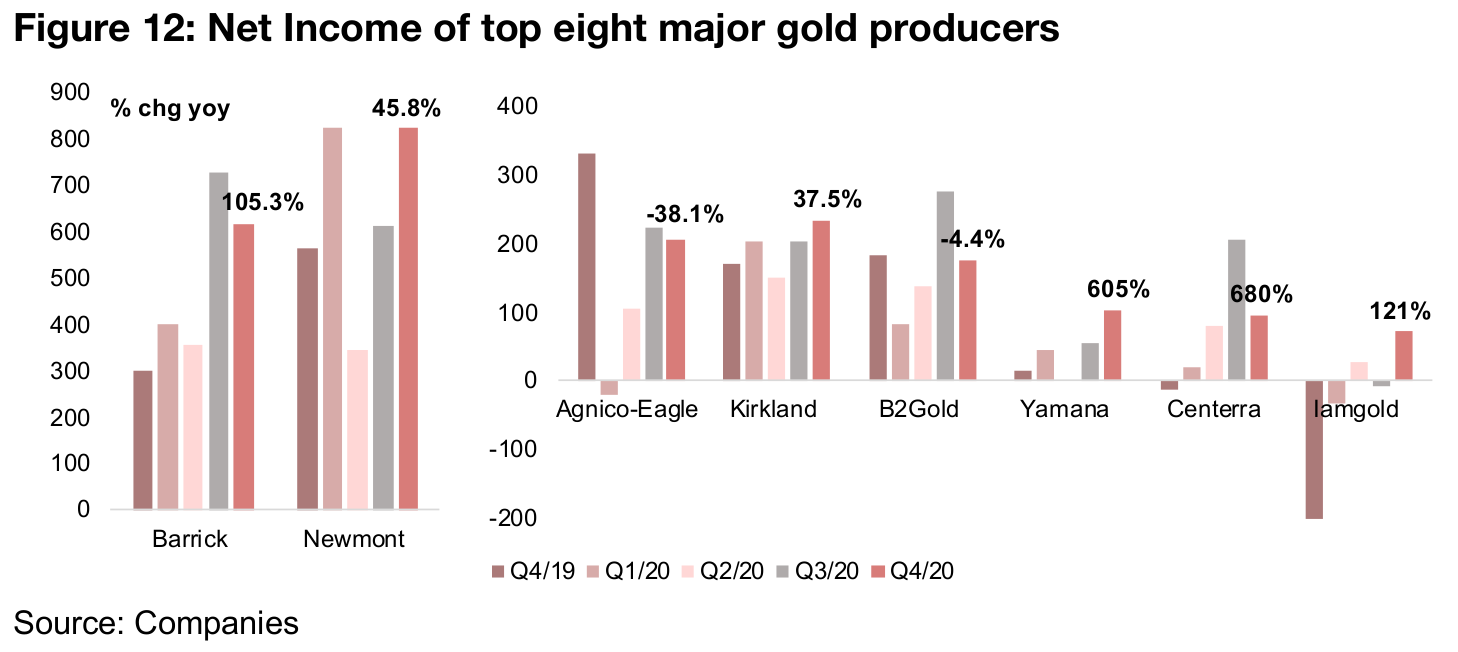
The decline in production has been driven by Newmont and Barrick, by far the largest players in the industry, which saw production down -16.2% and -11.0%, respectively in Q4/20 (Figure 10). Production at the mid-sized players picked up yoy in Q4/20, with Agnico edging up 1.4% and Kirkland up 32.1%. For the other companies, B2Gold production was up 12.2%, Yamana was near flat, Centerra declined -11.3% and Iamgold dropped -12.0%. Revenue growth, however, was strong across the board, on the rising gold price, with Barrick up 13.7% and Newmont up 14.0%, but the really outstanding growth rates came from mid-sized players, with most up at 20% or above (Figure 11). Net income growth was generally robust, with Barrick up 105.3% and Newmont up 45.8%, although for the mid-sized players, rates ranged substantially, as in some cases extra items or acquisitions affected net income, and the figures did not necessarily indicate performance at the operating level (Figure 12).
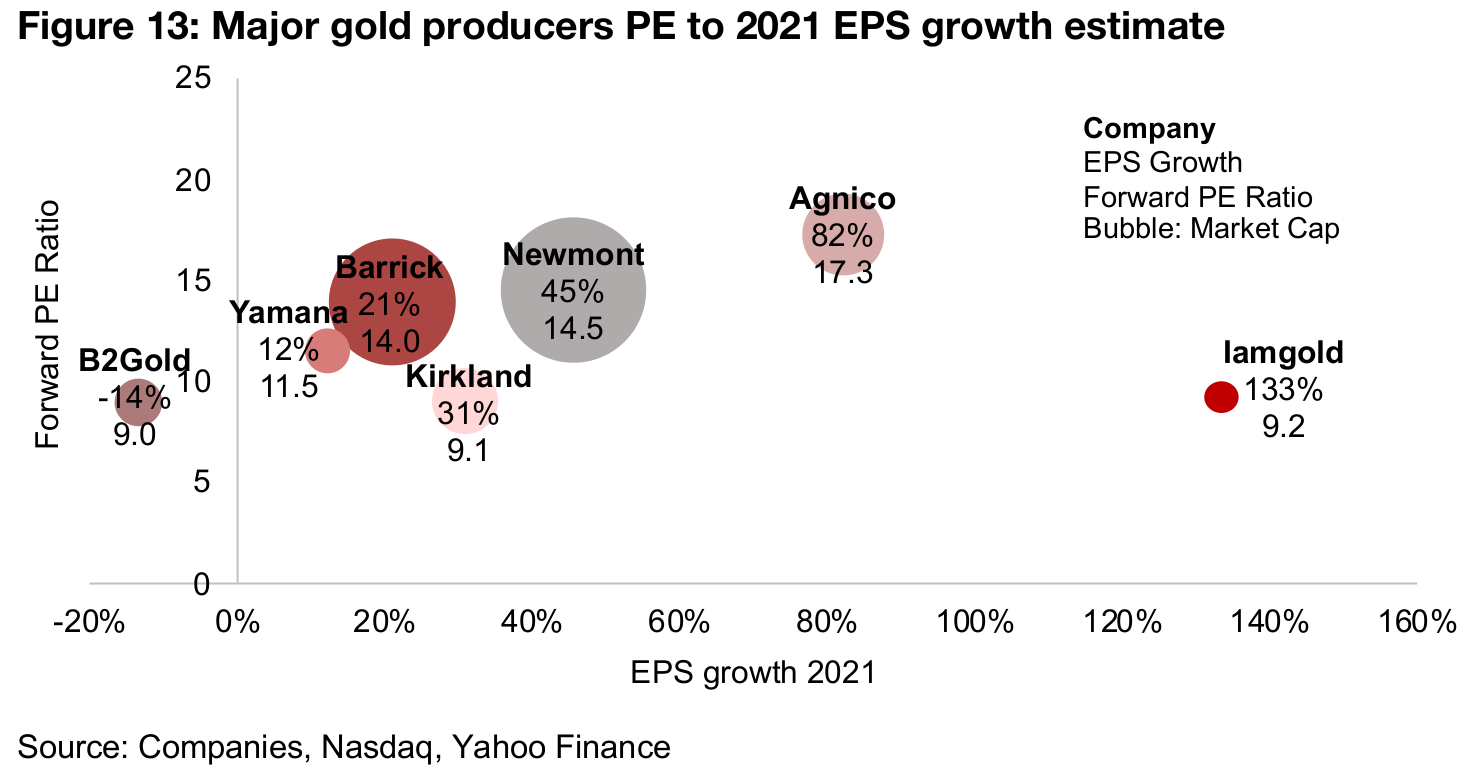
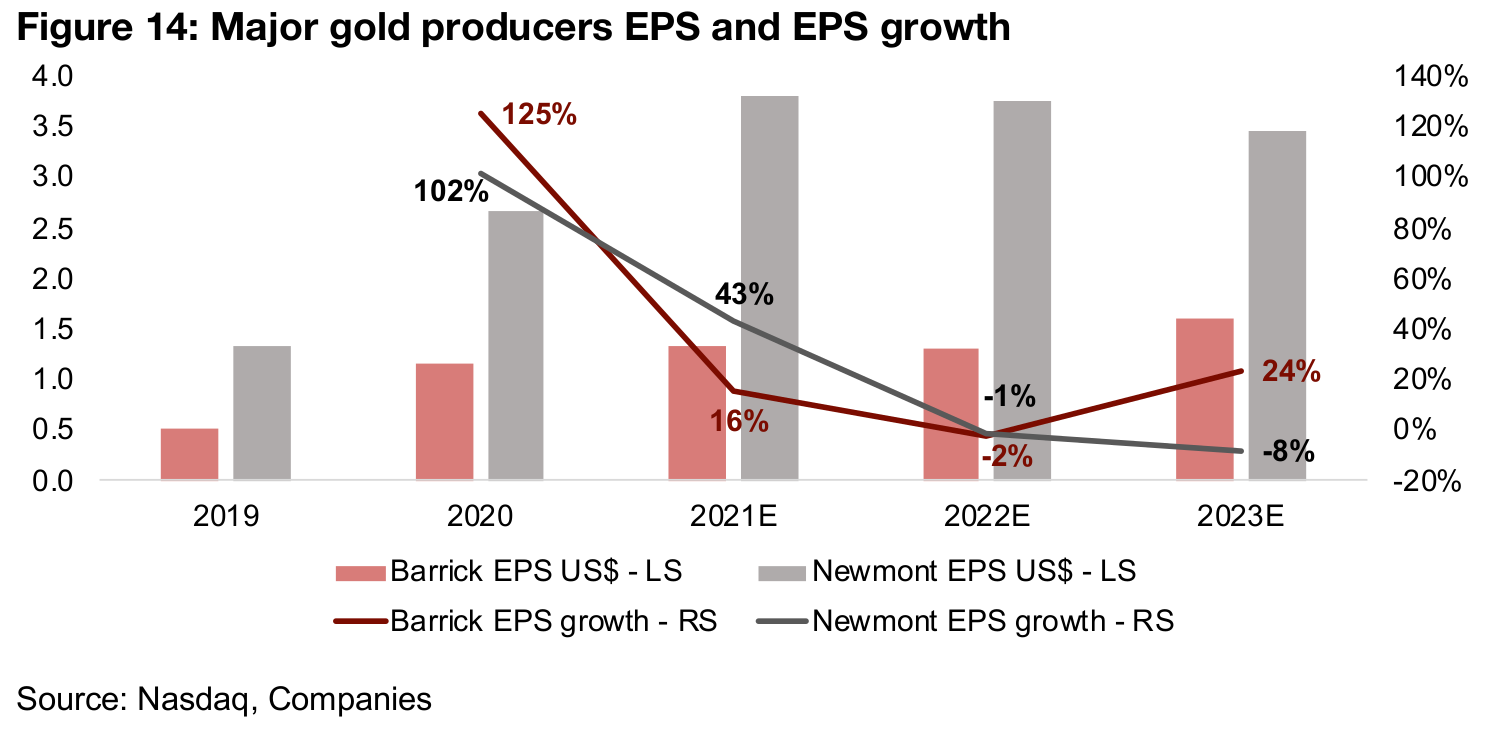
We show the forecast EPS growth for 2021, compared to the forward PE ratio, with the bubble size the market cap, of the major gold producers in Figure 13. The market is valuing Barrick, at 14.0x, and Newmont, at 14.5x, around the same level, although the expected EPS growth of Newmont, at 43% is much higher than Barrick, at 16% for 2021 (Figure 14). However, looking further out at the three-year forecast EPS growth, the market is expecting a similar dip for both in 2022, but then for Barrick growth to outpace Newmont in 2023, which would explain the similar valuation levels, even with lower Barrick growth this year. The market is affording the highest multiple to Agnico-Eagle, with a 17.3x forward PE, given its particularly strong expected EPS growth this year of 82%. While Iamgold has strong forecast growth for 2021 of 133%, its PE is more around the level of Kirkland with 31% growth, and B2gold, with -14% growth, suggesting that the market expects similar long-term growth for these companies, while Yamana trades at a slight premium to this group, at 11.5x.
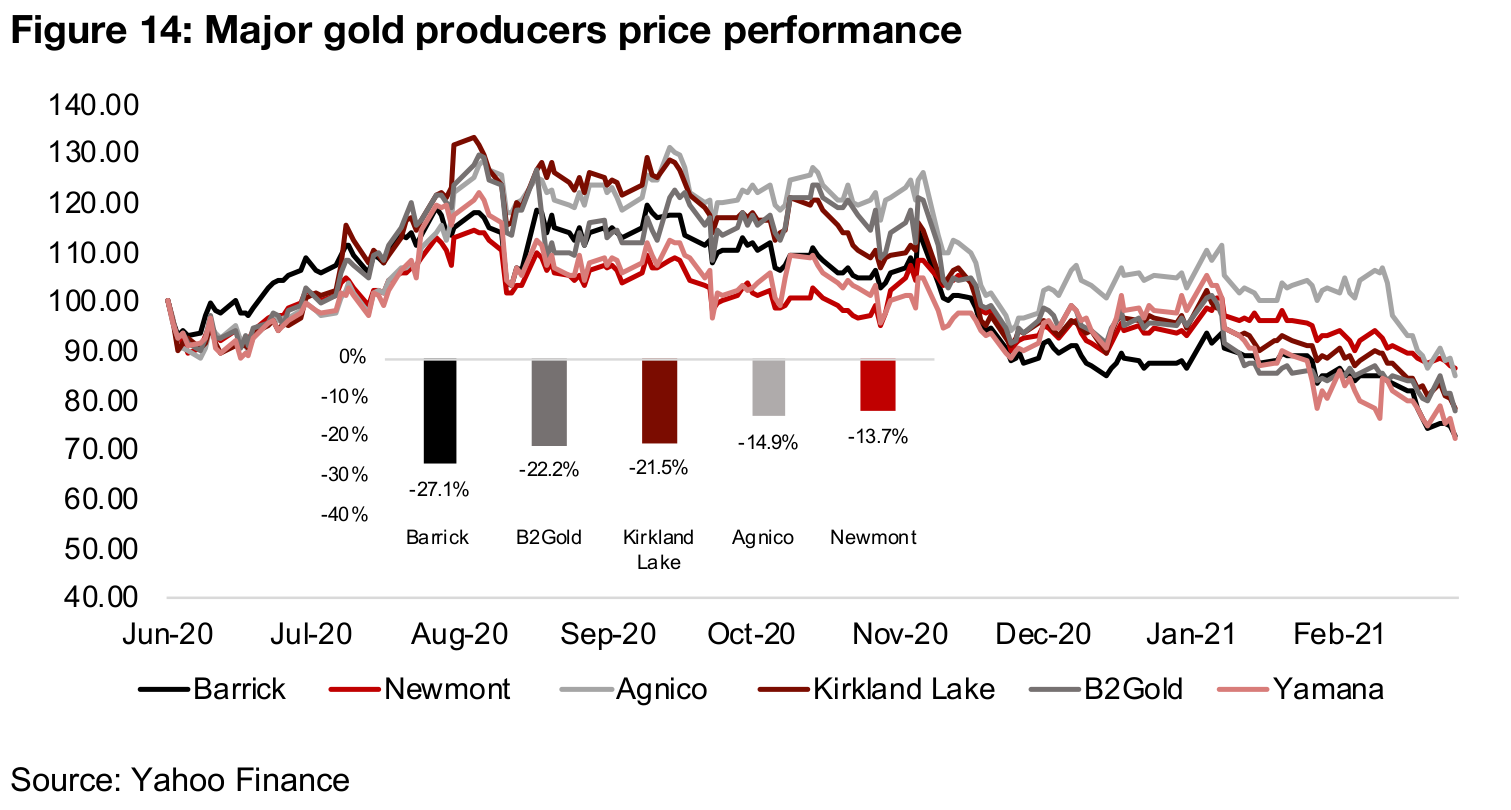
The major producers have continued to trend down since mid-2020, as even though the financial results have been strong, the gains have been contracting moderately, and the global health crisis related surge in the gold price peaked in mid-2020. Nonetheless, we believe that the gold price will pick up again in 2021, and head for US$2,000/oz, along with most of the major investment banks, and we could therefore see growth be maintained for some time. However, it is true that it is not likely to reach the growth seen in recent periods, as in percentage terms, the gold price boost from 2019 and 2020 is unlikely to be repeated this year.
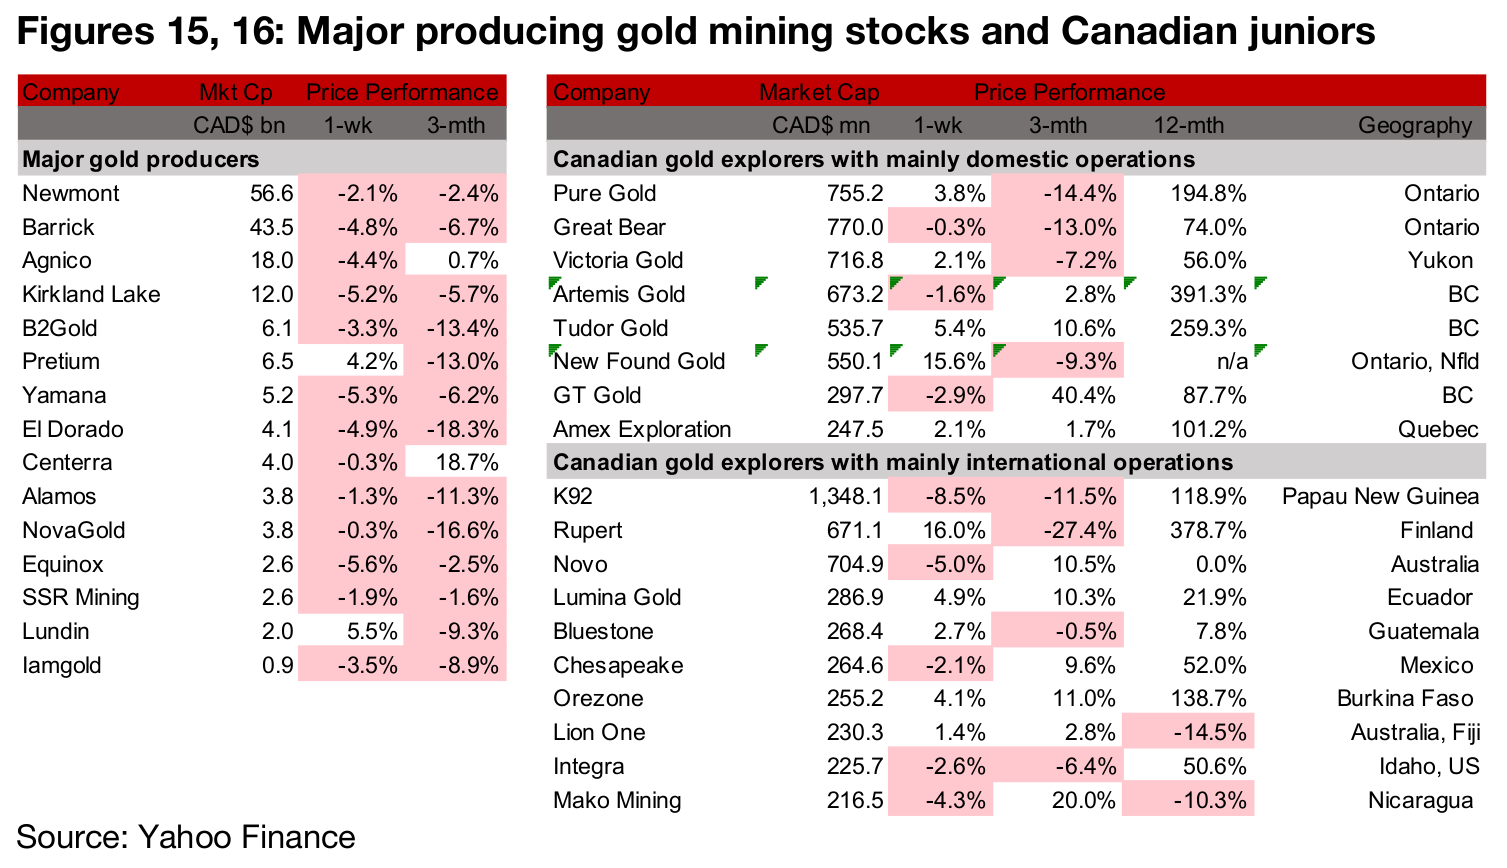
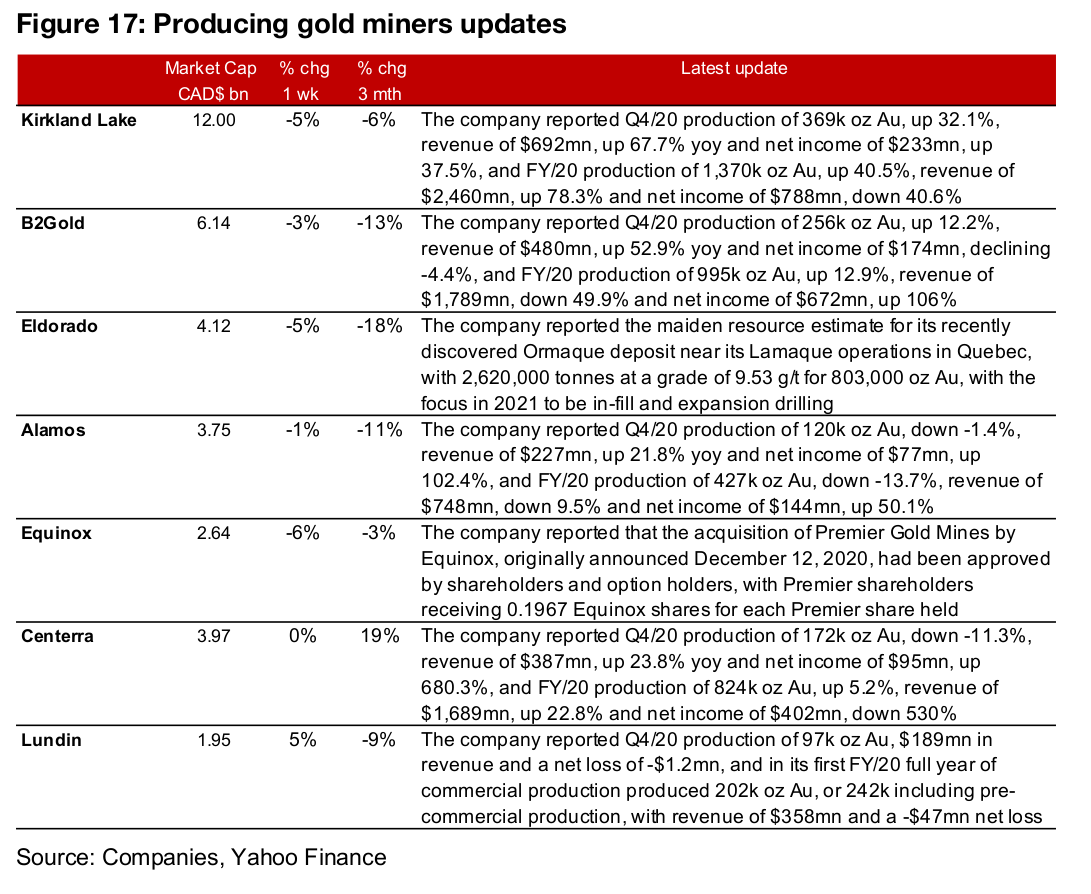
The producing miners were mainly down this week, as the two-week lull in gold seems to have offset even a strong Q4/20 results season, which has mostly been completed (Figure 15). Results were from the mid-tier gold producers this week, with Kirkland Lake, B2Gold, Alamos, Equinox, Centerra and Lundin all reporting (Figure 17). Eldorado reported its maiden resource for the Ormaque deposit near its Lamaque operations in Quebec and Equinox received shareholder approval for its acquisition of Premier Gold Mines.
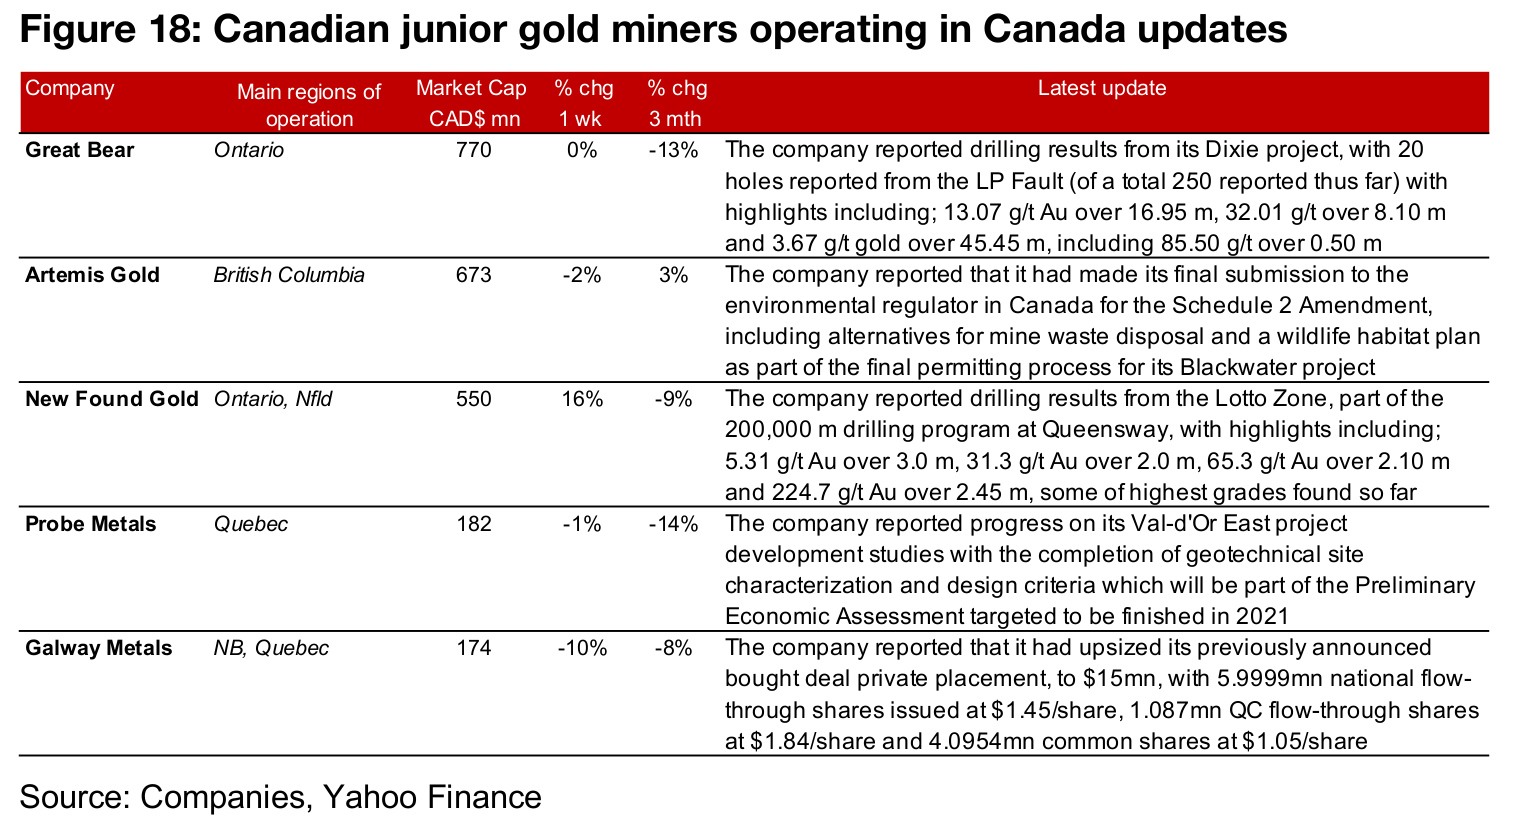
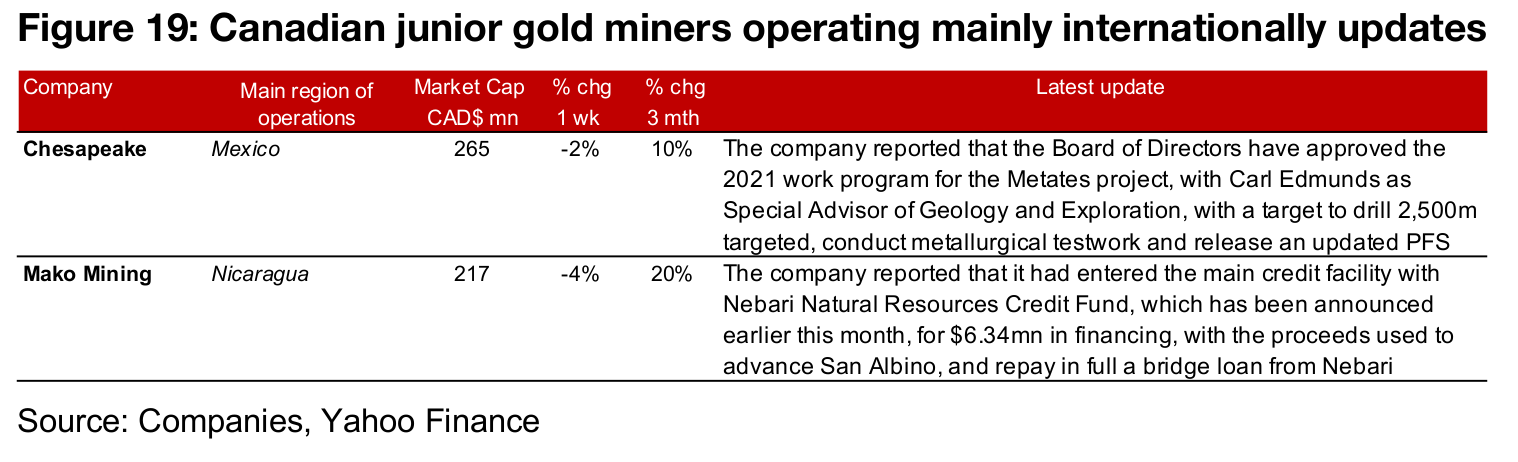
The Canadian junior miners were mixed this week as the market seemed to focus more on company specific factors for the sector, with gold remaining relatively flat (Figure 16). For the Canadian juniors operating mainly domestically, Great Bear reported drilling results from Dixie, Artemis reported the final submission for some environmental approvals and New Found Gold reported drilling results from the Lotto Zone. Probe reported progress on its Val d'Or East project development studies and Galway upsized its previously announce bought deal private placement $15mn. (Figure 18). For the Canadian juniors operating largely internationally, Chesapeake reported that it had approved the Metates project work program for 2021, and Mako entered the main credit facility with Nebari for $6.34mn (Figure 19).
Disclaimer: This report is for informational use only and should not be used an alternative to the financial and legal advice of a qualified professional in business planning and investment. We do not represent that forecasts in this report will lead to a specific outcome or result, and are not liable in the event of any business action taken in whole or in part as a result of the contents of this report.
Author
Ben McGregor authors the Weekly Roundup at CanadianMiningReport.com, providing sharp analysis of the metals and mining sector. With a talent for spotting trends, Ben distills complex market shifts into clear, engaging insights on TSXV junior miners. His weekly updates cover gold, copper, uranium, and more, blending data-driven perspectives with a knack for identifying opportunities. A vital resource for investors, Ben’s work navigates the dynamic junior mining landscape with precision.