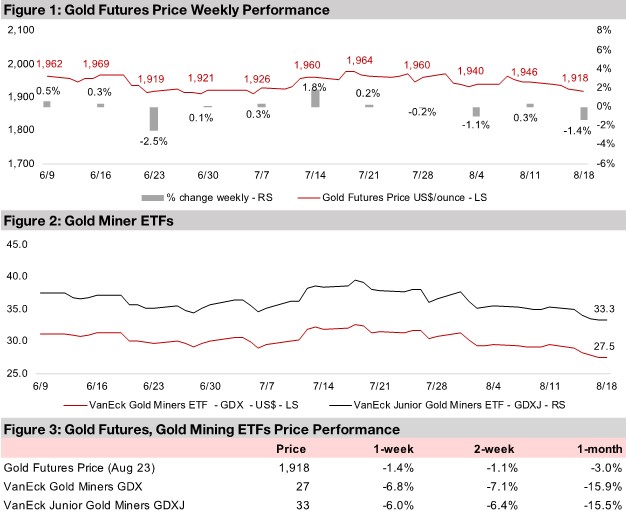
The gold price declined -1.4% to US$1,918/oz as the US dollar and bond yields rose, China cut rates on slowing growth and there was a broad market selloff, with the S&P down 1.98% for the week, its weakest performance since March 2023.
Gold stocks plunged with the GDX losing -6.8% and GDXJ off -6.0% on a combination of a falling gold price and a small cap market rout with the Russell 2000 down -3.15%, while the larger TSXV gold juniors were nearly all down.


Gold fell -1.4% this week to US$1,918/oz, as fear clearly returned to markets, with the S&P 500 down -1.98%, its worst performance since March 2023 during the banking crisis. While we might have expected rising risk aversion to drive up gold, the metal was pressured by a rising US$ and bond yields, especially as China cut rates, driving fund flows into the US dollar given the sudden rise in the relative attractiveness of its returns. Gold stocks took a big hit, with the GDX ETF of producers down -6.8% and GDXJ ETF of gold juniors down -6.0%, about double the losses of US small caps, with the Russell 2000 down -3.15%. Given the big shift to risk off, the underperformance appeared justified, with the juniors particularly risky among the small caps, as they tend to have no revenue, and the downturn was exacerbated by the decline in the gold price. The big risk for gold stocks remains that even if gold continues to rise along with economic and geopolitical risks, that this is offset by an overall decline in equity markets, especially small caps. However, this was not the case this week, with a reasonably significant pullback in gold a key driver, in addition to the weak equity markets. Major forecasters expecting broad metals sector slowdown for 2024 This week we look at the evolution of forecasts for major metals from two key sources that report regular data, Australia’s Office of the Chief Economist (AOCE), which releases its targets in each calendar quarter, and the World Bank (WB), which releases its commodity outlook in April and October. With 2023 now well over halfway complete, the markets are starting to look towards 2024, and overall both of these sources look bearish, predicting price declines next year for most of the metals (Figures 4, 5). Only aluminum stands out for a forecast rise in prices from both sources, while lithium is expected to see the biggest drop, as it continues to revert from its 2021-2022 spike. Figure 4: Metals Price Forecasts Change 2024
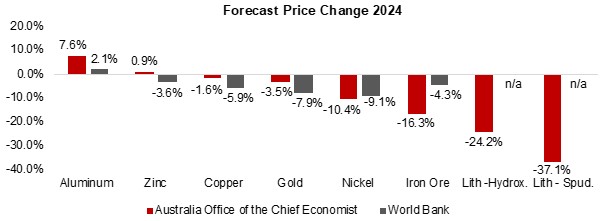
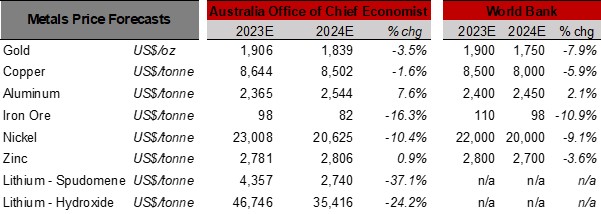
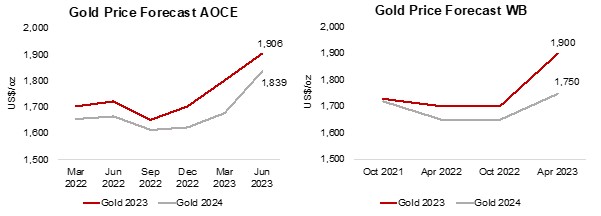
Both the AOCE and WB remain bearish on gold for 2024, expecting a decline of -3.5% and -7.9% respectively. However, they have had to play catch up with the 2023 gold price in their most recent reports, from the AOCE in June 2023 and the World Bank in April 2023, after significantly underestimating the gold price through 2022 (Figures 6, 7). As a weak gold price tends to imply a strengthening economy, and a move away from safe havens, looking only at these gold forecasts it could appear that the AOCE and WB are adopting a bullish stance on the global economy for next year. However, this contradicts the negative outlook for the industrial cycle implied by the AOCE’s and WB’s forecast declines in the major base metals. While we believe that the bearish industrial metals’ forecasts could prove correct given growing recession fears, this does not indicate a decline in the gold price in our view. In contrast, we would expect that with such a cyclical decline, that there could be rising risk aversion and a move into safe havens like gold.
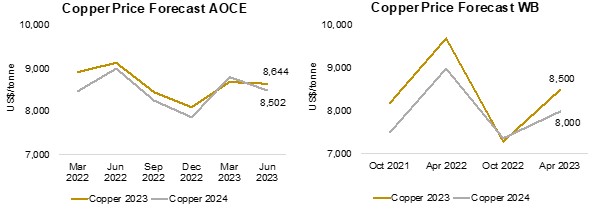
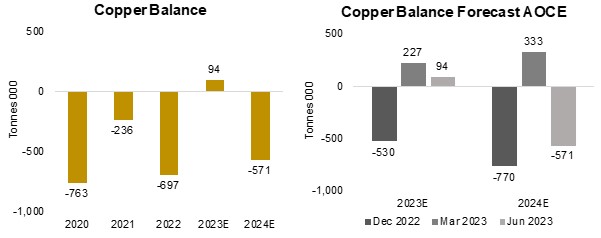
AOCE forecasts a -1.6% decline in the copper price in 2023 and the WB a more severe -5.9% drop. The copper estimates have swung substantially over the past year, spiking over H1/22, plunging in H2/22 and rebounding in the latest reports (Figures, 8, 9). Bullishness in early 2022 was driven by a developing deficit that year which eventually reached -697k tonnes (Figures 10, 11), but by end-2022 the market was looking ahead to a 94k tonnes 2023 surplus forecast by the AOCE (the WB provides only price forecasts and not detailed supply and demand statistics for the metals). AOCE’s copper balance forecast has also swung considerably over the last three quarters on an unclear demand outlook. (While AOCE reports a similar market balance for gold, we exclude it above as gold tends to be driven more by the money supply, US$ and real bond yields than by the reported supply and demand factors).
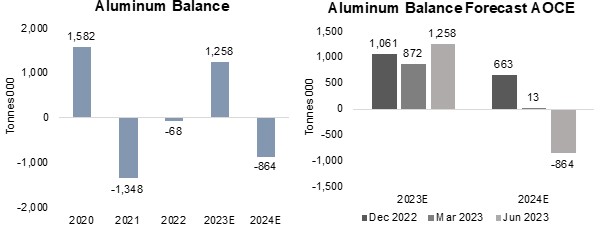
Aluminum is the only metal with a clearly bullish outlook from both the AOCE and WB, with forecasts of a 7.6% and 2.1% gain in 2024, respectively. However, this has come only after major downgrades to price estimates from both since 2022, driven by an increasing expected surplus from the AOCE for 2023 from 1,061k tonnes in December 2022 to 1,258k tonnes in Q2/23 (Figures 12, 13). However, the bullish outlook for next year appears to have been driven by an expected shift to a deficit in 2024 of -864k tonnes, with the AOCE as recently as December 2022 expecting a surplus for next year of 663k tonnes (Figures 14, 15). Figures 12, 13: Aluminum Price Forecasts

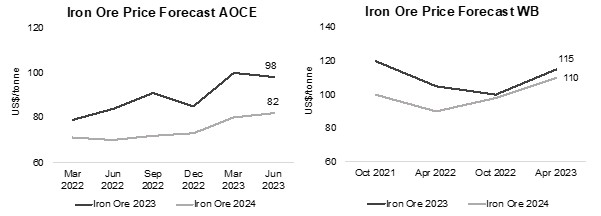
Rise in iron ore price forecasts could end on weaker China data In contrast to copper and aluminum with their recent downgrades, iron ore forecasts have seen consistent upgrades through 2022 and 2023 from both the AOCE and WB (Figures 16, 17). With the majority of iron ore production and consumption coming from China, this reflected the improved economic outlook for the country as it exited lockdowns. However, both the AOCE and WB are expecting significant declines in the iron ore price in 2024, by -16.3%, and -10.9%, respectively, implying a slowdown in China next year. With weak data coming out of China for the past few weeks and the rates cuts this week to stimulate the economy, the outlook for iron prices could lean more towards downgrades than upgrades in the next round of forecasts by the AOCE and the WB. (The AOCE does not report demand and supply data for iron ore). Figures 16, 17: Iron Ore Price Forecasts
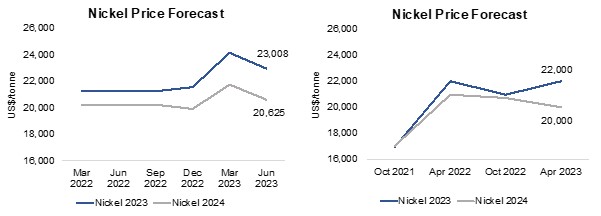
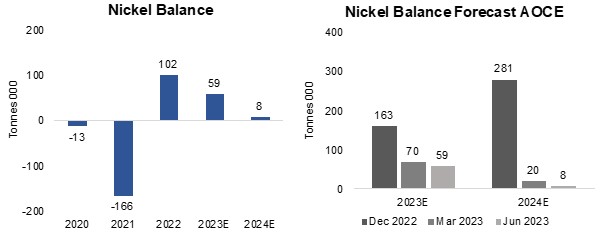
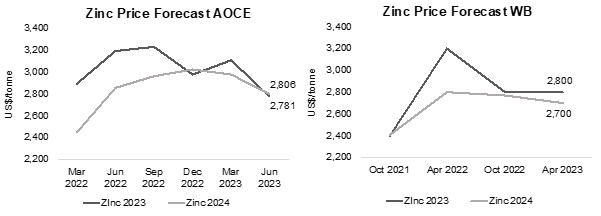
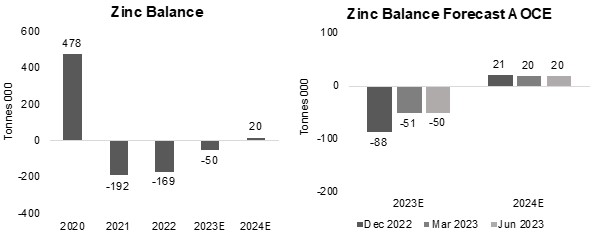
Nickel forecasts from the AOCE were flat through 2022, picked up in Q1/23 and then were pared in Q2/23, and for WB dipped through 2022, with the 2023 estimate rising in the April 2023 report, but the 2024 forecast declining (Figures 18, 19). Both are expecting similar significant declines in nickel for 2024, by -10.4% and -9.1%, respectively, as the market shifts into surplus. However, the forecast surplus plunged from 281k tonnes in December 2022 to just 8k tonnes as of Q2/23 (Figures 20, 21). Zinc price forecasts have trended down since 2022 for both sources, with 0.9% gain expected for 2024 by the AOCE and -3.6% decline forecast by the WB (Figures 22, 23). The deficit in the market has contracted since 2021, with a surplus expected by 2024, with AOCE’s forecast remaining flat around 20k tonnes for the past three quarters (Figures 24, 25). The majority of demand for both nickel and zinc are for steel production, at 70% and 50%, respectively, indicating a cooling outlook for steel.
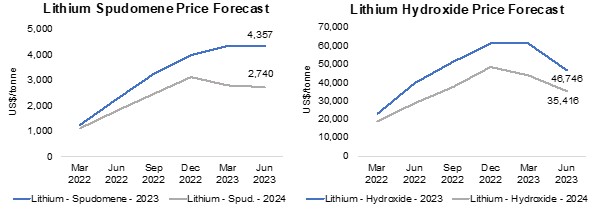
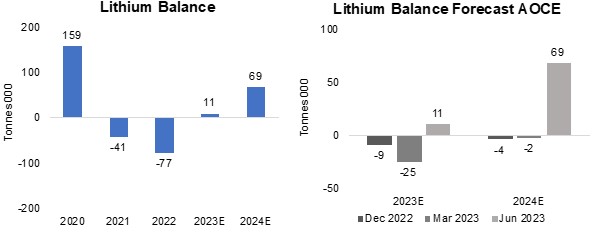
There are only AOCE price forecasts for lithium, with the metal not included in the WB’s update, and they increased substantially through 2022 to catch up with the surprise boom in the metal (Figures 26, 27). However, for spodumene, the 2023 estimate flattened in Q2/23 and declined for 2024, and for lithium hydroxide, the estimates have come down considerably for both years off a peak in December 2022. This has been because after two years of major deficits in 2021 and 2022, the market is expected to enter a small 11k tonne surplus this year (Figures 28, 29). This surplus is forecast to widen to 69k tonnes in 2024, which is a substantial shift from the marginal deficit that had been forecast in previous two quarters.
For the junior miners, we believe that this analysis points to junior gold stocks possibly being better positioned heading into 2024, given our expectation that the AOCE and WB forecasts for the gold price could well undershoot, as they have for several years. For the base metals stocks, however, we believe that the outlook is relatively weak, with the AOCE and WB only really bullish on aluminum, for which there are no stocks listed on the TSXV of a reasonably-sized market cap. Other than gold, the TSXV is mainly concentrated in copper and lithium stocks, and the outlook for copper from the AOCE and WB has been volatile over the past few quarters, and is getting more negative for lithium, making them seem like more risky wagers. This is also before we consider the potential for a major widespread small cap sell off, which could take all the junior miners down with it, and still remains a considerable risk. While in such a scenario, the gold juniors could still outperform other junior miners if the gold price rises on a flight to safety, the sector could still face absolute declines if the equity sell-off outpaced gold’s gains.
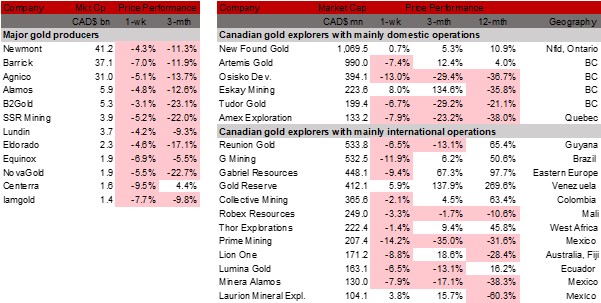
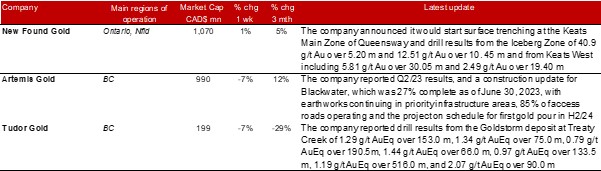
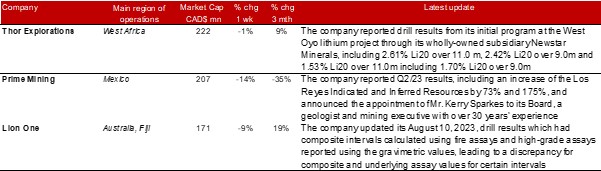
The major gold producers and most of the large TSXV gold stocks declined as the gold price dipped and small cap equity plunged (Figures 30, 31). For the TSXV gold companies operating domestically, New Found Gold announced the start of trenching at the Keats Main Zone and drill results from the Iceberg and Keats West Zones at Queensway, Artemis Gold reported Q2/23 results and Tudor Gold released drill results from Treaty Creek (Figure 32). For the TSXV companies operating internationally, Thor Explorations reported drill results from its initial program at the West Oyo lithium project, Prime Mining reported Q2/23 results and a Board appointment and Lion One updated previously reported drill results (Figure 33).
Disclaimer: This report is for informational use only and should not be used as an alternative to the financial and legal advice of a qualified professional in business planning and investment. We do not represent that forecasts in this report will lead to a specific outcome or result, and are not liable in the event of any business action taken in whole or in part as a result of the contents of this report.
Author
Ben McGregor authors the Weekly Roundup at CanadianMiningReport.com, providing sharp analysis of the metals and mining sector. With a talent for spotting trends, Ben distills complex market shifts into clear, engaging insights on TSXV junior miners. His weekly updates cover gold, copper, uranium, and more, blending data-driven perspectives with a knack for identifying opportunities. A vital resource for investors, Ben’s work navigates the dynamic junior mining landscape with precision.