
July 03, 2023
This week we look at trends in the value of the world gold stock versus the money supply and examine the constituents of the major mining ETFs, with some having considerable overlap, and all having limited exposure to the TSXV mining sector.
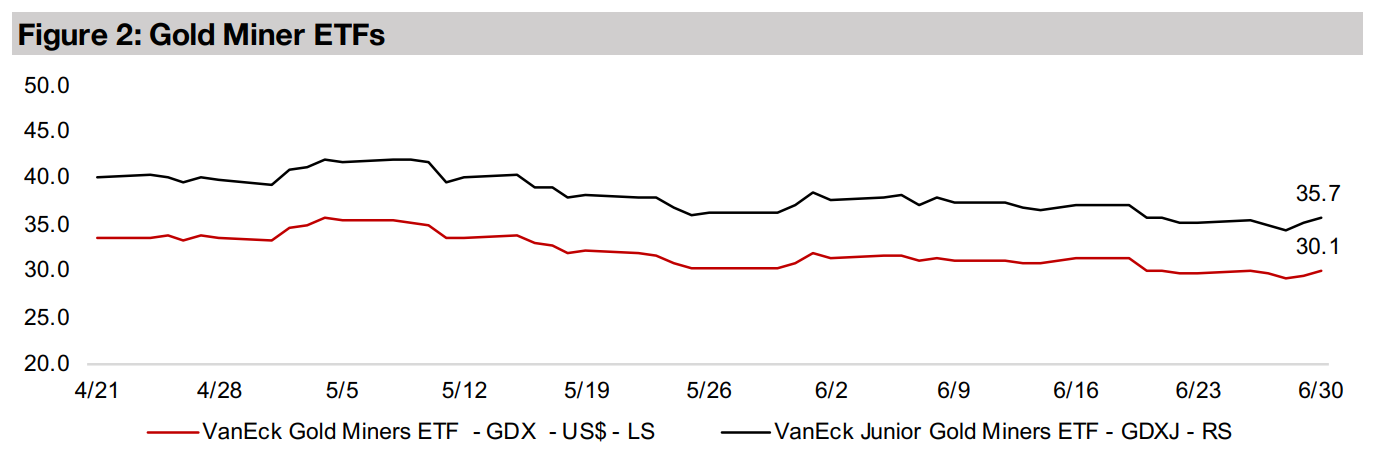
The gold stocks were propelled this week by the rise in the gold price and equity markets, with the GDX ETF of gold producers up 1.1% and GDXJ ETF of junior gold miners gaining 1.3%, while the larger TSXV gold stocks were mixed.


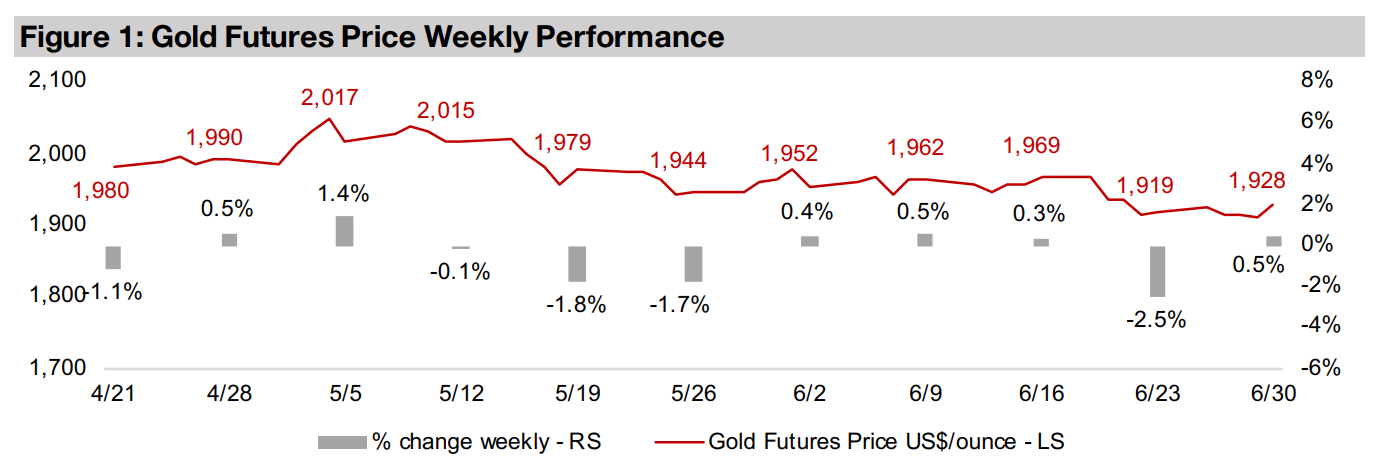
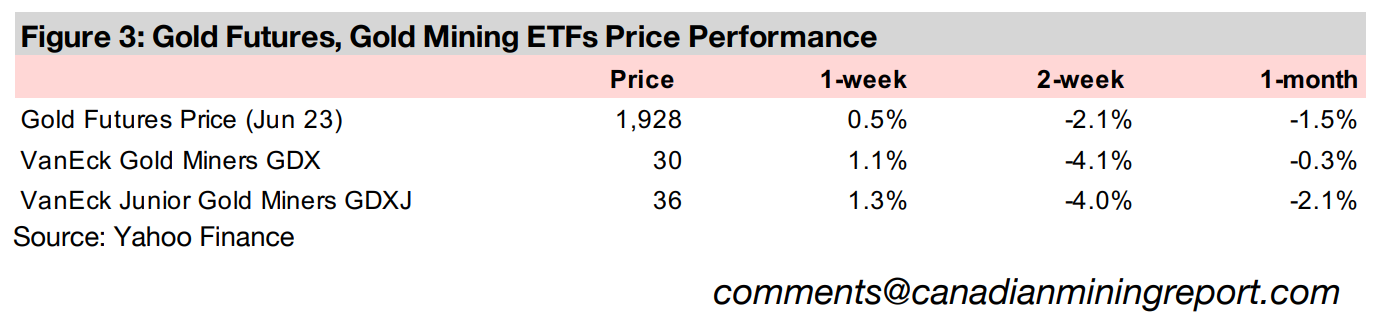
Gold edged up 0.5% to US$1,928/oz, the first gain in four weeks, following a
particularly strong -2.5% drop last week as investors continued to balance the
ongoing tech-driven equity frenzy with at least some backup in gold for safety. The
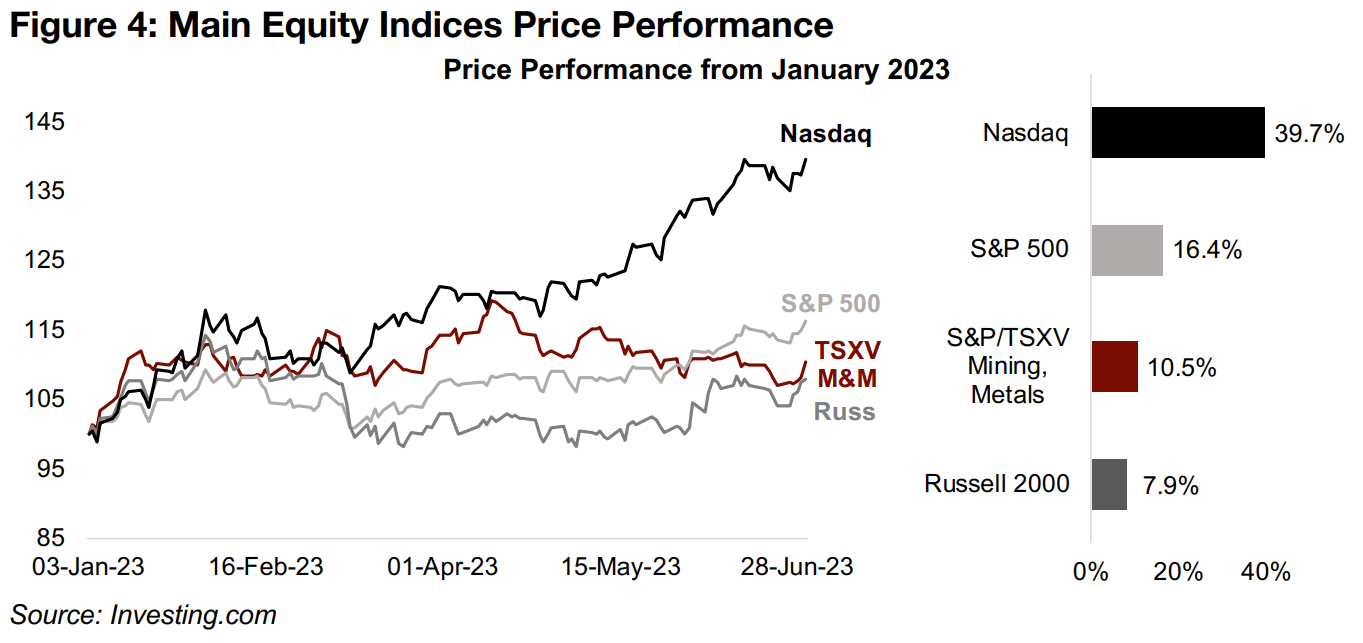
rise in a few mega-caps at the top of the Nasdaq, which has surged 39.7% this year,
has also been responsible for much of the 16.4% gain in the S&P 500 (Figure 4). While
there has been a broader shift towards risk-on in 2023, with the Russell 2000 small
cap stock index up 7.9%, it has not been as strong as the large cap tech surge. This
move back into small caps has bolstered the S&P/TSXV Mining and Metals Index,
which is up 10.5%, actually outperforming Russell 2000, driven especially by a rise in
several lithium stocks with support also from a smaller number of gold stocks.
It remains unclear just how long this bull market can persist, with stock valuations
starting to look high while global recession fears rise as yield curves have become
their most inverted ever in the US, and yield curves for the larger economies of Europe
are heading towards a similar situation. Meanwhile the US M3 money supply has
been seeing its first year on year contraction in at least sixty-years and EU money
supply growth is also rapidly heading for zero. This suggests that the high liquidity
that tends to be the lifeblood of equity bull markets is rapidly coming to an end and
could soon start to affect the stock market to the downside.
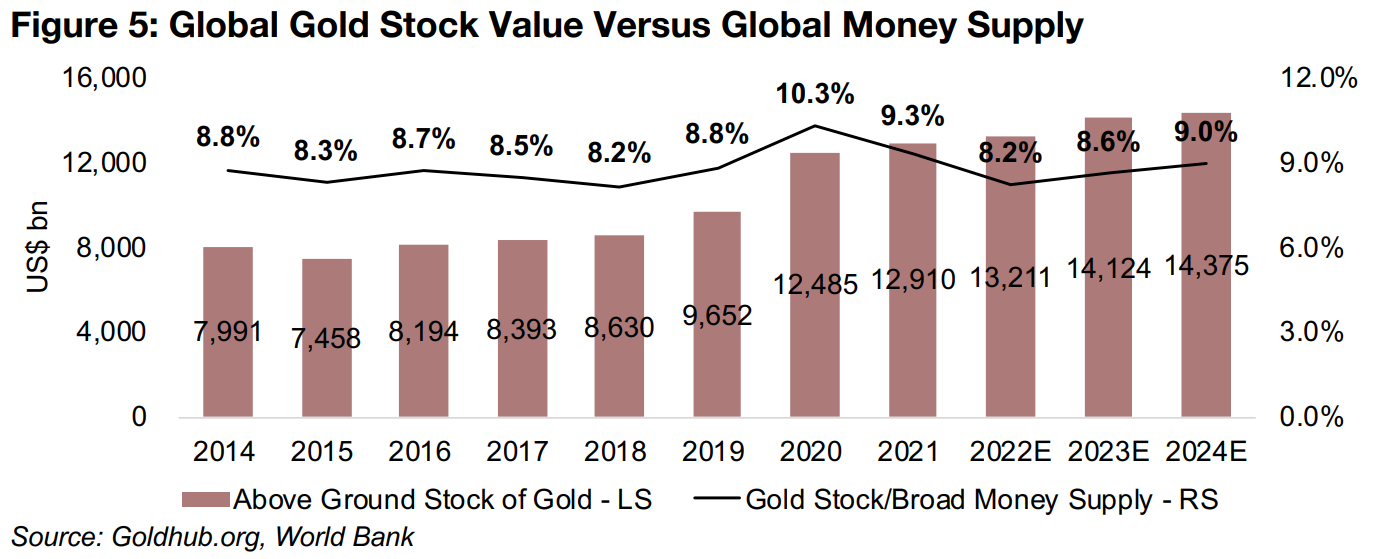
A decline in the global money supply could be a negative for gold, as the value of the
gold stock had tended to remain in a relatively tight ratio to the value of the total
money supply in recent years. It has averaged 8.5% from 2014 to 2019, with only the
monetary shock in response to the global health crisis in 2020 and 2021 sending the
ratio up to 10.3% and 9.3%, respectively (Figure 5).
We estimate that the ratio returned to around 8.2% in 2022 as the average gold price
rose and gold stock expanded, and that it could rise towards 9.0% by 2024E. This
assumes that central banks maintain their rate hikes through 2023 and hold rates at
their peak through next year. However, adverse economic outcomes from the
tightening could easily drive a return to monetary expansion even as early as next
year, and we could see this ratio decline.
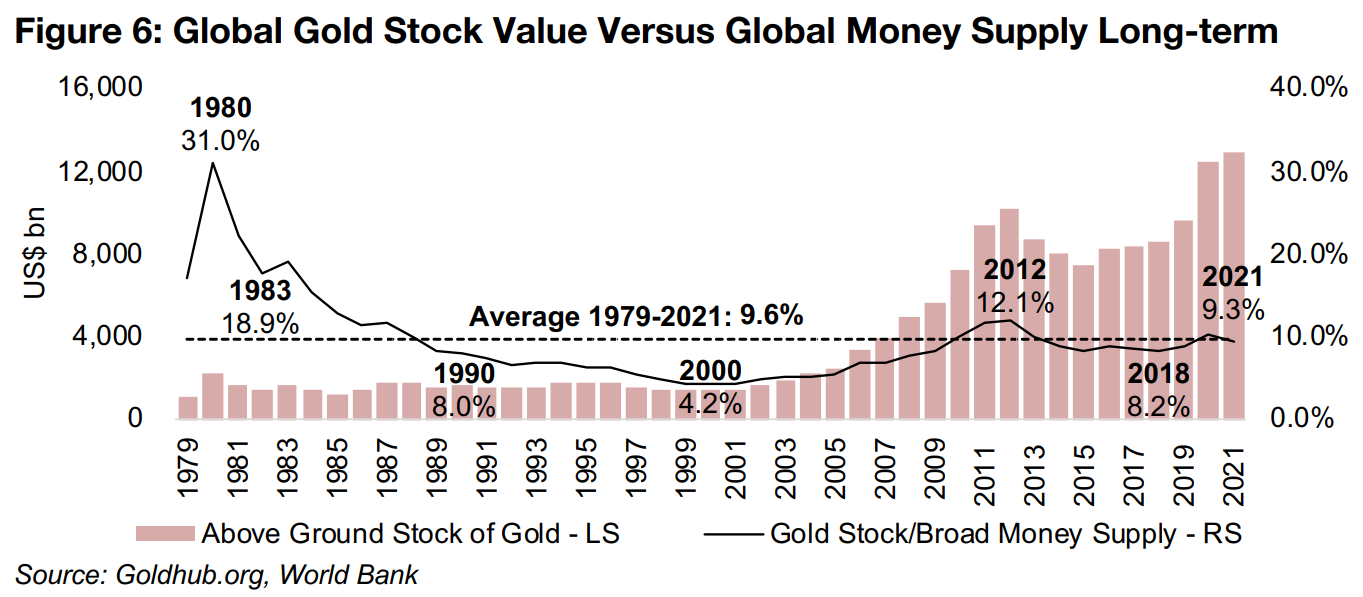
Looking at this ratio long-term, however, the tendency towards holding flat with low volatility over the last decade has not been the norm, with a spike to as high at 31.0% in 1980, and then a twenty-year downtrend to just 4.2% in 2000 (Figure 6). The ratio picked up over the next decade, and bolstered by the post-global financial crisis monetary expansion rose as high as 12.1% before settling down to the 8.5% average from 2014-2019. This indicates that we could see either a rebound in the ratio if central banks return to a major monetary expansion, or a decline if they continue to remain extremely hawkish, with the former scenario bullish for gold and latter bearish.
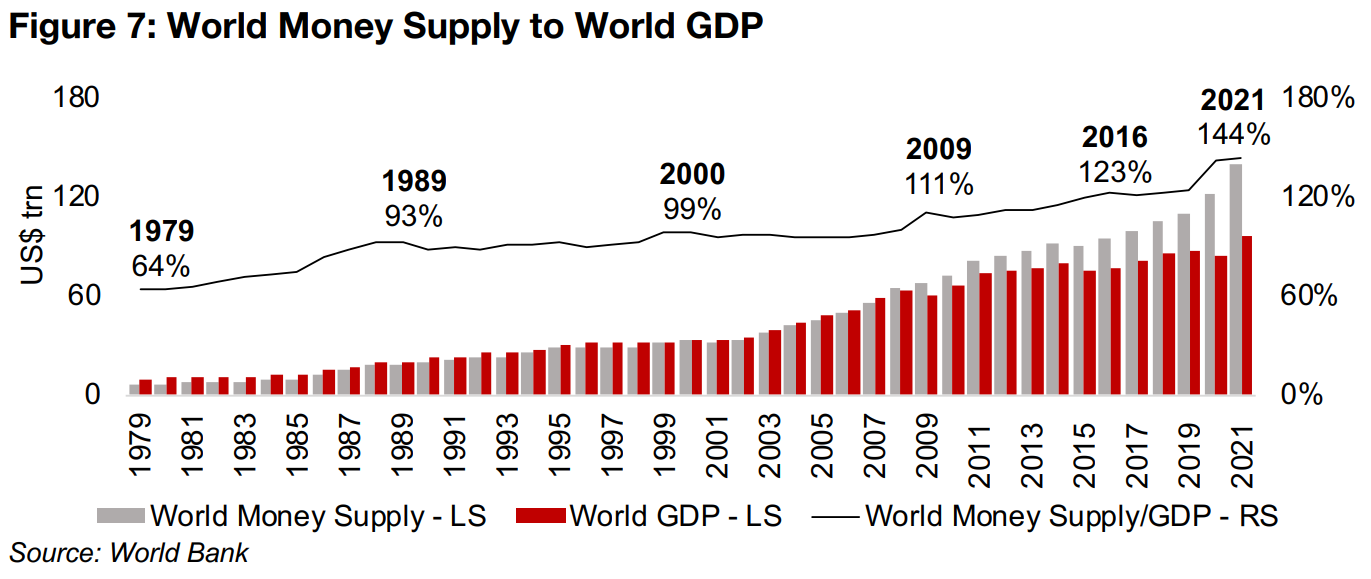
The gold stock to world money supply value can be calculated using the world money
supply to world GDP ratio reported by the World Bank, combined with world GDP
data from the World Bank and IMF. The underlying data shows a strong trend of the
global money supply increasing as a percentage of GDP, from just 64% in 1979 and
nearing 100% by the 1990s (Figure 7). The money supply only broke solidly through
100% of GDP only after the global financial crisis, rising to 111% by 2009, and
continued to rise to 123% by 2016. While the ratio then eased, it again surged in the
global health crisis to 144% by 2021.
If global central banks continue to aggressively hike rates, it could drive an actual
reduction in the money supply for the first time in decades, and this is already
happening in the US in 2023. However, we expect that the ongoing severe removal
of liquidity is likely to have eventual strong negative economic consequences, even
as early as 2024, curbing both the high inflation and high employment that have
allowed aggressive rate hikes to continue. This could prompt a swift return to
monetary expansion, and potentially boost the gold price, as the market seems to
view the 8.5% average gold stock value to money supply as a reasonable relative
valuation for the two assets.
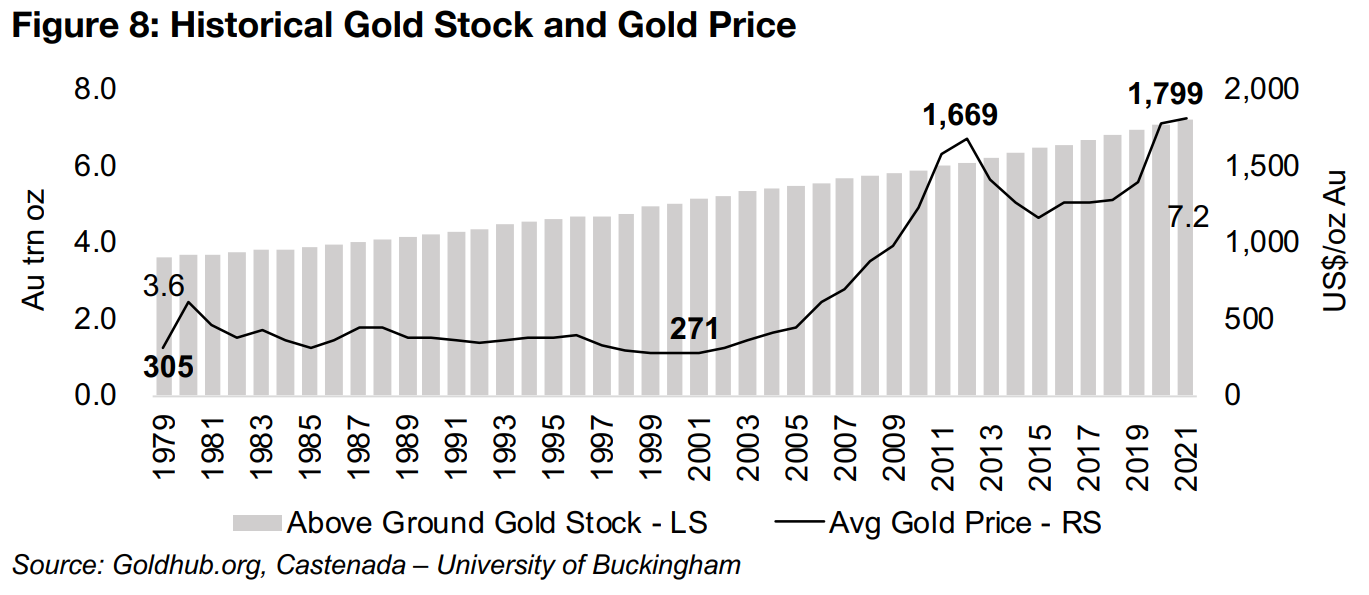
The factors underlying the gold stock value half of the ratio are the above ground gold stock and the gold price. The rise in the above ground gold stock has been very steady over time; it doubled from 3.6 bn oz in 1979 to 7.2 bn oz in 2021, for a compound annual growth rate of 1.7% (Figure 8). With the ability of the industry to get gold out of the ground quite fixed, the gold price becomes the mechanism which balances the gold stock value with the money supply value. This has meant a nearly six-fold rise in the gold price from US$305/oz in 1979 to US$1,799/oz, as money supply expansion has vastly outpaced the new physical supply of gold available.
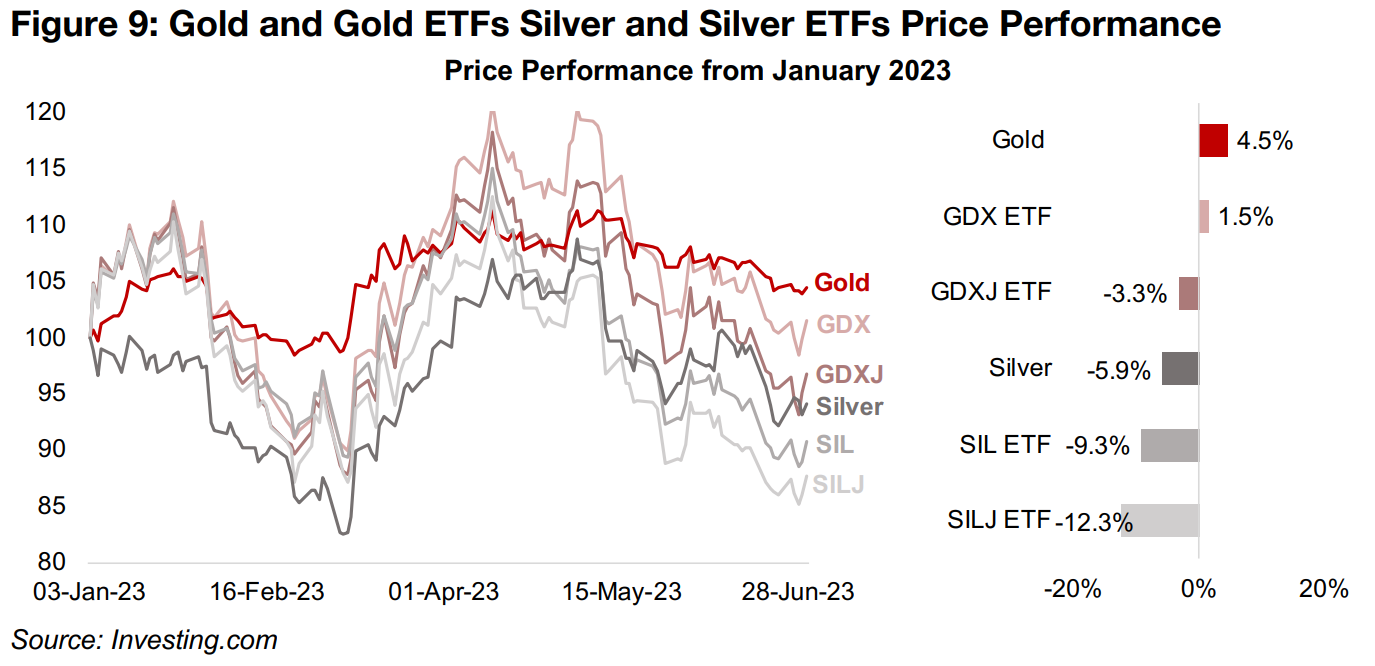
This week we look at the performance of the major mining ETFs with the same sector as the larger stocks on the TSXV, that being gold, silver, copper and lithium, with these segments comprising most of the market cap of the index. For gold, the major ETFs are VanEck's Gold Miners ETF, and the GDXJ, and VanEck's Junior Gold Miner ETF, the GDXJ. So far in 2023 both have underperformed the gold price, which is up 4.5%, with the GDX rising 1.5%, and GDXJ down -3.3% (Figure 9). The GDXJ has been under more pressure as it holds a larger proportion of junior miners while the market has become more wary of smaller cap stocks since 2022.
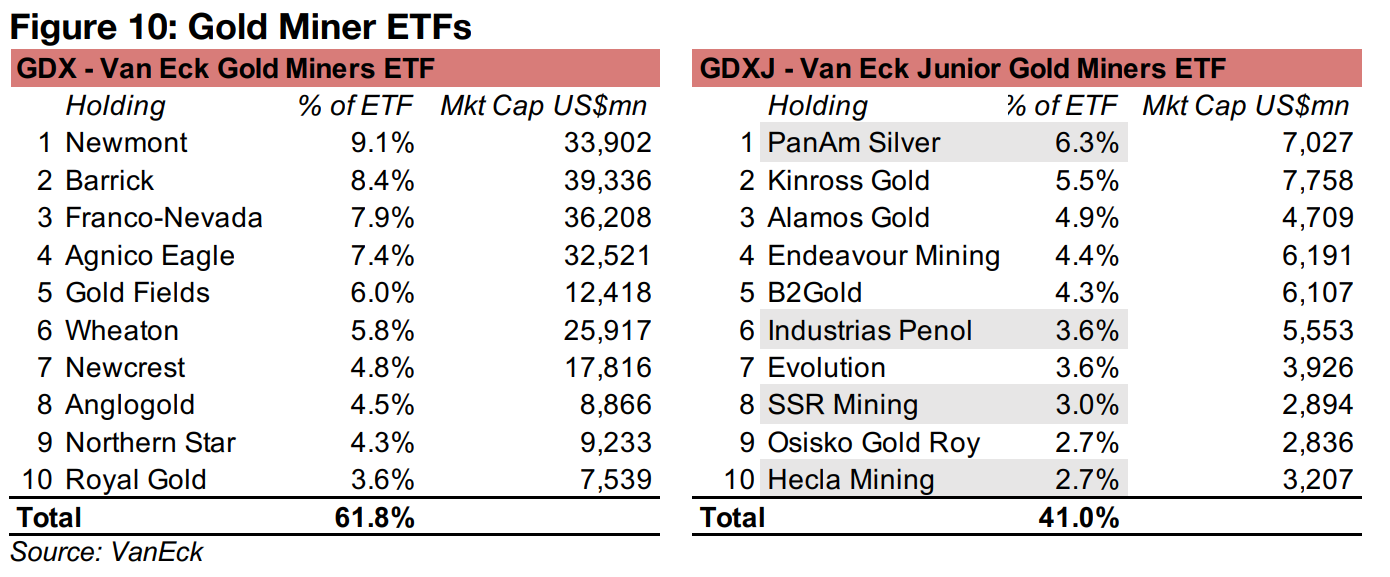
The GDX holds extremely large cap gold stocks, reaching as high as a US$39.3bn market cap for Barrick Gold, and is very concentrated, with just the top ten stocks comprising 61.8% of the ETF's total holdings (Figure 10). The GDXJ has far smaller market cap holdings, only as high as US$7.7bn for Kinross, and with a lower concentration, with the top ten stocks at just 41.0% of the total holdings.
The silver mining ETFs have had a weaker performance than the gold ETFs, driven by the -5.9% contraction silver, with the Global X Silver Miners ETF, SIL, down -9.3% and the ETFMG Prime Silver Junior Miners ETF down -12.3% (Figure 11). In contrast to the GDX and GDXJ, which have no common holdings in their top ten, SIL and SILJ have six of the same holdings in their top ten, shown in grey in Figure 11. Also notable is that four of these are also major holdings of the GDXJ, given that they all have gold as well as silver output, so there is considerable overlap between these three ETFs.
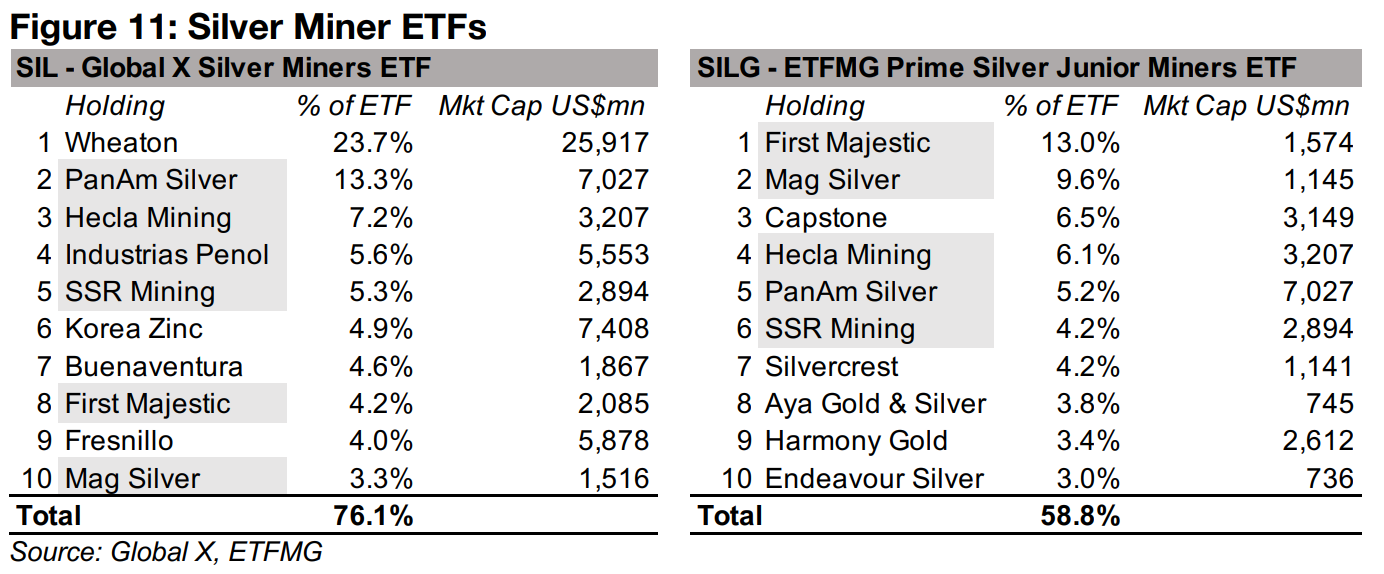
SIL also has Wheaton Precious Metals as by far its largest holding, at 23.7% of the total, which is a royalty and streaming company and not a 'pure' silver play. Both SIL and SILJ are therefore not necessarily 'pure' silver plays and could have correlated movements given many common holdings. The GDXJ also might not be considered a 'pure' gold play, given large holdings with considerable silver output.
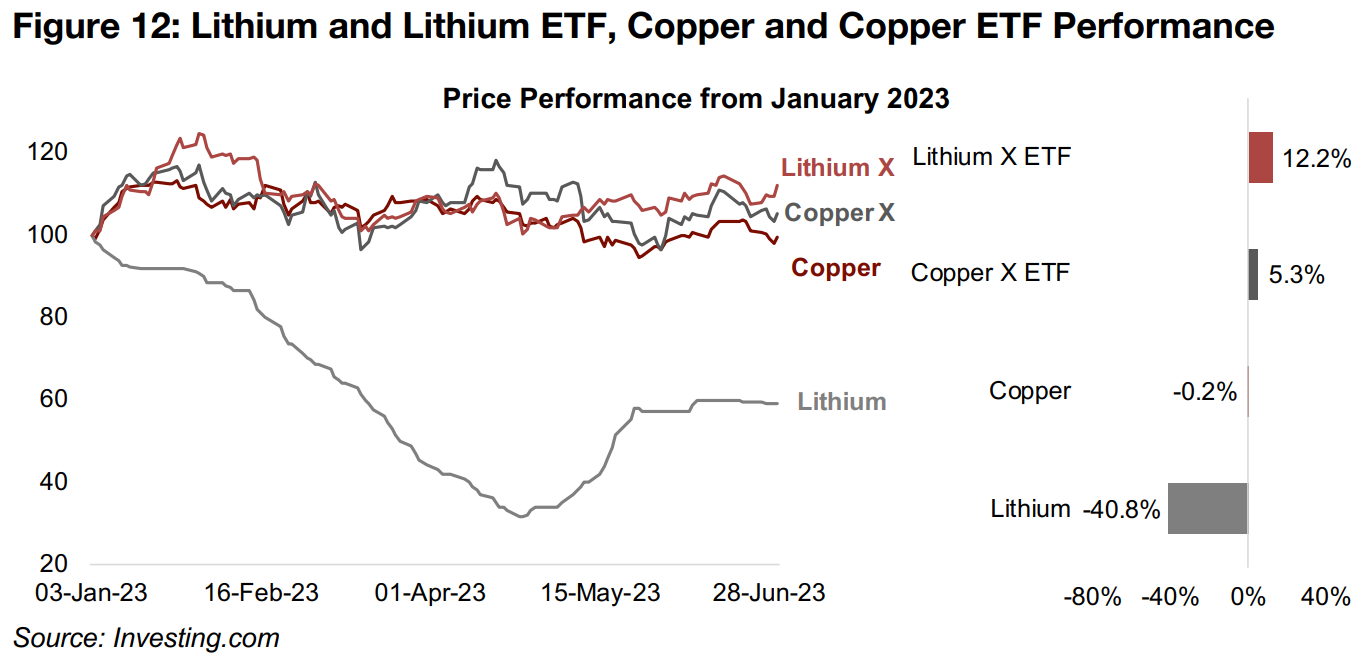
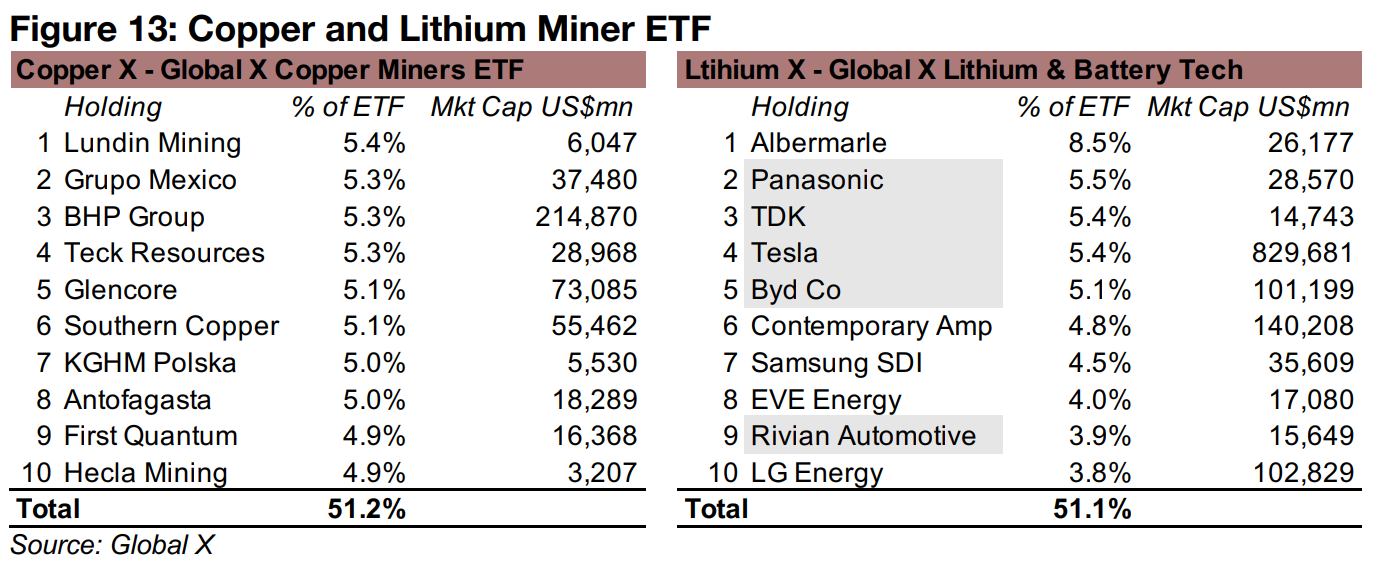
The copper price, down -0.2%, and lithium price, plunging -40.8%, have underperformed their corresponding ETFs this year, with the Global X Copper Miners ETF up 5.3% and Global X Lithium & Battery Tech ETF up 12.2% (Figure 13). For Copper X, this is partly because holdings like Lundin, BHP, Teck and Glencore are diversified across several metals. Lithium X has conglomerates Panasonic and TDK among its top holdings, and auto producers Tesla, Byd Co and Rivian, which are only tangentially driven by the lithium price, insulating the ETF from the metal's plunge.
The composition of these ETFs mean that they do not give major exposure to the
S&P/TSXV Metals and Mining Index, although some of the mid-tier holdings of the
GDXJ and SILJ, and some of the smallest holdings of the GDX, SIL, Copper X and
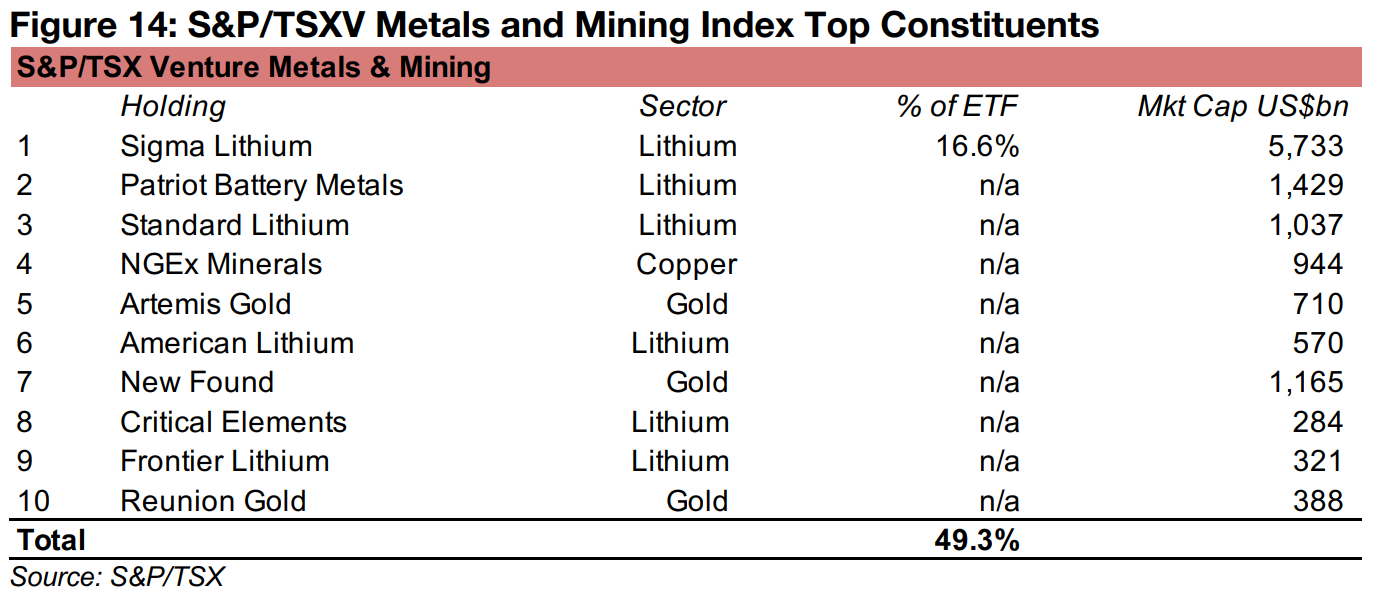
Lithium X might be in the Index. The market cap of the top ten constituents of the
S&P/TSXV Metals and Mining index are mostly US$1.0bn or lower, far below the top
holdings of all the major ETFs, with only one, Sigma Lithium, well above this level
(Figure 14). While there is still no ETF or other instruments to replicate this index, the
top ten holdings comprise nearly half of the total, indicating that a portfolio of these
stocks should trend inline with the TSXV to some degree. However, only the weighting
of the top holding is provided by S&P/TSXV, and the names of the top ten holdings,
so the relative weightings to attempt such a replication of the index are not available.
What we can conclude, is that the performance of the major mining ETFs will not
necessarily be strongly correlated with the gold, silver, copper and lithium sector
performances of the S&P/TSXV Index. To get a gauge of this, it would be necessary
to track the performance of the top five to ten stocks on the S&P/TSXV for each
segment. The performance of these stocks could in turn be strongly swayed by
company specific events and therefore diverge considerably from the 'big picture'
trends that might be shown by the major mining ETFs.
However, even this is suspect, as shown above, with the performance of Lithium X
clearly not reflecting the major plunge in the lithium price this year, given that a
substantial proportion of its holdings not directly related to lithium. Also, while the SIL
and SILJ ostensibly reflect the performance of large and junior silver miners,
respectively, many of their top holdings are identical. As ever, the devil is in the details,
and investing in the TSXV juniors will require looking into individual stocks, as there
are no reliable aggregating investment instruments for the sector yet available.
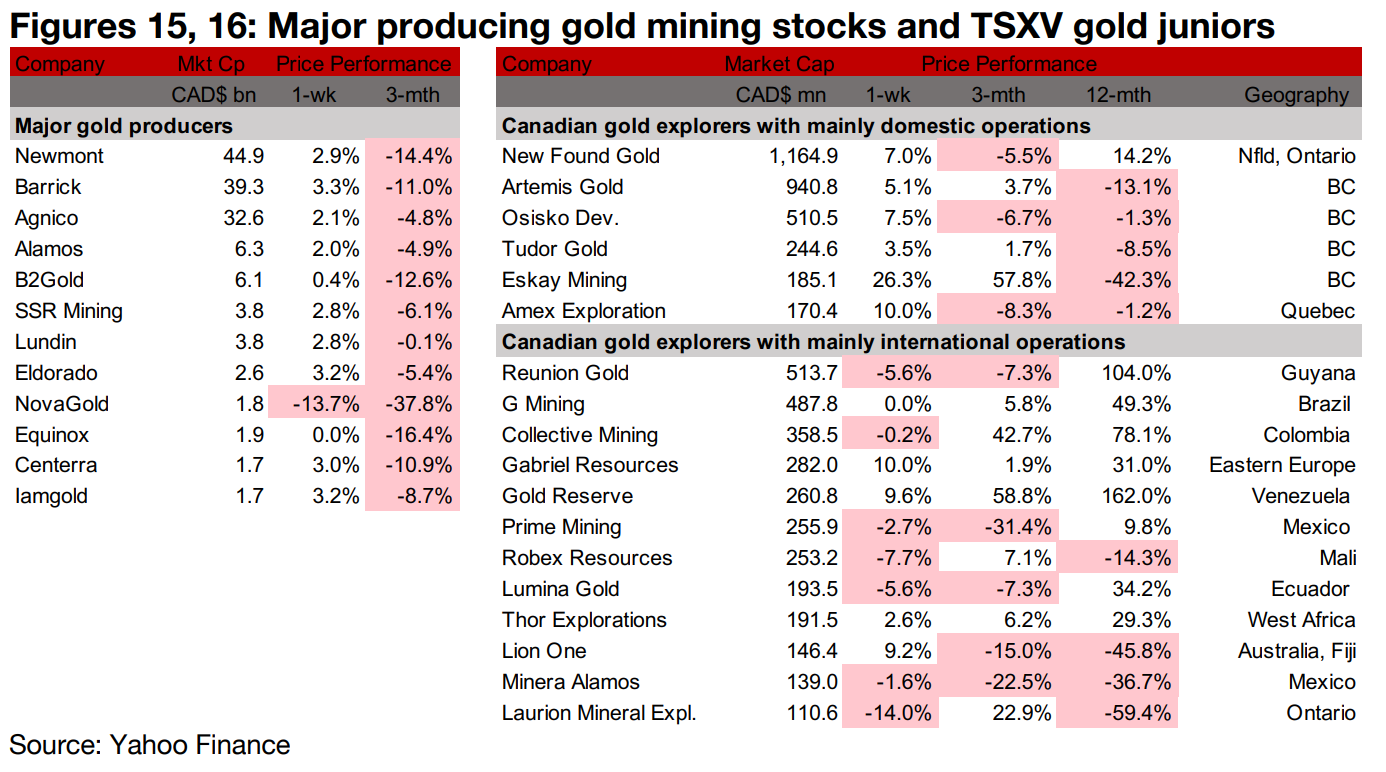
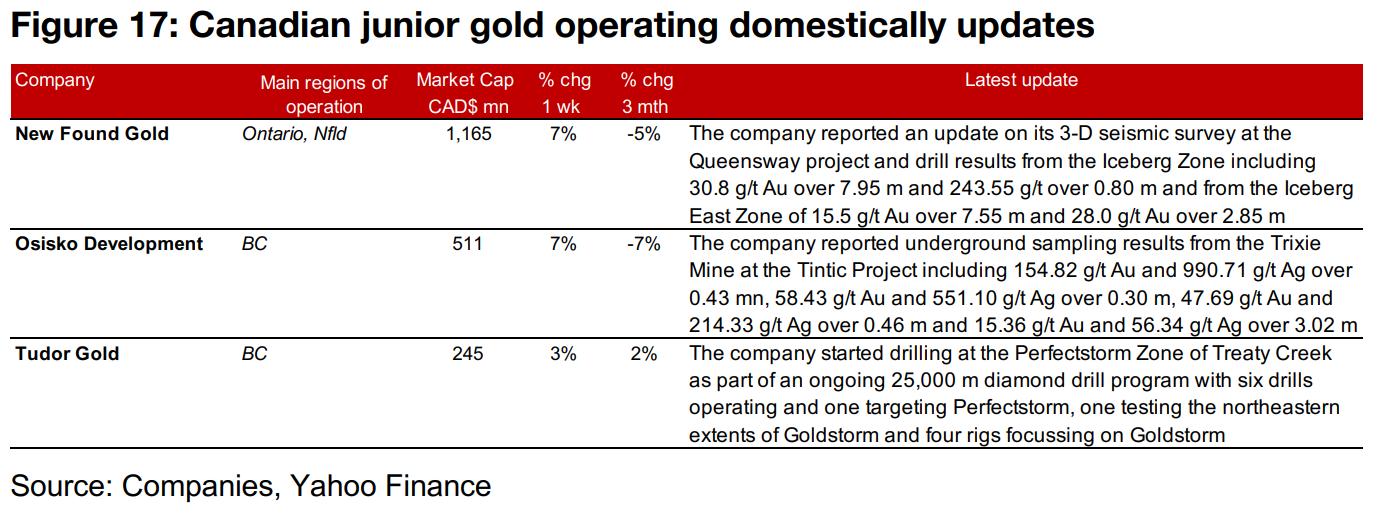
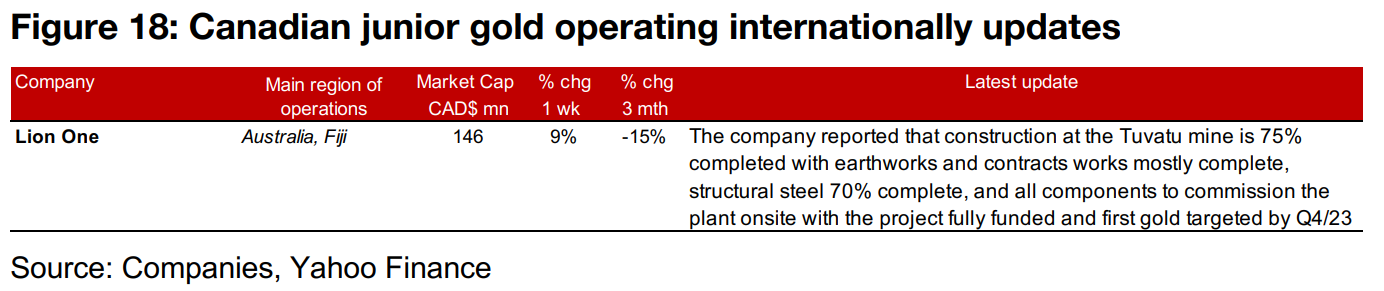
The gold producers nearly all rose and the larger TSXV gold stocks were mixed (Figures 15, 16). For the TSXV gold companies operating domestically, New Found Gold reported an update on its 3-D seismic survey and drill results from Queensway, Osisko Development released underground sampling results from the Trixie mine and Tudor Gold began drilling at the Perfectstorm Zone of Treaty Creek (Figure 17). For the TSXV gold companies operating internationally, Lion One reported that construction at Tuvatu is 70% complete (Figure 18).
Disclaimer: This report is for informational use only and should not be used an alternative to the financial and legal advice of a qualified professional in business planning and investment. We do not represent that forecasts in this report will lead to a specific outcome or result, and are not liable in the event of any business action taken in whole or in part as a result of the contents of this report.
Author
Ben McGregor authors the Weekly Roundup at CanadianMiningReport.com, providing sharp analysis of the metals and mining sector. With a talent for spotting trends, Ben distills complex market shifts into clear, engaging insights on TSXV junior miners. His weekly updates cover gold, copper, uranium, and more, blending data-driven perspectives with a knack for identifying opportunities. A vital resource for investors, Ben’s work navigates the dynamic junior mining landscape with precision.