
September 04, 2023
The gold price rose 1.2% to US$1,966/oz and has added nearly US$50/oz in the last two weeks as US employment data weakened, increasing hopes for a more dovish Fed, and recession fears continue to support gold even in the face of rising yields.
This week we look at the latest driver for the uranium price, the coup in Niger, which has increased concerns over supply of the metal as the country is the seventh largest global producer, further supporting an already strong long-term secular uptrend.
Gold stocks rose for a second week with the GDX up 2.4%, outpacing the S&P 500's 2.0% gain, while the GDXJ rose 2.5%, coming in below the 3.3% gain for the Russell 2000 small cap index, and the larger TSXV gold stocks were mixed.


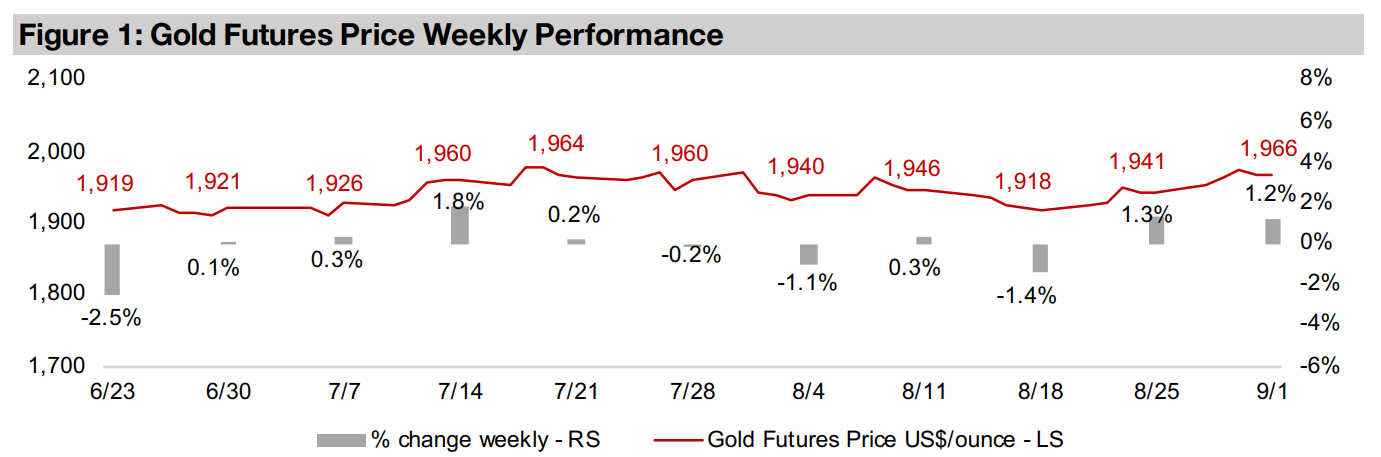
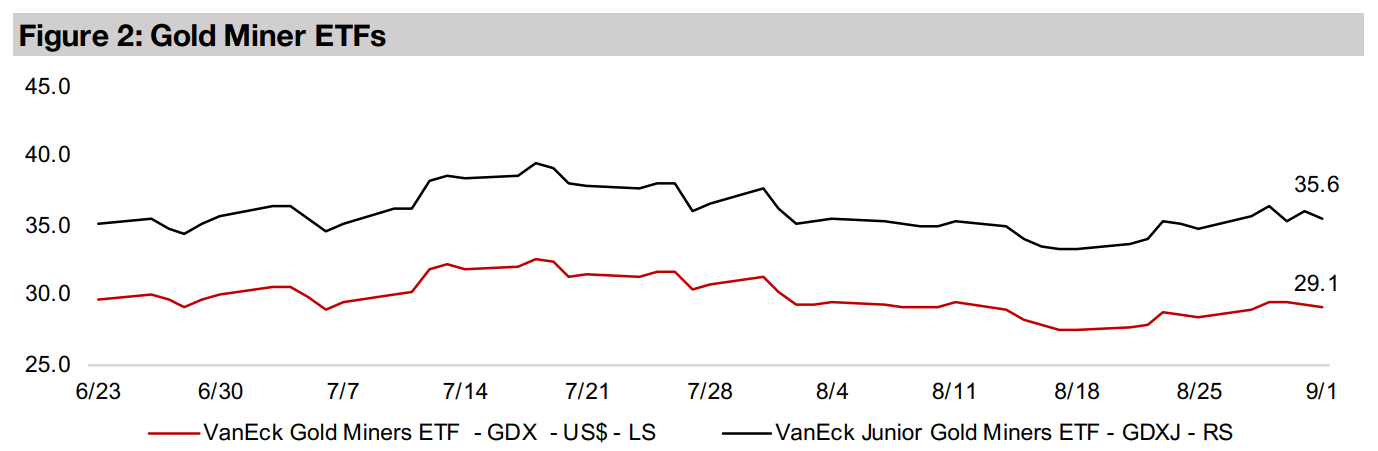
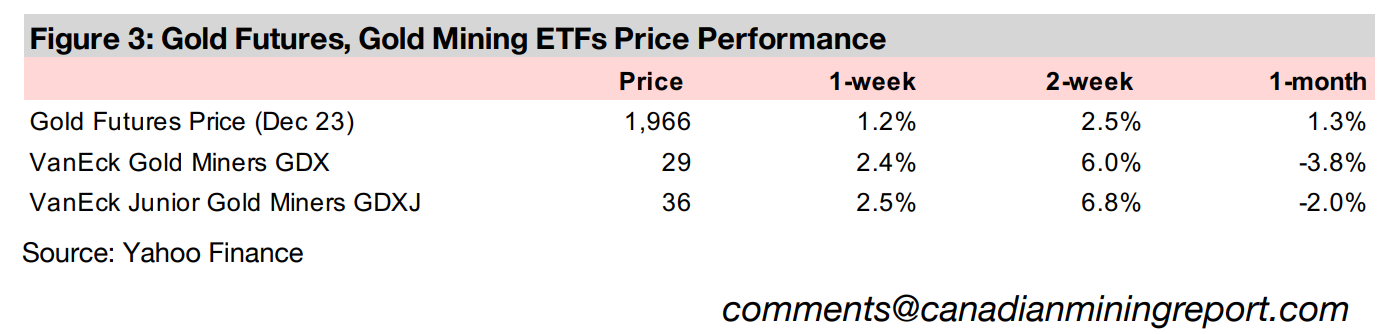
Gold rose 1.2% to US$1,966/oz, up for second consecutive week during which it has added nearly US$50/oz to the price. This has been driven especially by a flurry of US employment data which was reasonably bearish overall, increasing the market’s hope once again for a more dovish US Fed. Gold stocks also picked up, with the GDX ETF of gold producers rising 2.4%, outpacing the S&P 500 index, gaining 2.0%, and while the GDXJ ETF of junior gold miners rose 2.5%, this came in below the 3.3% jump in the Russell 2000 small cap index, with markets shifting to a risk-on stance.
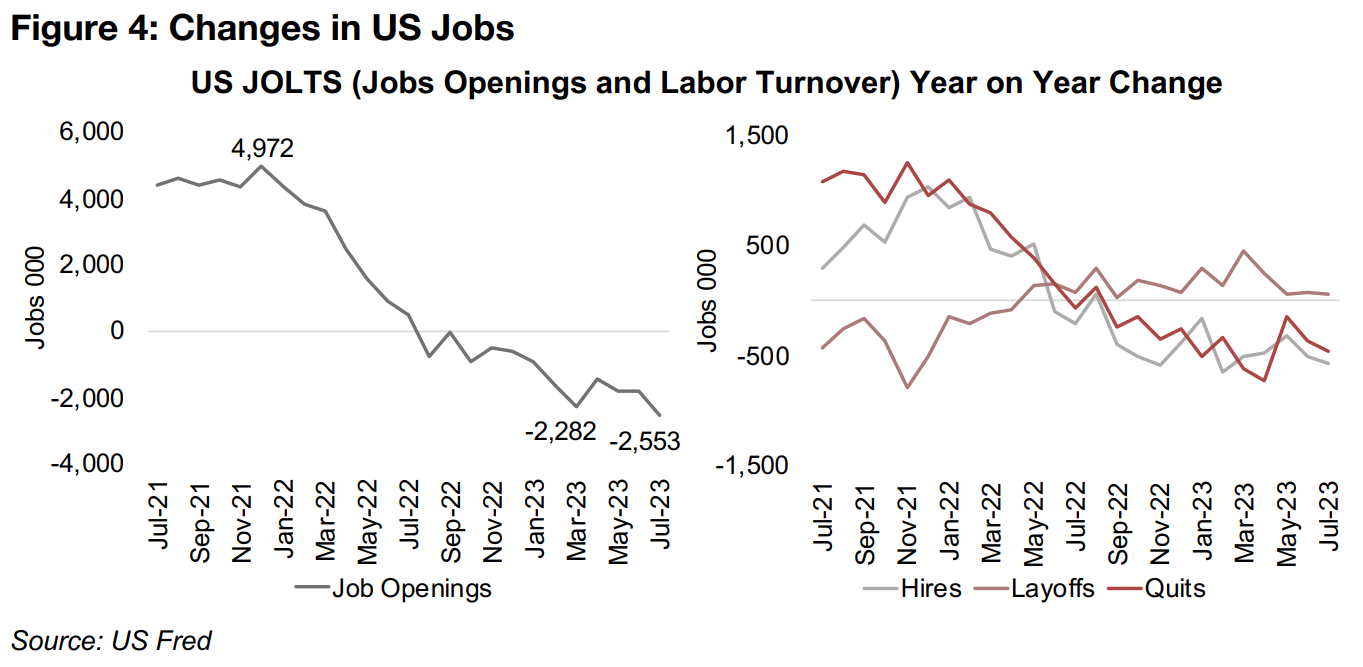
The first signs of a cooling US labour market this week came from the July 2023 Job
Openings and Labor Turnover Survey, or JOLTS report. Job openings surprised to
the downside, falling by -2.55 mn year on year, continuing a downtrend from a peak
4.97 gain in December 2021 (Figure 4). Other indicators in the report further point to
a slowdown in US employment situation over the past two years, with ‘quits’ trending
down consistently. Changes in 'hires' have also dropped from a peak in at 952k in
December 2021 to -567k in July 2023, while changes in 'layoffs', which had been as
low as negative -793 in in November 2021, were near flat in the latest report.
While the data certainly looks bearish in the context of the labour market boom of
2021, in a longer-term context it appears that the US employment market is simply
returning towards a pre-crisis balance. The situation in 2021 heavily favored
employees, as demand suddenly surged, but many workers were not in a rush to
return to jobs given support from various government stimulus measures. As the
post-crisis boom economic boom eased in 2022, and stimulus payments were used
up, it has become less of a seller’s market for workers in 2023.
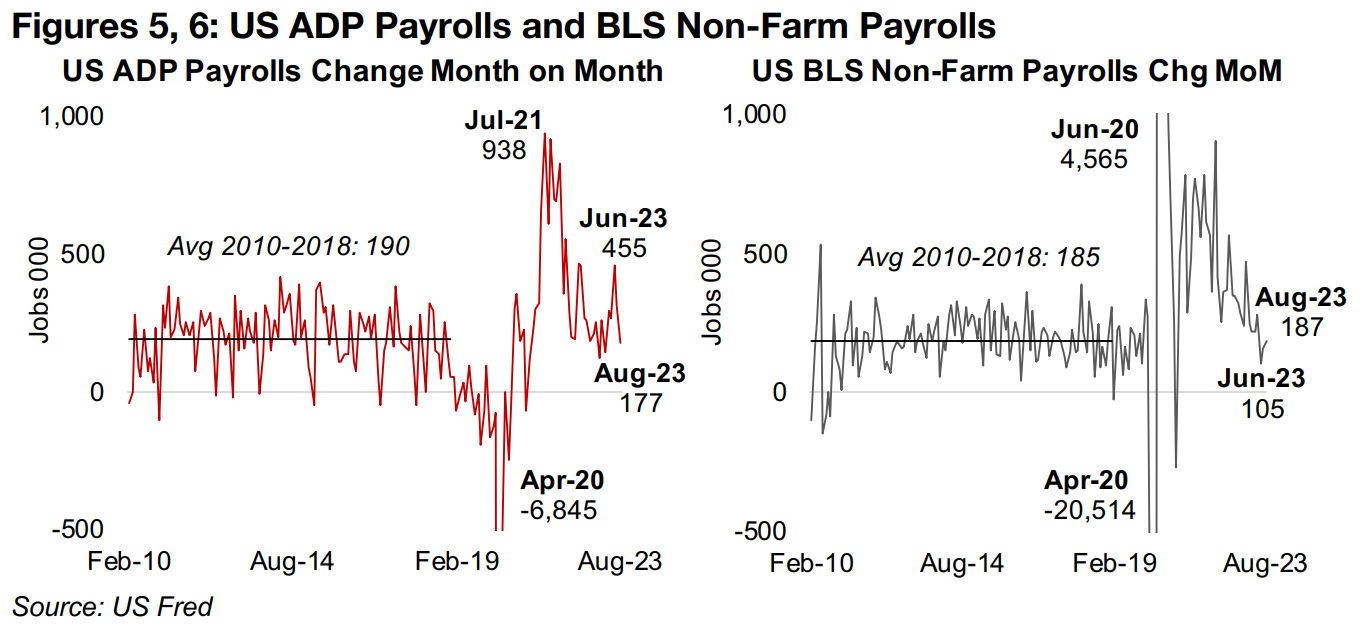
Further signs of weakening employment this week came from US ADP payrolls and BLS non-farm payrolls data. Additions to US ADP payrolls dropped to 177k in August 2023, down more than half from the recent 455k June 2023 peak (Figure 5). The US BLS Non-Farm Payrolls ticked up marginally month on month to 187k in August, but remain within a downtrend that began in early 2022. Interestingly, both the numbers are close to the 2010-2018 series averages, at 190k for the ADP and 185k for the BLS statistics (Figure 6). This seems to be more evidence that employment is normalizing to pre-crisis levels. However, with recession fears still looming, the question becomes whether the unemployment data will start to slide below the 2010 2010-2018 range, which was a boom period driven by extremely low interest rates, very different from the four-decade highs in interest rates currently.
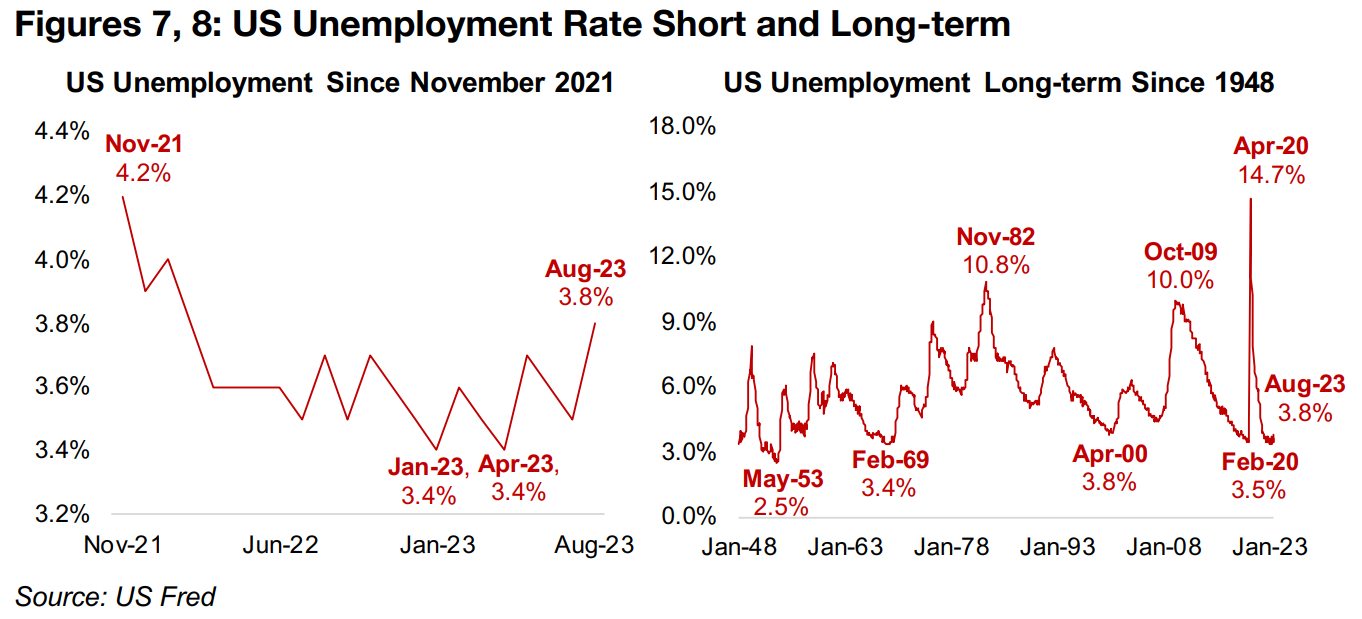
US unemployment also spiked in the August 2023 report, to 3.8%, its highest since February 2022, and off April 2023 lows of 3.4% (Figure 7). While similar to the JOLTs and payroll data, it looks bearish in the context of very recent data, it is still very low in a longer-term context. Even 3.8% unemployment is still at the lower-end of the historical range, with the rate dipping below 3.5% only twice since World War II (Figure 8). So the unemployment data, while weaker, is far from dire in a long-term context, and not enough to justify an aggressive pullback by the Fed. The Fed has been clear that rates could rise more, and will at least remain at current levels for an extended period, and we would likely need to see much worse numbers before there is a shift in their stance. The market’s bullishness over this recent news, therefore, might once again prove overblown, in our view.
These weakening employment numbers exciting the market have also driven up the
gold price, as a dovish Fed and a return to easy money would be a driver for gold.
What has been interesting this year is that even as monetary policy has done the
exact opposite, and tightened considerably, gold has stubbornly shrugged this off,
and gained 6.6% in 2023. These rising rates, accompanied by a major decline in US
inflation over the past year, have driven up real yields dramatically, which theoretically
drives down gold, as fund flows tend to shift away from the yield-less metal and into
other increasingly higher-yielding assets.
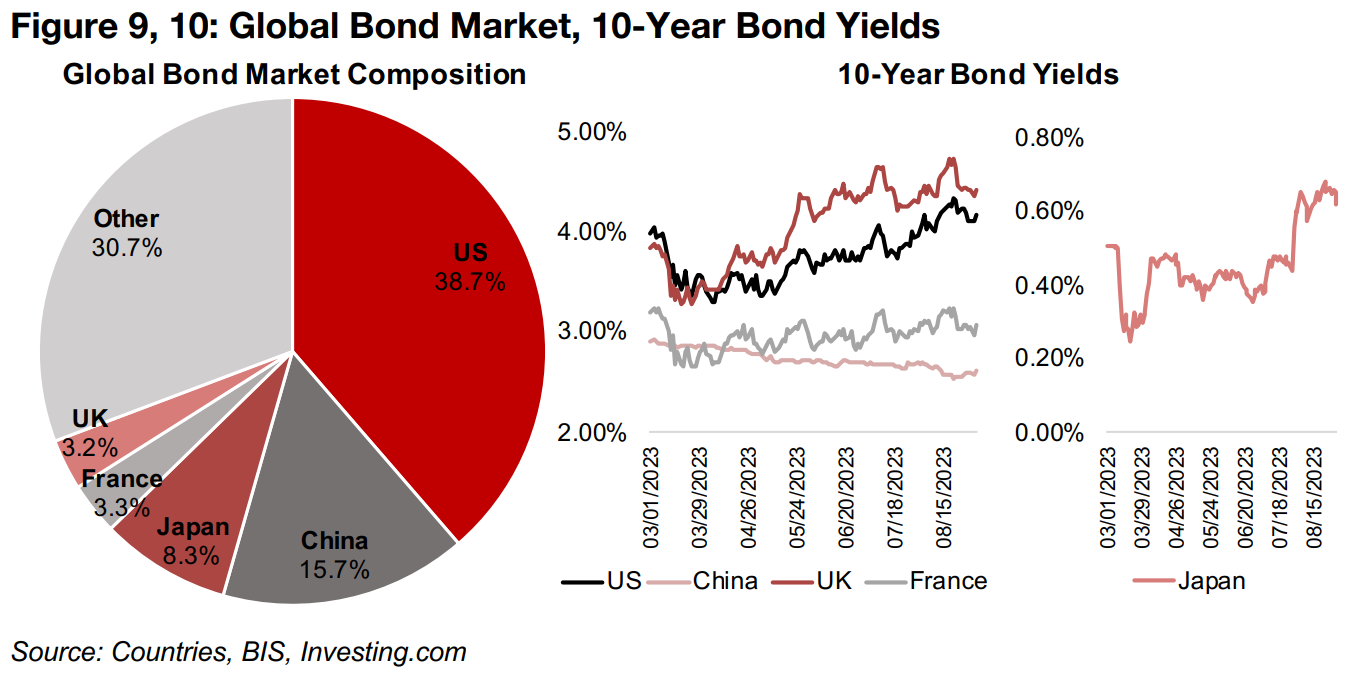
Global rates have been trending up since March 2023, with the 10-year government
bond yields of most of the largest bond markets rising (Figures 9, 10). The yields for
the US, Japan, UK and France, which account for more than half of global debt
issuance, have all gained significantly over the past six months. Only China has seen
declining rates as economic data there has weakened. Yields in most of the countries
comprising the other 30% of global debt markets have also been rising. The
increasing rates have started to curb global inflation, which has declined considerably
in the US and Europe, meaning a significant rise in real yields there.
That gold has gained in the face of these economic dynamics suggests that the
markets are weighting other factors into the gold price more highly that the real yield
issue. They seem to be pricing in the growing risk of a global recession as well as
heightening geopolitical tensions, and hedging their bets, taking some risk in the
equities, but holding gold in case the rally comes to an abrupt recession-driven halt.
While the prices of many base metals have struggled this year, the fuel metal uranium has risen substantially, with the spot price up 11.3% from January 2023 to the most recently reported July 2023 data from Cameco (Figure 11). Part of this gain has been from a secular rise in the uranium price over the past several years, with rising support for nuclear power as part of green energy initiatives. A shift in policy by a new administration in Japan and green parties in Europe, which were both previously reluctant to offer support, have been key, as well as extensive nuclear expansion plans in developing markets. More recently, however, providing a short-term boost to the longer-term trend, has been the coup in Niger that occurred on July 26, 2023.
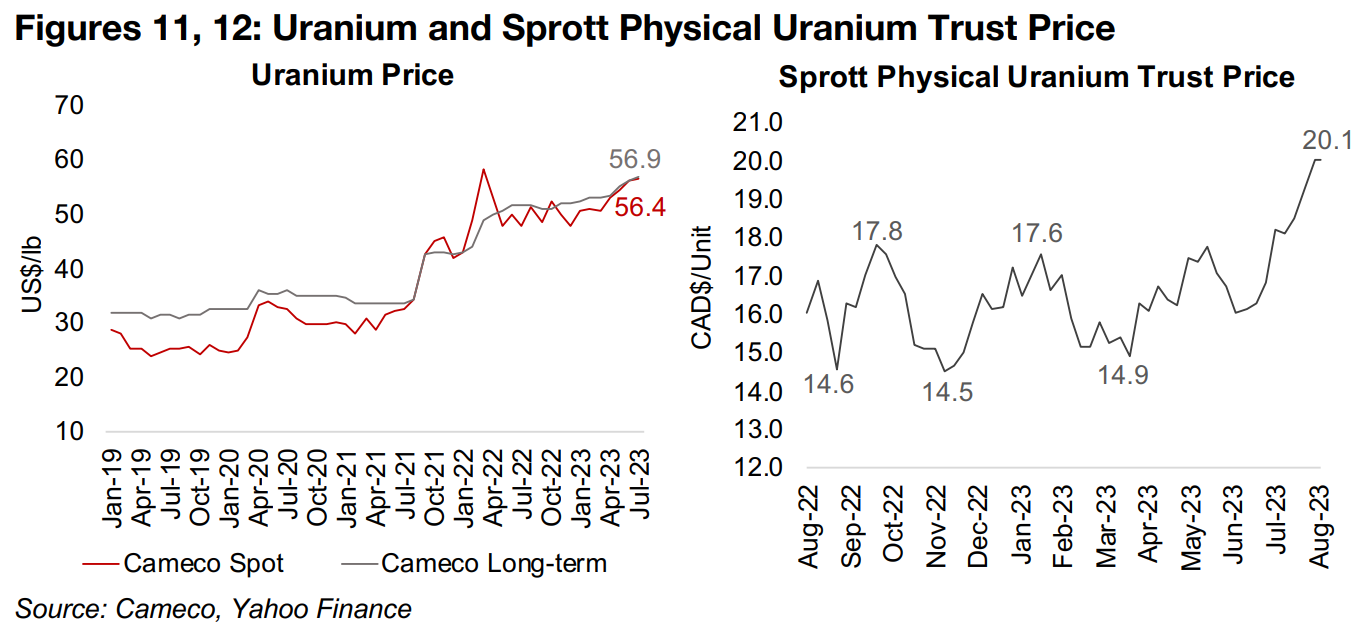
While we don’t have the August 2023 uranium price from Cameco, with uranium traded only privately with limited daily pricing available, we do have recent price data from the Sprott Physical Uranium Trust (SPUT). In contrast to the limited visibility and delayed data for spot uranium from Cameco, the SPUT is traded daily, and is a decent proxy for likely recent underlying moves in the uranium price. The SPUT spiked 34.9% to CAD$20.1/unit as of September 1, 2023, up 34.9% from a recent trough of CAD$14.9/unit in early March 2023 (Figure 12).
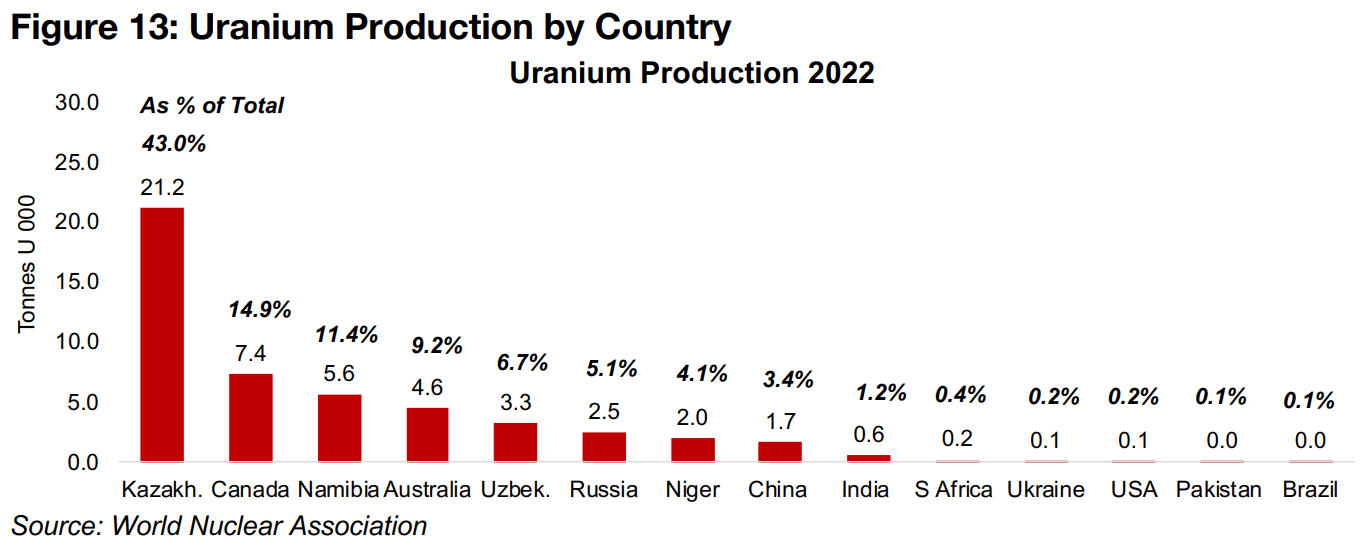
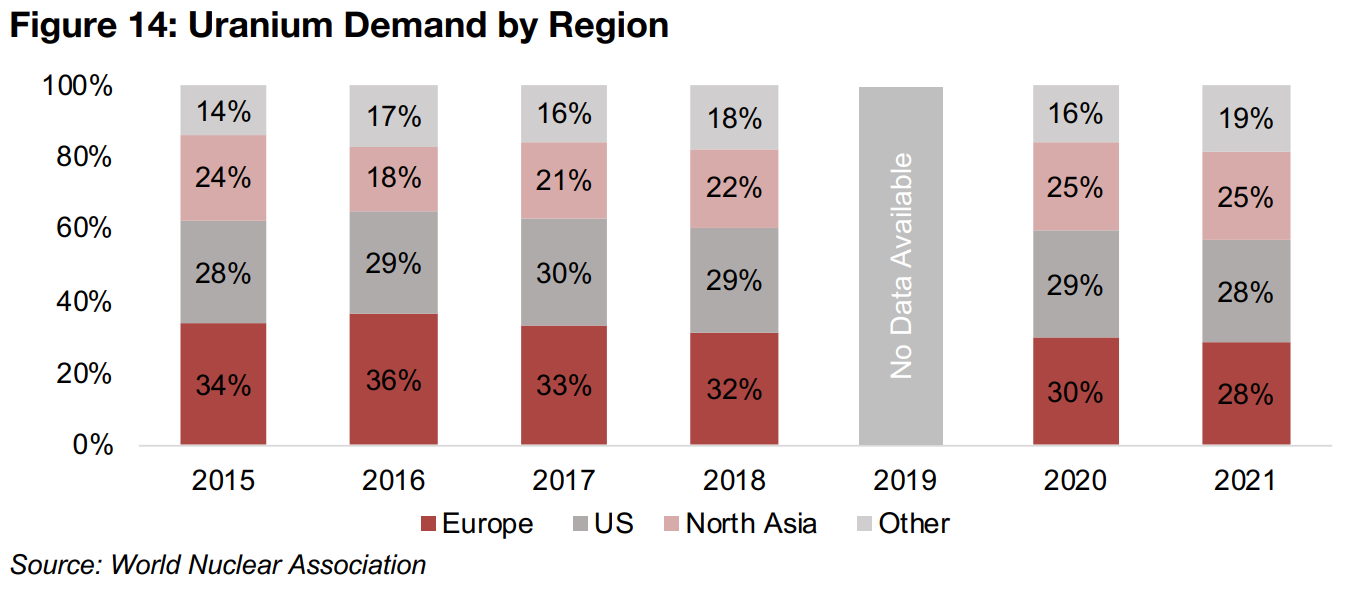
While not an industry giant like Kazakhstan, providing 43.0% of the world’s uranium in 2022, or a major mid-tier player like Canada or Namibia, at 14.9% or 11.4%, of global supply, respectively, Niger is still key as the seventh largest world player, producing 2,000 tonnes in 2022, or 4.1% of the total (Figure 13). Uranium supply from Niger is particularly important for Europe, which is tied with the US for the largest global uranium demand in the world, at 28% of the total, with North Asia at 25%, most of which is China, at 15.4% of total demand, with the rest of the world at 19%.
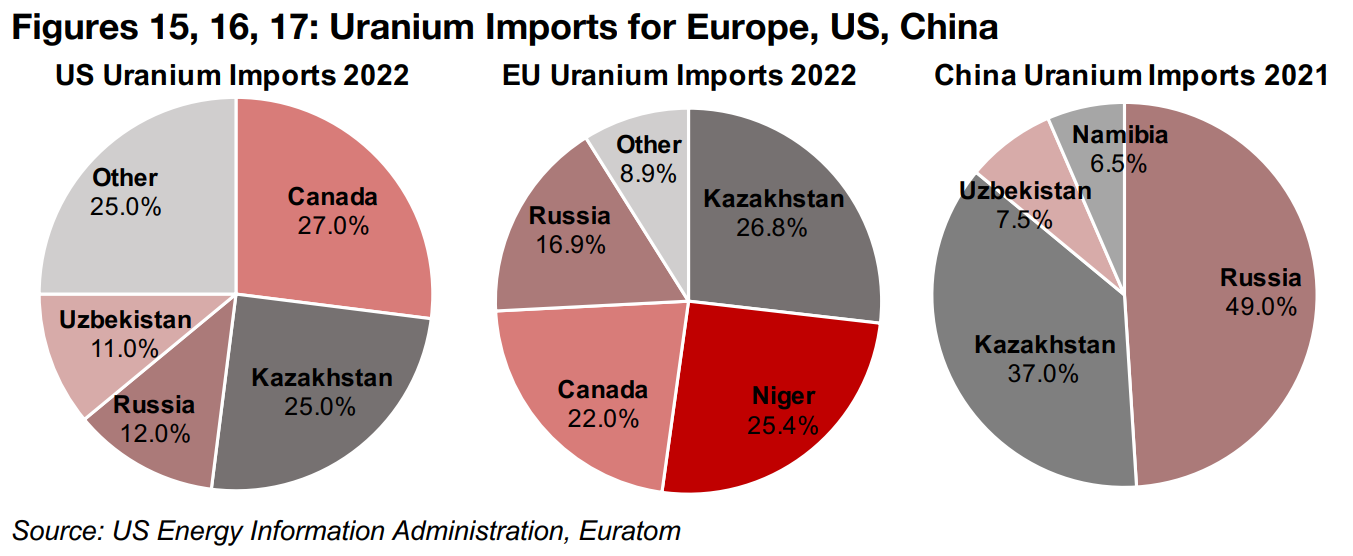
Uranium imports for these three regions show that most of Niger's supply goes to
Europe, and that it is the second largest supplier, accounting for 25.4% of the total,
with Niger having no uranium exports to the US or China (Figures, 15, 16, 17). The
Niger coup does therefore theoretically pose a major risk to European nuclear supply,
when it is already facing additional issues related to fossil fuel security, with large
supplies of gas coming from Russia. While the EU indicated after the news of the
coup that it has substantial uranium reserves and that its uranium supply is on long-term contracts which should mute short-term price movements, the SPUT shows the
market pricing in more risk for the industry.
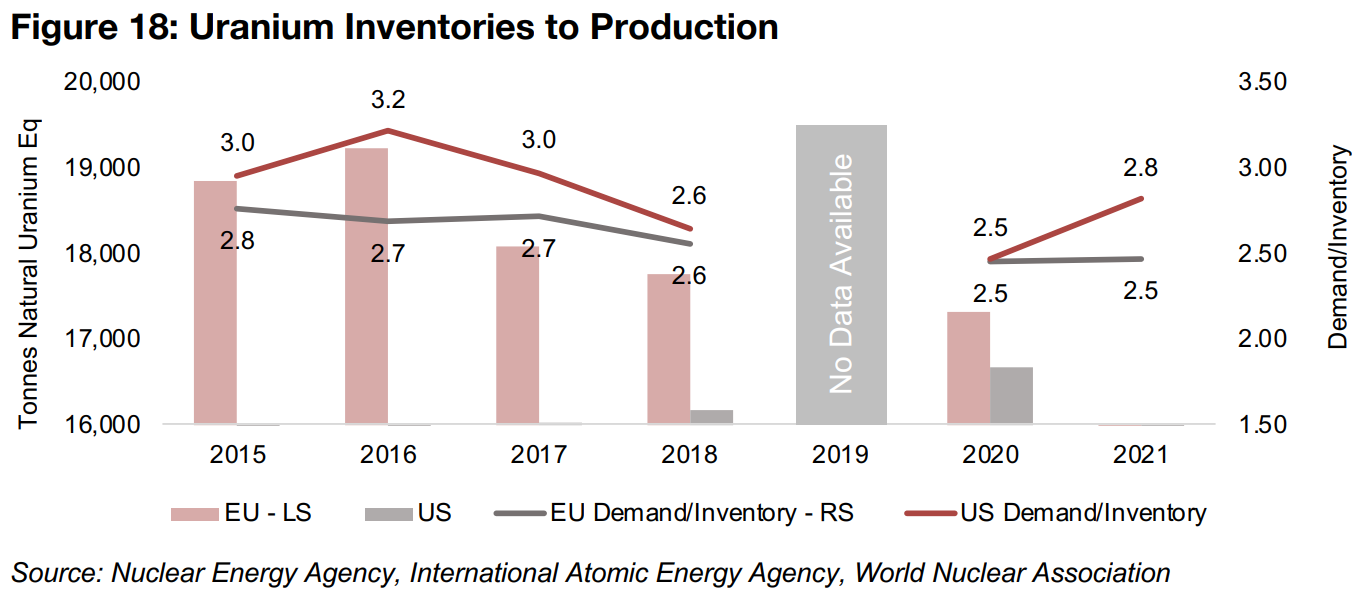
Comparing inventory data from the Nuclear Energy Agency and International Atomic
Energy Agency to World Nuclear Association demand data shows that the EU had a
strong 2.5 years of natural uranium reserves in 2021 and 2022, although this has
declined from 2.8 years in 2015 (Figure 18). US inventories of natural uranium picked
up to 2.8 years in 2021 from 2.5 years in 2022, off a recent peak of 3.2 years in 2016.
While we expect the secular long-term story for uranium to remain intact, possibly for decades, and the boost from Niger supply concerns to continue this year, there are some short-term demand risks heading in 2024. One is that the Niger political situation cools down and any premium from the uranium price from this issue is not sustained. The other issue is if a global recession arises, overall energy demand will likely decline, and along with it demand for electricity from nuclear power sources, and in turn purchases of uranium.
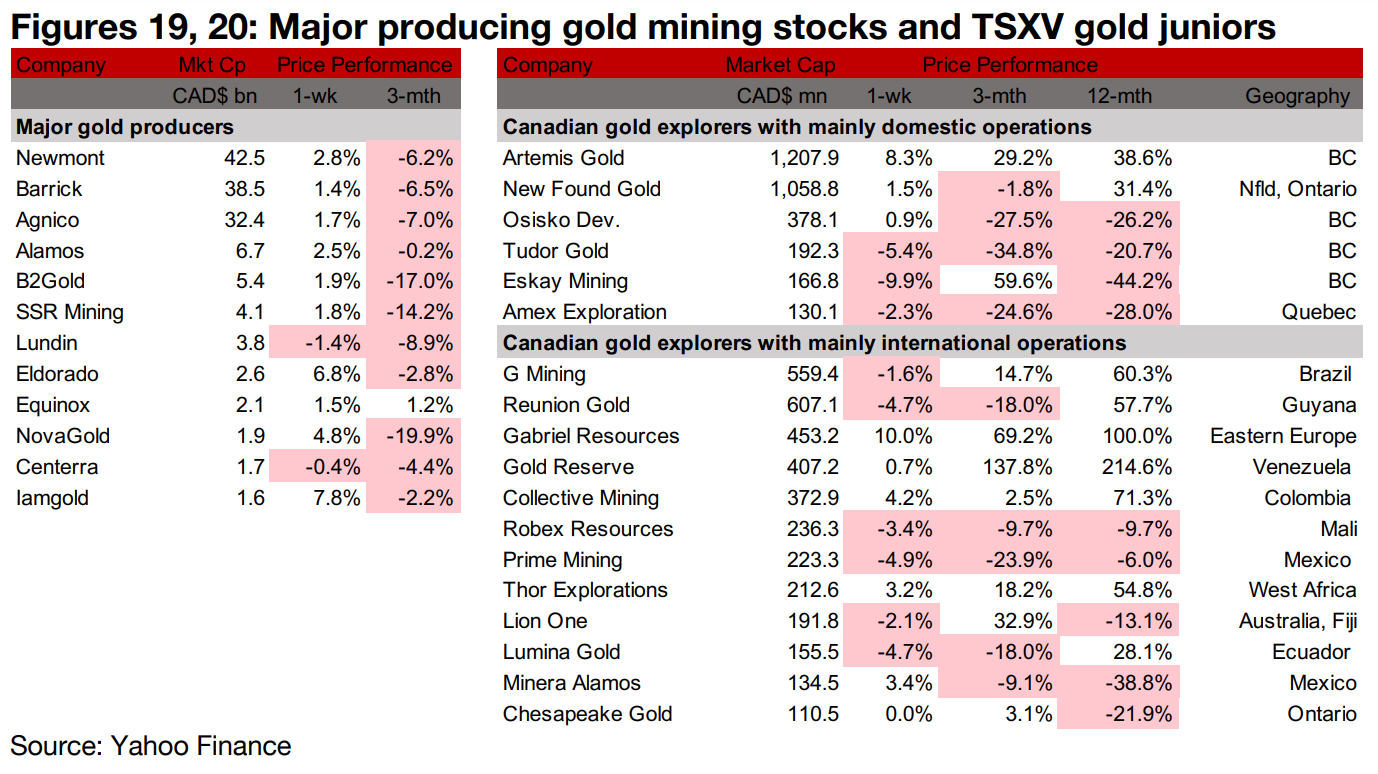
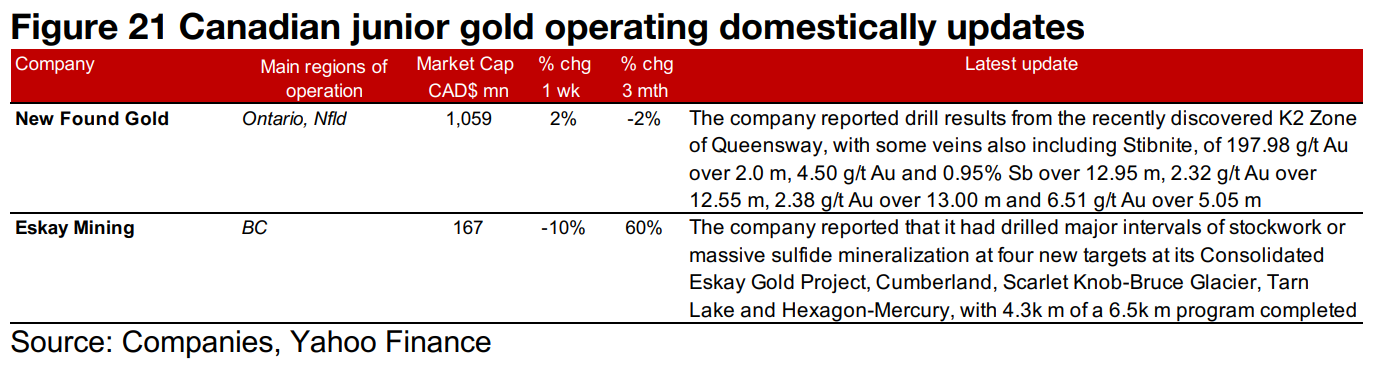
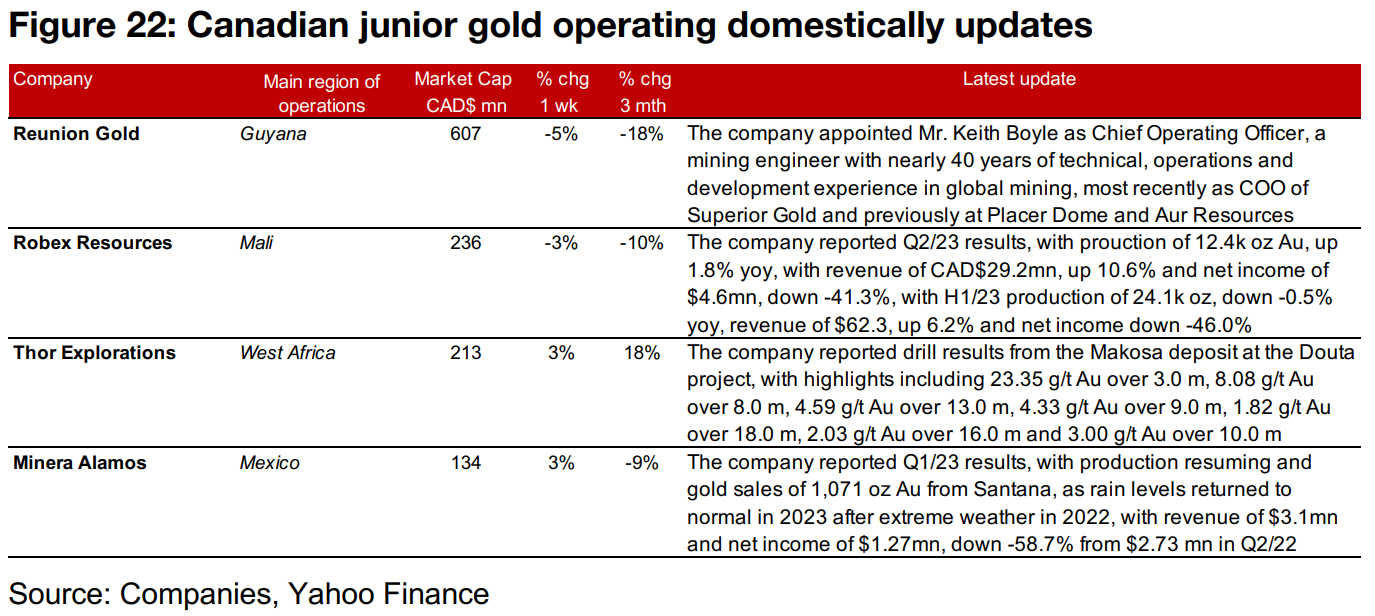
All the major gold producers except two rose, and TSXV larger cap gold was mixed (Figures 19, 20). For the TSXV gold companies operating domestically, New Found Gold reported drill results from the new K2 Zone of Queensway and Eskay drilled significant intervals at four new targets at the Consolidated Eskay Gold Project Project (Figure 21). For the TSXV companies operating internationally, the company appointed a new Chief Operating Officer, Robex Resources issued Q2/23 results, Thor Explorations reported drill results from the Douta project and Minera Alamos announced Q2/23 results (Figure 22).
Disclaimer: This report is for informational use only and should not be used an alternative to the financial and legal advice of a qualified professional in business planning and investment. We do not represent that forecasts in this report will lead to a specific outcome or result, and are not liable in the event of any business action taken in whole or in part as a result of the contents of this report.
Author
Ben McGregor authors the Weekly Roundup at CanadianMiningReport.com, providing sharp analysis of the metals and mining sector. With a talent for spotting trends, Ben distills complex market shifts into clear, engaging insights on TSXV junior miners. His weekly updates cover gold, copper, uranium, and more, blending data-driven perspectives with a knack for identifying opportunities. A vital resource for investors, Ben’s work navigates the dynamic junior mining landscape with precision.