Determining the Outlook for Gold Mining Stock / Commodities / Gold and Silver Stocks 2018

 Gold miners completed the inversehead-and-shoulders pattern – it’s now a fact. And many analysts would have onebelieve that it’s the only fact that matters right now or that it’s of majorimportance. But just like focusing on one tree can make one miss the entireforest behind it, the above could make the entire precious metals outlookappear different than it really is. There are multiple factors in place and we willnot cover all of them in this essay, but even in case of the mining stocks,there are many factors that gold promoters and those who put alot of weight in the inverse H&S pattern in mining stocks, are usually notmentioning in their analyses. We’ll discuss some of those factors below.
Let’s start with the long-termchart featuring gold stocks’ proxy – the HUI Index (charts courtesy ofhttp://stockcharts.com).
BroadPerspective – Big Implications
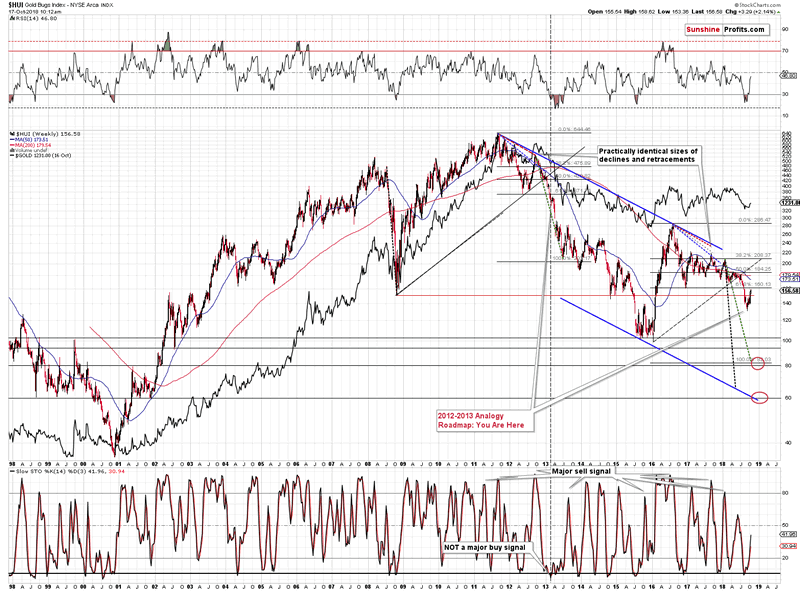
Fromthe long-term point of view, we see that the gold miners have not moved abovethe 2016 lows, which means that the current situation remains similar to whatwe saw in April 2013 before the decline. Back then the corrective upswing wassmaller, but it also took miners higher, yet not to the previous major bottom,let alone above it.
Basedon Monday’s reversal, it seems that the next short-term move will be lower. This,in turn, means that that the very bearish link to 2013 is likely to bepreserved and the very bearish implications for the following weeks will remainin place.
Whenlooking at miners’ performance relative to the general stock market we also seebearish indications from both: short- and long-term point of view:
GoldStocks vs. Other Stocks
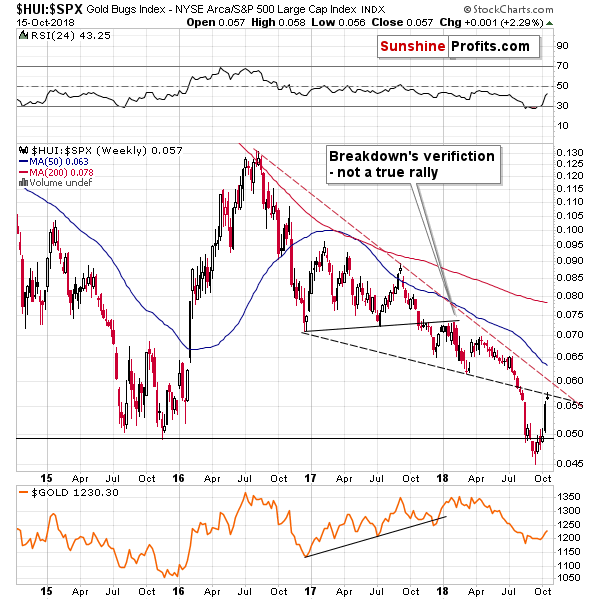
Fromthe long-term point of view, we see that the ratio between gold stocks andother stocks (S&P 500) moved to the declining resistance line, which is agood reason for a reversal.
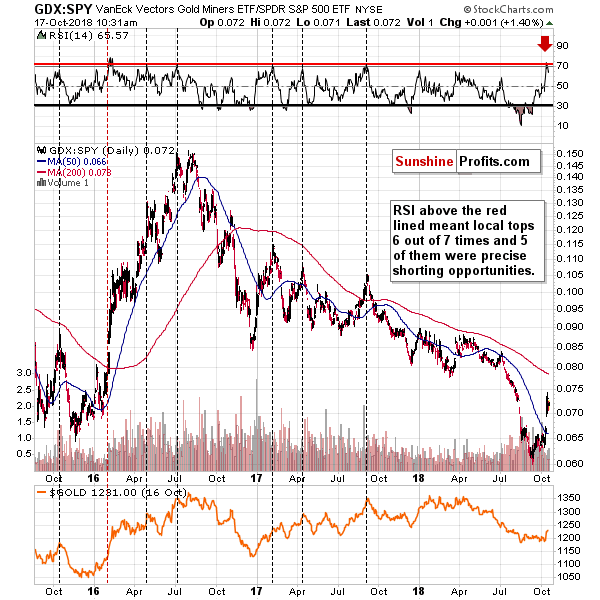
Onthe short-term chart, we see that the rally was so sharp that it triggered one of the most reliable sellsigns (6 out of 7 signals in the past few years were followed bysubstantially lower gold prices). The sell sign is flashed when the RSI basedon the ratio moves visibly above the level of 70. That’s what we just saw.
Wereceived a couple of interesting questions and it seems that our replies mightbe useful also to you. Some of them are about the outlook for the entireprecious metals sector, while the others are specifically for the mining stocksand the Gold Miners Bullish Percent Index.
Oneof the questions was if the current decline in the stock market is going to beas significant as it was in 2008 and if it’s going to drag gold lower as it didin 2008. In our view, it’s possible, but not very likely. Back in 2008, therewas a liquidity crisis and practically all assets declined due to it. Thesituation is not similar to what happened then – there is no liquidity crisis.But, gold is likely to decline in the following weeks anyway due to otherreasons and the current spike in stock market’s volatility is one of thebearish confirmations. In other words, things don’t have to be as bad for thestock market for gold to decline. In fact, they don’t have to be bad at all forgold to decline, but the VIX signal that you can see below makes a decline morelikely.
Gold vs.Stock Market Volatility
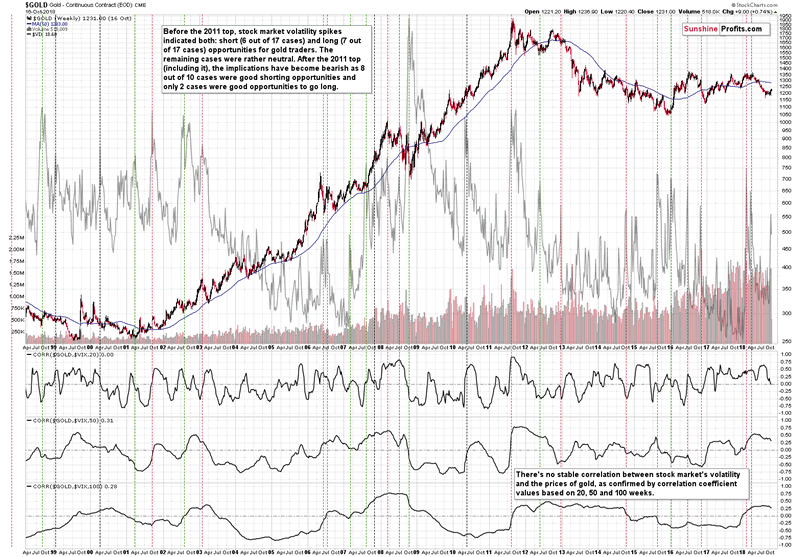
Thespike in VIX, the volatility index, is somethingthat in the vast majority of cases (8 out of 10 since the 2011 top) meantexcellent shorting opportunities in gold. We previously reported 7 out of 9efficiency, as we counted the two previous 2018 spikes as one. It seems thatthe tops were far apart by enough days for them to count as separate cases.What does the above imply for the gold market right now? That it’s likely todecline and that it’s likely to decline significantly. That’s right – what we’re seeing in the general stock market is not abullish factor for gold, but a bearish one and the above charts clearly showsit.
The BoomerangCoT & Inverse H&S Questions
Anotherquestion was about the situation in the CoT reports and if it’s likely totrigger a rally here. We already commented on these reports usefulness in thepast and nothing changed in that regard, so instead of replying once again, wewill invite you to read our previous analysis of CoT’s usefulness andproblems related to it.
Therewas also a question about the possibility of seeing an inversehead-and-shoulders in gold in a long-term basis. It’s one of the boomerangquestions that we get asked on regular basis (the same goes for the CoTquestions). Just like the CoT question, it was already replied to earlier. Youcan read the full analysis here, but thelong-story-short version is that the pattern is very far from being completedand as such has no implications at this time. It simply doesn’t exist.
Gold toRally NOW Based on Fundamentals?
Wewere asked if gold is starting a major rally due to the trade wars, and otherfundamental factors. And our reply is that despite the very short-term pricemoves, the fundamentals are unlikely todetermine the market’s short-term and – to some extent –medium-term trend. They can tell that the market is going to rally in thefollowing years (!), but they don’t say much about the next few months. Are fundamentalspositive? We agree – it means that gold can soar in the coming years, and itcan just as well rally and decline in the next few months. The technical,cyclical and other analogous factors can be applied to determine where a givenmarket (here: gold) is likely to move in the next several weeks and months.Fundamental details are not likely to indicated the above.
GoldMiners Bullish Percent Index – Context is King
Finally,we were asked if the current reading (26.67) in the Gold Miners’ BullishPercent Index is a bullish factor. It’s not.
Asa reminder, the Gold Miners Bullish Percent Index ($BPGDM) is a gauge ofoverbought and oversold conditions for the gold mining sector. It is a breadthindicator based on the number of stocks with Point & Figure buy signals (aPoint & Figure chart emphasizes strong moves while ignoring small ones)within this index. You can see the last several years of its performance below.
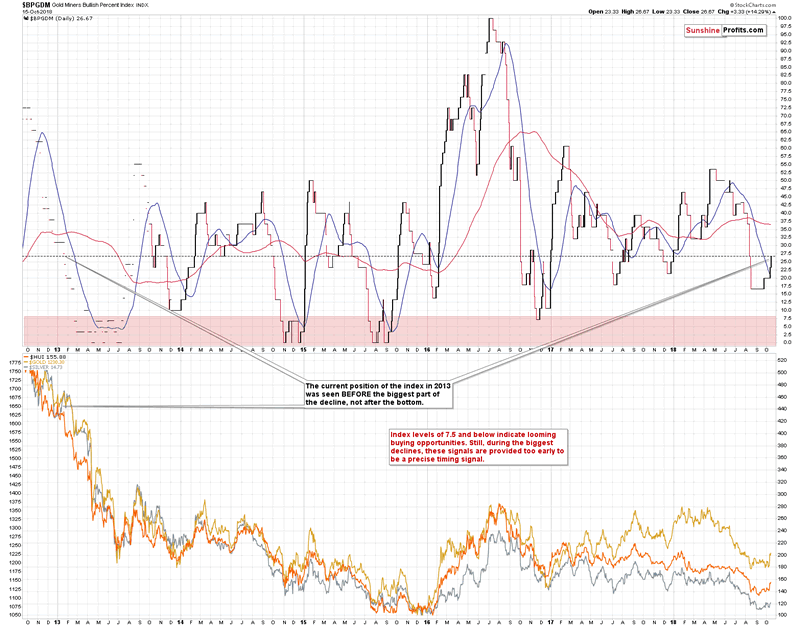
Tobe precise, the current reading is more or less in the middle (median) of thetrading range. The only exception that we saw was in the first half of 2016.The index moved a bit higher recently, but it didn’t start the rally from veryoversold levels. The current move so far seems similar to what we saw inOctober and November 2016, before the sizable decline and in the final part ofthe corrective upswing. Is any of the above bullish? Not really.
Yes,the index is closer to being oversold than to being overbought, but that’s notan indication of a bottom. In fact, in 2013 when we saw similar values of theGold Miners Bullish Percent Index, we the real decline was only starting. Giventhe similarities to what happened 5.5 years ago, should the current value of the index be viewed as something bullish oran indication that the bottom is in? Definitely not. Some may even say thatit’s a bearish indication, because the true bottom was so much lower in 2013.In fact, the final bottom was not even in, when the index moved to 0 for thefirst time. Consequently, if this is THE final decline in the precious metalssector, it might be best to view theGold Miners Bullish Percent Index and it’s 0 reading as a “bottom is near” signinstead of viewing it as a sign that says “the bottom is definitely in”.
Summary
Summingup, the breakout in gold and mining stocks was a bullish development for theshort term, but the rally that was likely to be seen based on it, could havealready taken place. This is especially the case given the shape of Monday’s sessionin mining stocks – a clear reversal. As indicated earlier, there are many morefactors that are currently in play and that we describe to our subscribers and the outlook isnot as bullish as it may seem at the first sight. Even in case of the miningstocks there are many bearish factors that are currently in play – it’s notonly the inverse head-and-shoulders that should be paid attention to.
Thank you.
Przemyslaw Radomski, CFA
Founder, Editor-in-chief
Toolsfor Effective Gold & Silver Investments - SunshineProfits.com
Tools für EffektivesGold- und Silber-Investment - SunshineProfits.DE
* * * * *
About Sunshine Profits
SunshineProfits enables anyone to forecast market changes with a level of accuracy thatwas once only available to closed-door institutions. It provides free trialaccess to its best investment tools (including lists of best gold stocks and best silver stocks),proprietary gold & silver indicators, buy & sell signals, weekly newsletter, and more. Seeing is believing.
Disclaimer
All essays, research and information found aboverepresent analyses and opinions of Przemyslaw Radomski, CFA and SunshineProfits' associates only. As such, it may prove wrong and be a subject tochange without notice. Opinions and analyses were based on data available toauthors of respective essays at the time of writing. Although the informationprovided above is based on careful research and sources that are believed to beaccurate, Przemyslaw Radomski, CFA and his associates do not guarantee theaccuracy or thoroughness of the data or information reported. The opinionspublished above are neither an offer nor a recommendation to purchase or sell anysecurities. Mr. Radomski is not a Registered Securities Advisor. By readingPrzemyslaw Radomski's, CFA reports you fully agree that he will not be heldresponsible or liable for any decisions you make regarding any informationprovided in these reports. Investing, trading and speculation in any financialmarkets may involve high risk of loss. Przemyslaw Radomski, CFA, SunshineProfits' employees and affiliates as well as members of their families may havea short or long position in any securities, including those mentioned in any ofthe reports or essays, and may make additional purchases and/or sales of thosesecurities without notice.
Przemyslaw Radomski Archive |
© 2005-2018 http://www.MarketOracle.co.uk - The Market Oracle is a FREE Daily Financial Markets Analysis & Forecasting online publication.