Don't Miss This Important Gold Price Signal! / Commodities / Gold and Silver 2018

It is generally agreed that in a Gold BullMarket, the gold producers lead the way, by outperforming gold bullion. To examine this trend we visitStockcharts.com and pull up a chart that compares mining stocks (GDX) to goldbullion (GLD).
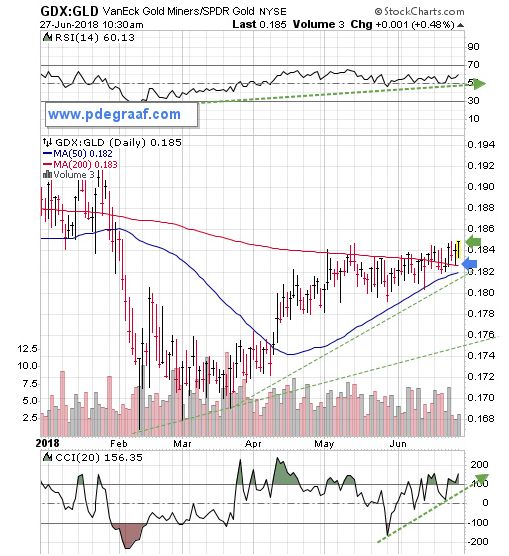
This index bottomed in March and since thenthe miners have moved ahead of gold bullion. The first hurdle, at the 50DMA (blue line) was overcome in April. The next hurdle, at the 200DMA (red line),took several months, but it is now in the process of being ‘put in the rearview mirror’. The blue arrow points tothe fact that for the past three days the daily range has been above theresistance. The supporting indicators(top and bottom of chart), are positive. A rise above the green arrow will convince a lot of investors that thegold sector is ‘the place to be’. The timingis likely to coincide with the resumption of trading, after the US July 4thIndependence Day Holiday.
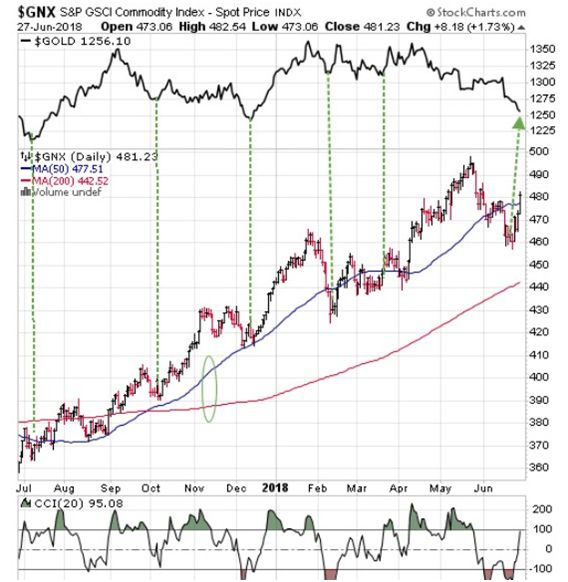
Featured is GNX the commodities index, withthe gold price at the top. The green lines show the correlation betweenbottoms in this index and gold. A turnaround in gold isoverdue.
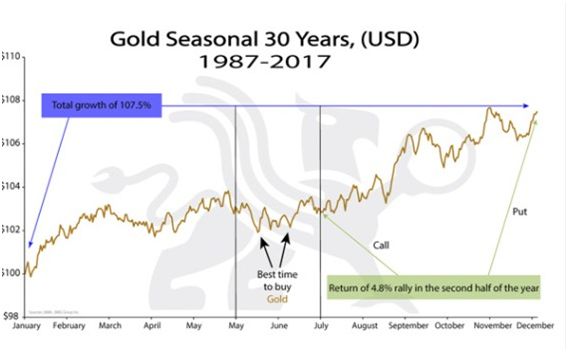
This chart courtesy BMGbullionfunds.comshows June is a good time to buy gold and gold stocks.
Peter Degraaf is NOT responsiblefor your trading decisions. Please doyour own due diligence.
By Peter Degraaf
Peter Degraaf is an on-line stock trader with over 50 years of investing experience. He issues a weekend report on the markets for his many subscribers. For a sample issue send him an E-mail at itiswell@cogeco.net , or visit his website at www.pdegraaf.com where you will find many long-term charts, as well as an interesting collection of Worthwhile Quotes that make for fascinating reading.
© 2018 Copyright Peter Degraaf - All Rights Reserved
DISCLAIMER:Please do your own due diligence. Investing involves taking risks. I am not responsible for your investmentdecisions.
Peter Degraaf Archive |
© 2005-2018 http://www.MarketOracle.co.uk - The Market Oracle is a FREE Daily Financial Markets Analysis & Forecasting online publication.