Gold and Silver, Lockdowns and Reopening / Commodities / Gold & Silver 2020

Theaction in silver is really interesting. Let’s check the prospects for volatilewhite metal, and the relevant historical analogy it offers. Is the major 2008 –2020 analogy in terms of price moves remains intact? In short, yes.
SilverShares Its Two Cents
Silverplunged to our initial target level and reversed shortly after doing so. It wasfor many months that we’ve been featuring the above silver chart along with theanalogy to the 2008 slide. People were laughing at us when we forecastedsilver below $10.
Well,the recent low of $11.64 proves that we were not out of our minds after all.Our initial target was reached, and as we had explained earlier today, theentire panic-driven plunge has only begun.
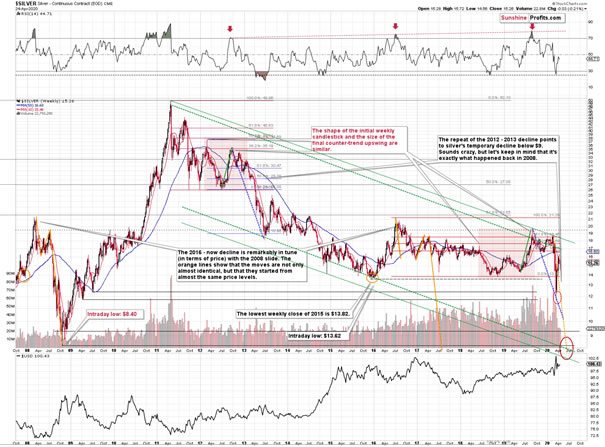
Thosewho were laughing the loudest will prefer not to notice that silver reversedits course at a very similar price level at which it had reversed initially in2008. It was $12.40 back then, but silver started the decline from about 50cent higher level, so these moves are very similar.
Thismeans that the key analogy in silver (in addition to the situation beingsimilar to mid-90s) remains intact.
Italso means that silver is very likely to decline AT LEAST to $9. At this pointwe can’t rule out a scenario in which silver drops even to its all-time lowsaround $4-$5.
Note:Silver at or slightly below $8 seems most probable at this time.
Crazy,right? Well, silver was trading at about $19 less than a month ago. These arecrazy times, and crazy prices might be quite realistic after all. The worst isyet to come.
Let’squote what the 2008-now analogy is all about in case of silver.
Thereis no meaningful link in case of time, or shape of the price moves, but if weconsider the starting and ending points of the price moves that we saw in bothcases, the link becomes obvious and very important. And as we explained in theopening part of today's analysis, price patterns tend to repeat themselves to aconsiderable extent. Sometimes directly, and sometimes proportionately.
Therallies that led to the 2008 and 2016 tops started at about $14 and we markedthem both with orange ellipses. Then both rallies ended at about $21. Then theyboth declined to about $16. Then they both rallied by about $3. The 2008 topwas a bit higher as it started from a bit higher level. And it was from thesetops (the mid-2008 top and the early 2017 top) that silver started its finaldecline.
In2008, silver kept on declining until it moved below $9. Right now, silver'smedium-term downtrend is still underway. If it's not clear that silver remainsin a downtrend, please note that the bottoms that are analogous to bottoms thatgold recently reached, are the ones from late 2011 - at about $27. Silvertopped close to $20.
Thewhite metal hasn't completed the decline below $9 yet, and at the same time itdidn't move above $19 - $21, which would invalidate the analogy. This meansthat the decline below $10, perhaps even below $9 is still underway.
Now,some may say that back in 2008, silver rallied only to about $14 and since nowit rallied to about $16, so the situation is now completely different and thatthe link between both years is broken. But that’s simply not true.
Thenominal price levels are just one of the ways that one should look at theanalogy – far from being the perfect or most important one.
Pleasenote that back in 2008, there were two smaller bottoms in silver, and this timewe saw just one. The decline before the bottom was sharper, so is it reallythat surprising that the rebound was sharper as well? Silver ended the 2008corrective upswing once it moved visibly above the declining orange line andthat’s exactly what happened recently. It also topped once it reached its10-week movingaverage (red line). That’s exactly what just happened.
ThisMA is at $15.48 and at the moment of writing these words, silver is back belowit, trading at $15.35.
Thesituations are not perfectly identical in terms of nominal prices, but theyremain remarkably similar given how different fundamentalreasons are behind these price moves (in reality, what’s behind bothdeclines is fear that – itself - doesn’t change).
Thetechnique used for predicting silver price is clearer than the one that weapplied for gold, so it seems useful to look not only at the USD Index forsigns, but also at the white metal itself. Once silver moves to $8 or below it,it will likely serve as a strong buy sign for gold, regardless of the price atwhich gold will be trading at that time.
Also,please note that silver formed a big shootingstar candlestick during the previous week, which is a topping sign.The volume was low, but it was not low just during the formation of thiscandlestick, but it’s been low during this month’s upswing as well. It’srelatively unclear whether the volume is confirming or invalidating theshooting star. Consequently, we view it as a bearish confirmation, and wewouldn’t open a position based just on it. However, since it’s just one of thefactors pointing to much lower silver prices in the next few weeks, we view thevery bearish outlook as justified.
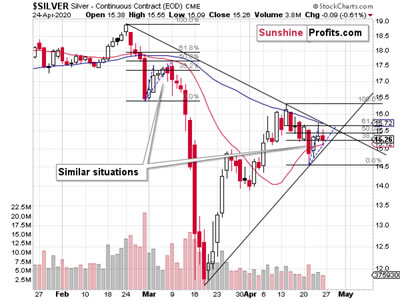
Onthe short-term note, we see that silver is more or less repeating itsearly-March performance. The price moves are not identical in terms of the Fibonacciretracement levels, but comparing the size and shape of the initialrallies (blue dashed lines) we get almost identical results. After rallyingsharply initially, silver started to do… pretty much nothing. That was the samein early March. It was after a few additional days, when silver’s correctiveupswing had really ended, and the big slide started.
Ifthe similarity to the early-March continues, we can expect the decline to starton Wednesday or very close to it. Please note that silver’s first few days ofthe decline were noticeable, but not huge. However, once silver broke below itsprevious lows, it took only three sessions for the white metal to slide below$12. Let’s keep in mind that previously silver started from higher pricelevels.
The implications are bearish for the followingfew weeks and rather neutral for the next few days.Theabove article is a small sample of what our subscribers enjoy on a daily basis.Check more of our free articles on our website, including this one – justdrop by and have a look. Weencourage you to sign up for our daily newsletter, too - it's free and if youdon't like it, you can unsubscribe with just 2 clicks. You'll also get 7 daysof free access to our premium daily Gold & Silver Trading Alerts to get ataste of all our care. Signup for the free newsletter today!
Thank you.
Przemyslaw Radomski, CFA
Founder, Editor-in-chief
Toolsfor Effective Gold & Silver Investments - SunshineProfits.com
Tools für EffektivesGold- und Silber-Investment - SunshineProfits.DE
* * * * *
About Sunshine Profits
SunshineProfits enables anyone to forecast market changes with a level of accuracy thatwas once only available to closed-door institutions. It provides free trialaccess to its best investment tools (including lists of best gold stocks and best silver stocks),proprietary gold & silver indicators, buy & sell signals, weekly newsletter, and more. Seeing is believing.
Disclaimer
All essays, research and information found aboverepresent analyses and opinions of Przemyslaw Radomski, CFA and SunshineProfits' associates only. As such, it may prove wrong and be a subject tochange without notice. Opinions and analyses were based on data available toauthors of respective essays at the time of writing. Although the informationprovided above is based on careful research and sources that are believed to beaccurate, Przemyslaw Radomski, CFA and his associates do not guarantee theaccuracy or thoroughness of the data or information reported. The opinionspublished above are neither an offer nor a recommendation to purchase or sell anysecurities. Mr. Radomski is not a Registered Securities Advisor. By readingPrzemyslaw Radomski's, CFA reports you fully agree that he will not be heldresponsible or liable for any decisions you make regarding any informationprovided in these reports. Investing, trading and speculation in any financialmarkets may involve high risk of loss. Przemyslaw Radomski, CFA, SunshineProfits' employees and affiliates as well as members of their families may havea short or long position in any securities, including those mentioned in any ofthe reports or essays, and may make additional purchases and/or sales of thosesecurities without notice.
Przemyslaw Radomski Archive |
© 2005-2019 http://www.MarketOracle.co.uk - The Market Oracle is a FREE Daily Financial Markets Analysis & Forecasting online publication.