Gold/Dollar-Multi year breakout, says Joe Friday
By Chris Kimble / September 08, 2017 / kimblechartingsolutions.com / Article Link

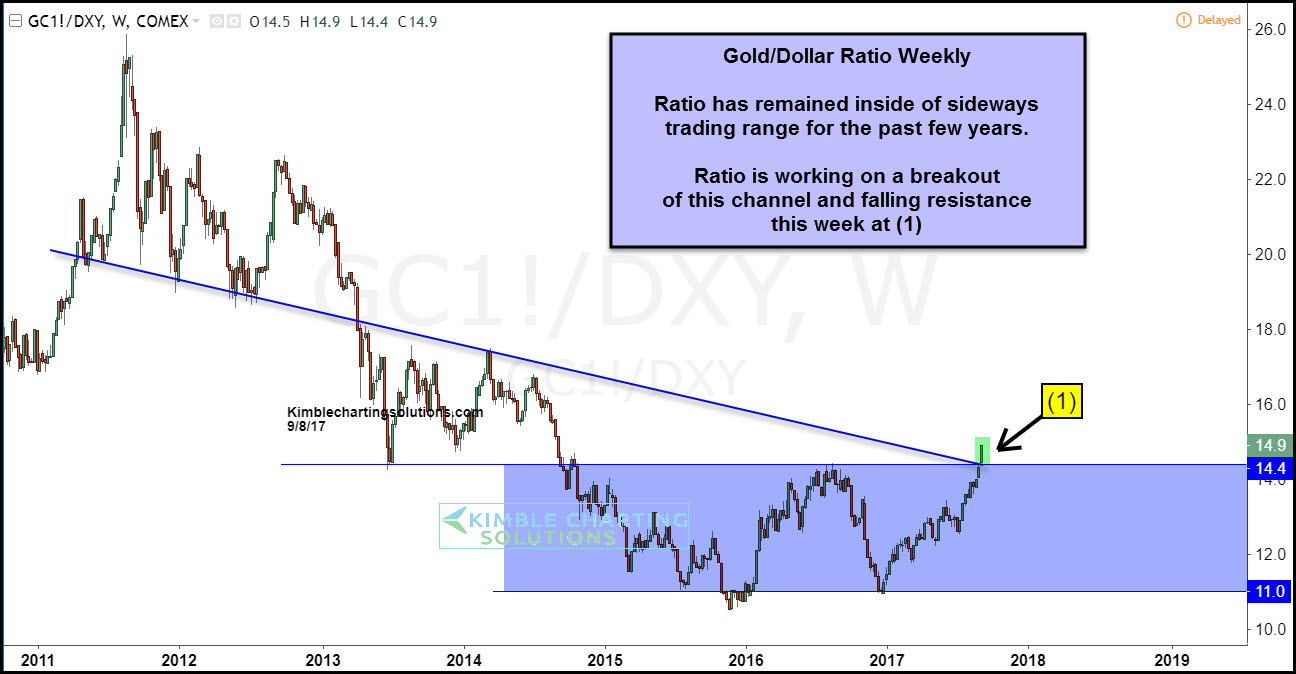
Gold has been weaker than the US$ since 2011 highs, highlighted in Gold/Dollar chart below. The ratio is attempting to do something this week that it hasn't been able to accomplish the past few years-
CLICK ON CHART TO ENLARGE
The ratio has traded sideways for the past three years, inside the blue shaded zone-
Joe Friday Just The Facts Ma'am- Gold/Dollar ratio is attempting a breakout above dual multi-year resistance this week at (1).
Gold/Dollar strength in the past has been positive for Gold, Silver and Miners. Will it be different this time?
To send a positive message to these assets that these assets are attempting to break a multi-year trend, one needs to see the ratio continue higher.
Recent News
Gold stocks gain even as metal price pulls back
April 29, 2024 / www.canadianminingreport.com
Copper price forecast swinging significantly on shifting outlook
April 29, 2024 / www.canadianminingreport.com
Upgrades continue for 2024 gold price target...
April 22, 2024 / www.canadianminingreport.com
Gold stocks edge up as weak equities offset metal rise
April 22, 2024 / www.canadianminingreport.com
Major investment banks make major gold price upgrades
April 15, 2024 / www.canadianminingreport.com