Gold's Downtrend: Is This Just the Beginning? / Commodities / Gold and Silver 2021

With the yellow metal just posting itslowest close since June and a bearish pattern forming, how vulnerable is goldto a further decline?
Gold and mining stocks just broke to newyearly lows – as I warned you in my previous analyses. And that’s only thebeginning.
Let’s jump right into the charts,starting with gold.
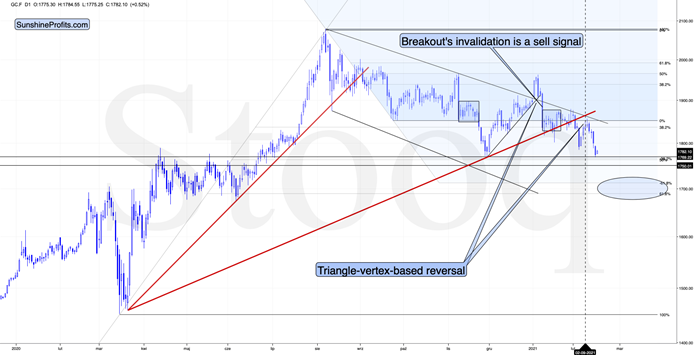
Figure1 - COMEX Gold Futures
In early February, gold broke below therising red support line and it then verified it by rallying back to it and thendeclining once again. It topped almost exactly right at itstriangle-vertex-based reversal, which was yet another time when this technique proved to be very useful.
Gold has just closed not only at newyearly lows, but also below the late-November lows (in terms of the closingprices, there was no breakdown in intraday terms). This means that yesterday’s(Feb. 17) closing price was the lowest daily close since late June 2020. At themoment of writing these words, gold is also trading below the April 2020intraday high.
Goldwas likely to slide based on myriads of technical and cyclical factors, whilethe fundamental factors remain very positive –especially considering that we are about to enter the Kondratiev winter, or weare already there. As a reminder, Kondratiev cycles are one of the longest cycles and the stages of the cycle take namesafter seasons. “Winter” tends to start with a stock market top that is causedby excessive credit. In this stage gold is likely to perform exceptionallywell… But not right at its start. Even the aftermath of the 1929 top (“Winter”started then as well), gold stocks declined for about 3 months before soaring.In the first part of the cycle, cash is likely to be king. And it seems thatthe performance of the USD Index is already telling investors to buckle up.
And speaking of stocks, what about miningstocks? As you might already well know, just as with gold, the miners movedbelow the November lows in terms of both the intraday prices and daily closingprices. What does that mean? If you’d like to explore mining stocks in detailand are curious to know more about their prices and possible exit levels, thenour fullversion of the analyses contains exactly what you need to know.
Getting back to gold…
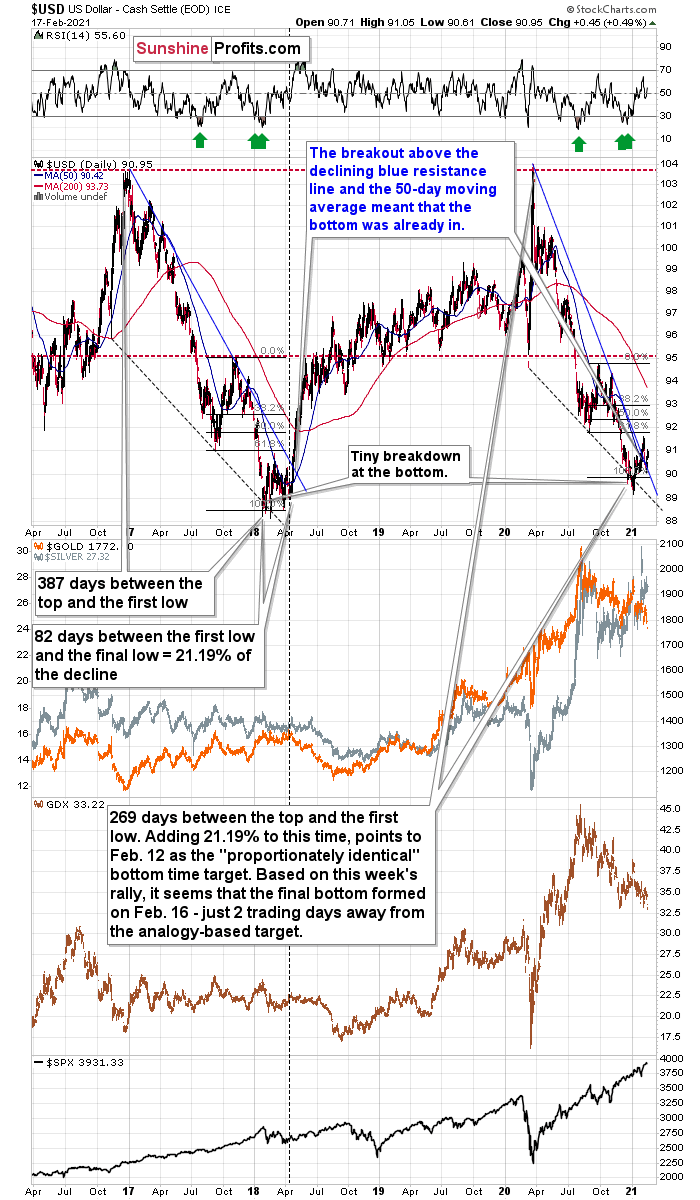
Figure2
If the fact that gold invalidated itsbreakout above its 2011 high, despite the ridiculously positive fundamentalsituation, doesn’t convince you that gold does not really “want” to move higher before declining profoundly first,then the above chart might.
As I wrote above, gold is currently moreor less when it was trading at the April 2020 top. Where was the USD Indextrading back then? It was moving back and forth around the 100 level.
100!
The USD Index closed a little below 91,and goldis at the same price level! That’s a massive 9 index-point declinein the USDX that gold shrugged off just like that.
There’s no way that gold could “ignore”this kind of movement and be “strong” at the same time. No. It’s been very weakin the previous months, which is a strong sign (not a fundamental one, but acritical one nonetheless) that gold is going to move much lower once the USD Index finally rallies back up.
Right now, waiting for gold to rally islike waiting for the light to turn green, arguing that eventually it has toturn green, while not realizing that the light is broken (gold just didn’trally despite the huge decline in the USDX). Yes, someone will fix it and eventually it will turn green, but itdoesn’t mean that it makes much sense to wait for that to happen, instead oflooking around and crossing the street if it’s safe to do so.
Yes, gold is likely to rally to new highsin the coming years. And silver is likely to skyrocket. But in light of justtwo of the above-mentioned factors (gold’s extreme underperformance relative tothe USD Index and the invalidation of a critical breakdown) doesn’t it make sensenot to purchase gold right now (except for the insurance capital that is) inorder to buy it after several weeks / few months when it’s likely to be tradingat much lower levels?
We live in very specific times. Getting a“like” on a post or picture becomes a necessary daily activity and means ofself-validation. Not “liking” something that others posted or that is massively“liked” may be frowned upon or even viewed as being disrespectful. Plus, itseems that no matter what you do, everyone gets offended very easily. When didhonesty, independence and common-sense stop being virtues?
When it comes to gold investmentanalysis, it’s surprisingly similar. You either like gold and think that it’sgoing higher right away or you’re “one of them”. “Them” can be anyone who triesto manipulategold or silver prices, “banksters”, or some kind of unknown enemy. “ Analysts' ” goal is often no longer to be as objective as possible and to provide as goodand as unbiased an analysis as possible, but to simply be cheering for gold andprovide as many bullish signals as possible regardless of what one reallythinks about them. The above may seem pleasant to readers, but it’s not reallyin their best interest. In order to make the most of any upswing, it’s best toenter the market as low as possible and to exit relatively close to the top. Whathappens before a price is as low as possible? It declines. Why would somethinglike that (along with those describing it) be hated by gold investors? It makesno sense, but yet, it’s often the case.
Top of Form
Bottom of Form
The discussion – above and below – can beviewed as something positive or negative for any investor, but while readingit, please keep in mind that our goal is the same as yours – we want to helpinvestors make the most of their precious metals investments. Call usold-fashioned, but regardless of how unpleasant it may seem, we’ll continue toadhere to honesty, independence and common-sense in all our analyses
Ok,but why on Earth would the USD Index rally back up? The Fed is printing so muchdollars – why would they be worth more?!
Because the currencies are valued withrelation to each other and whether or not the USD Index moves higher or lowerdoesn’t depend only on what the Fed is doing.
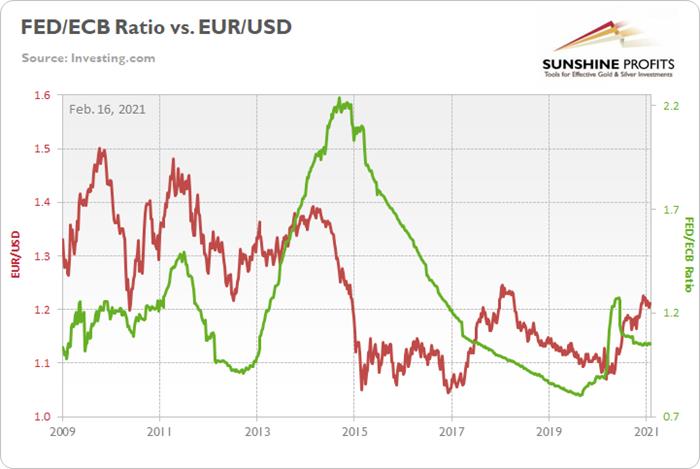
Figure3
What other monetary authorities domatters as well and right now the ECB is outprinting the Fed (that’s what the decline in the green line above means),which means that the euro is likely to fall more than the U.S. dollar.Therefore, the EUR/USD currency exchange rate would be likely to decline andsince this exchange rate is the biggest (over 50%) component of the USD Index,it makes perfect sense – from the fundamental point of view – to expect the USDIndex to move higher.
Can gold rally despite higher USD Indexvalues? Absolutely. However, it would first have to start to behave “normally” relative to the USD Index, and before that happens it would have to stop being extremelyweak relative to it. And the fact that gold is at the same price level despite a 9-index-point decline in the USDX is extremeweakness.
To make the technical discussion easier,I’m attaching the previous chart once again.

Figure4
OnMonday (Feb. 15), I wrote the following about the above chart:
The size and shape of the2017-2018 analogue continues to mirror the current price action . However, today, it’s taken118 less days for the USD Index to move from peak to trough.
Also,it took 82 days for the USDX to bottom in 2017-2018 (the number of days betweenthe initial bottom and the final bottom) and the number amounts to 21.19% ofthe overall duration. If we apply a similar timeframeto today’s move, it implies that a final bottom may have formed on Feb. 12. Asa result, the USDX’s long-term upswing could begin as soon as this week.
Alsonoteworthy, as the USDX approached its final bottom in 2017-2018, gold tradedsideways. Today, however, gold is already in a downtrend. From a medium-termperspective, the yellow metal’s behavior is actually more bearish than it wasin 2017-2018.
Alsosupporting the historical analogue, the USD Index’s current breakout above its50-day moving average is exactly what added gasoline to the USDX’s 2018 fire.Case in point? After the 2018 breakout, the USDX surgedback to its previous high. Today, that level is roughly 94.5.
Based on this week’s rally it seems thatthe final bottom formed on Tuesday (Feb. 16) – just 2 trading days away fromthe analogy-based target, and in perfect tune with what I wrote back then. Thebreakout above both: the declining blue line, and the 50-day moving average wasverified, and the short-term outlook here is clearly bullish.
Butisn’t the current situation similar to what happened in mid-2020? The correctionthat was followed by another decline?
In a way, it is. In both cases, the USDIndex moved higher after a big decline, but that’s about it as far as importantsimilarities are concerned.
What is different is the entire context.Even a single look at the above chart provides an instant answer. The mid-2020correction was like the mid-2017 correction, and what we see right now is thepost-bottom breakout, just as we saw in the first half of 2018.
There are multiple details on the abovechart that confirm it, including the sizes of the medium-term declines, theposition of the price relative to the declining support/resistance lines, aswell as relative to the 50-day moving average, and even the green arrows in the RSIindicator show how similar the preceding action was in case of thisindicator. The vertical dashed line shows “where we are right now” in case ofthe analogy.
Also, the fact that the general stockmarket has not yet declined in anysubstantial way only makes the short-term outlook worse (particularly for silver and miners). When stocks do slide, they would be likely to impact the prices ofminers and silver particularly strongly.
And please remember, we’re looking forthe bottom in the precious metals sector not because we’re the enemy of gold orthe precious metals investor . On the contrary, we’re that true friend thattells you if something’s not right, even if it may be unpleasant to hear. Wewant to buy more and at better prices close to the bottom, and we’ll continueto strive to assist you with that as well.
Thank you for reading our free analysistoday. Please note that the above is just a small fraction of today’sall-encompassing Gold & Silver Trading Alert. The latter includes multiplepremium details such as the targets for gold and mining stocks that could bereached in the next few weeks. If you’d like to read those premium details, wehave good news for you. As soon as you sign up for our free gold newsletter,you’ll get a free 7-day no-obligation trial access to our premium Gold &Silver Trading Alerts. It’s really free – sign up today.
Przemyslaw Radomski, CFA
Founder, Editor-in-chief
Toolsfor Effective Gold & Silver Investments - SunshineProfits.com
Tools für EffektivesGold- und Silber-Investment - SunshineProfits.DE
* * * * *
About Sunshine Profits
SunshineProfits enables anyone to forecast market changes with a level of accuracy thatwas once only available to closed-door institutions. It provides free trialaccess to its best investment tools (including lists of best gold stocks and best silver stocks),proprietary gold & silver indicators, buy & sell signals, weekly newsletter, and more. Seeing is believing.
Disclaimer
All essays, research and information found aboverepresent analyses and opinions of Przemyslaw Radomski, CFA and SunshineProfits' associates only. As such, it may prove wrong and be a subject tochange without notice. Opinions and analyses were based on data available toauthors of respective essays at the time of writing. Although the informationprovided above is based on careful research and sources that are believed to beaccurate, Przemyslaw Radomski, CFA and his associates do not guarantee theaccuracy or thoroughness of the data or information reported. The opinionspublished above are neither an offer nor a recommendation to purchase or sell anysecurities. Mr. Radomski is not a Registered Securities Advisor. By readingPrzemyslaw Radomski's, CFA reports you fully agree that he will not be heldresponsible or liable for any decisions you make regarding any informationprovided in these reports. Investing, trading and speculation in any financialmarkets may involve high risk of loss. Przemyslaw Radomski, CFA, SunshineProfits' employees and affiliates as well as members of their families may havea short or long position in any securities, including those mentioned in any ofthe reports or essays, and may make additional purchases and/or sales of thosesecurities without notice.
Przemyslaw Radomski Archive |
© 2005-2019 http://www.MarketOracle.co.uk - The Market Oracle is a FREE Daily Financial Markets Analysis & Forecasting online publication.