Gold & Silver- Potential monster bullish pattern says Joe Friday

Below looks at the ratio of Silver to Gold over the past 30-years. Metals bulls historically receive a bullish message when this ratio is moving higher. Back in 2011, the ratio hit highs that took place in the early 1980's and its been downhill for Gold and Silver ever since. Could the long-term trend in metals be about to change?
CLICK ON CHART TO ENLARGE
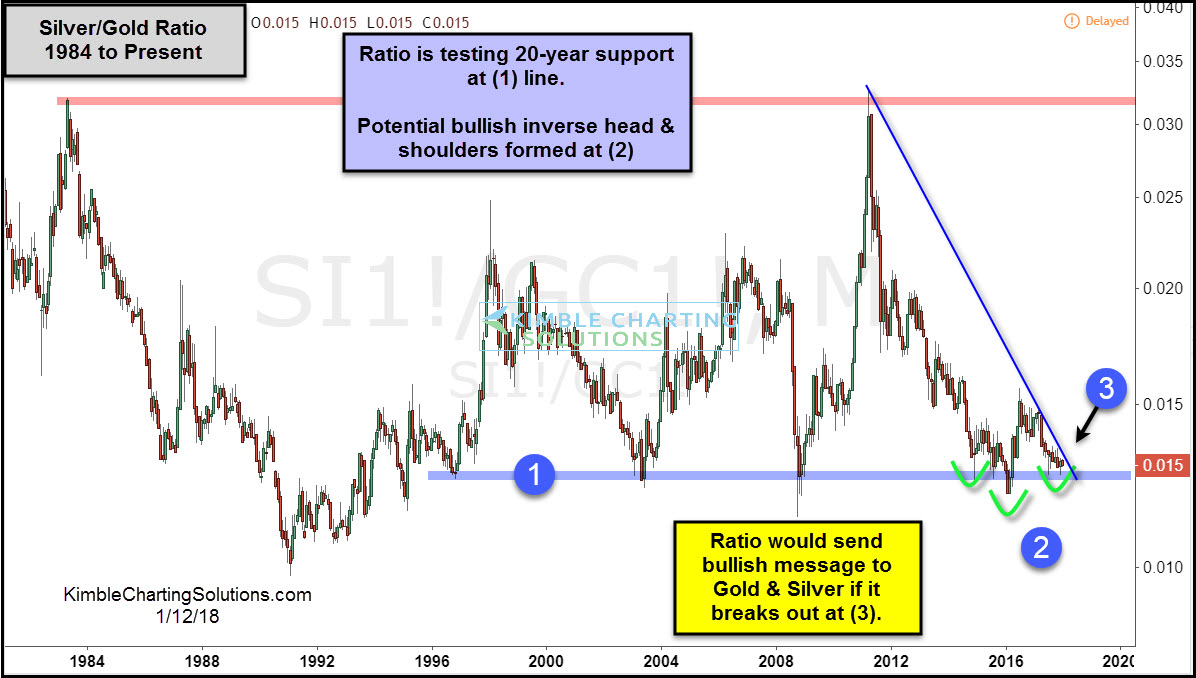
The decline in the ratio now has it testing 20-year support line (1), which has held several times over the past 20-years.
Over the past couple of years, the ratio has tested line support line (1) at (2), which has held. While testing line (1), the ratio could be creating a bullish inverse head & shoulders pattern.
Joe Friday Just The Facts; If the read of the inverse head & shoulders pattern is correct and falling resistance is broken to the upside at (3), the ratio could be sending a bullish message not seen many times over the past 7-years!
What do metals bulls NOT want to see? Support line (1) fail to hold!!! If it does, the ratio would continue to send a concerning message to the precious metals markets.
If you would like to receive weekly updates and trade ideas in the Gold, Silver, Miners, Steel and Copper markets, we would be honored if you were a Metals or Premium Member.