Hi-Ho Silver! / Commodities / Gold and Silver 2018

 If the latest COT report for silver getsany more bullish than the one released on March 23rd, commercialtraders will have to go ‘net long!’ Asit is, they reduced their ‘net short’ position to the lowest number in manyyears, down to just 4,000 contracts – barely 2% of the total openinterest! This is bullish action! Asrecently as January 16th the number of ‘net short’ positions was 50,000,and the percentage of open interest was 26%. (Charts are courtesy Goldchartsrus.com unless specified).
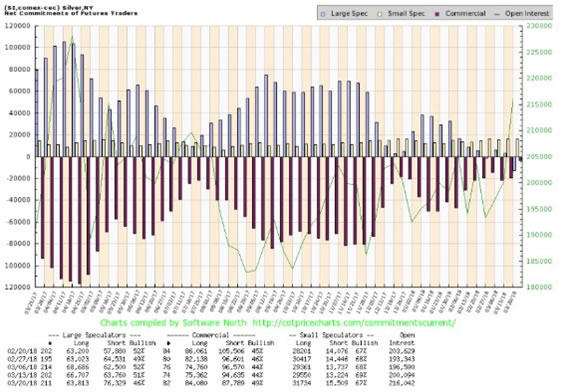
This chart courtesy COT@softwarenorth.com,tells us is that commercial silver traders, such as bullion banks and silver miners,think the silver price has hit bottom, and is likely rise from here.
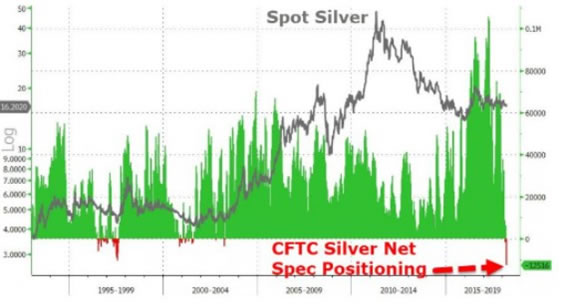
This chart courtesy Zerohedge.com showssilver speculators at the largest short position in at least 28years. From a contrarian perspective this is very bullish.
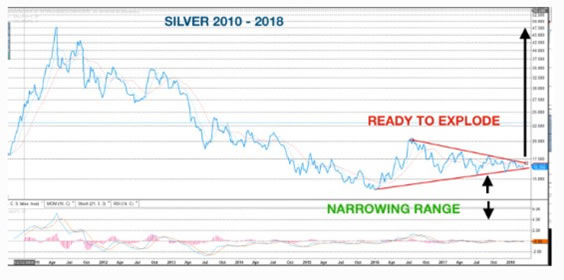
This chart courtesy Goldswitzerland.comshows a bullish wedge formation is forming. An upside breakout will attract many buyers.
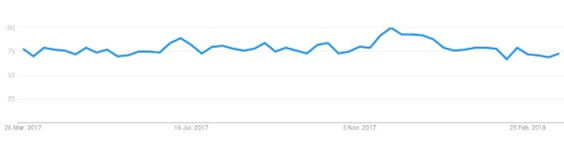
This chart courtesy Google.com shows‘silver searches’ are beginning to rise up from a double bottom.
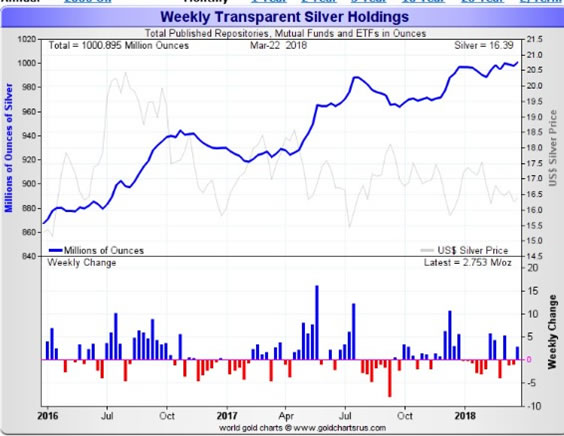
This chart shows the amount of silverbullion that is backing various trusts and ETFs, has been rising steadily formore than two years.
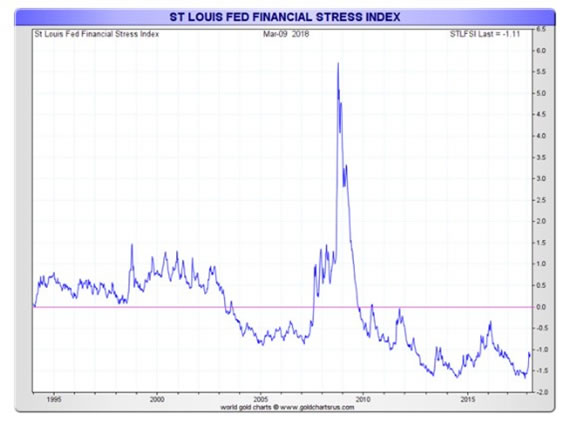
This chart shows the FED’s Financial StressIndex is rising up from a triple bottom. During times of financial turmoil, investors tend to seek the safetyprovided by gold and silver.
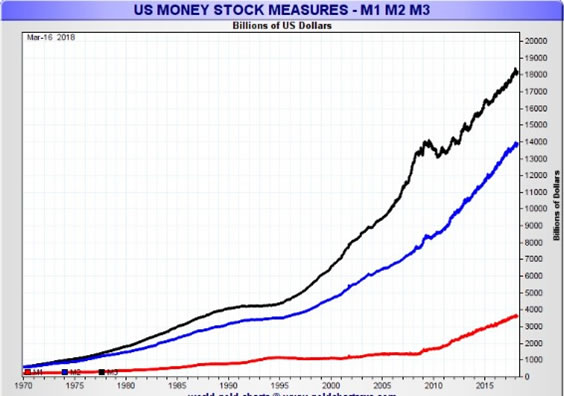
This chart shows US money supply just keepson rising. Newly printed money causesprice inflation, providing energy for gold and silver to rise in price.
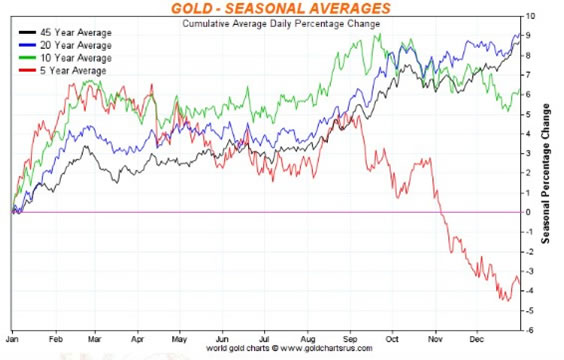
This chart shows the seasonal tendency forthe gold price to consolidate after a dip in March, followed by a steady riseinto October. (Disregard the red linewhich is dominated by a four year bear market).
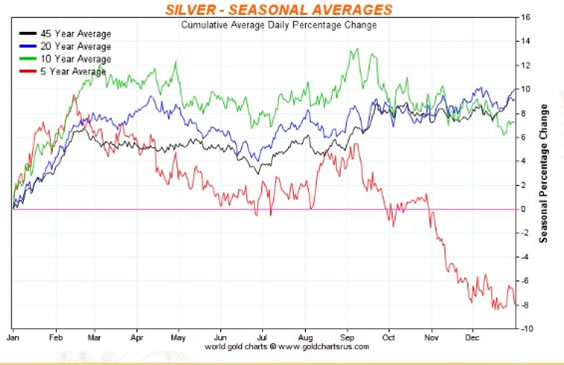
This chart shows the seasonal tendency forsilver to provide buying opportunities during the spring season. Theseopportunities may not last long, if the latest COT report is anyindication. (Disregard the red line asit is dominated by a 5 year bear market).
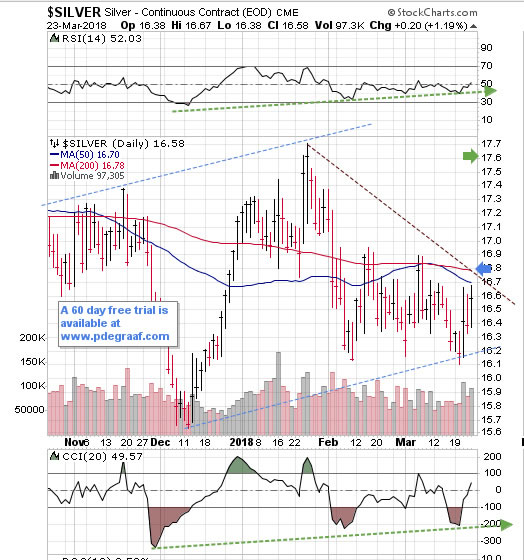
Featured is the daily bar chart for silver,courtesy Stockcharts.com. The silverprice has been slowly rising since December. The RSI at the top and CCI at the bottom, are showing positive supportfor this uptrend. A breakout at the bluearrow sets up a target at the green arrow.
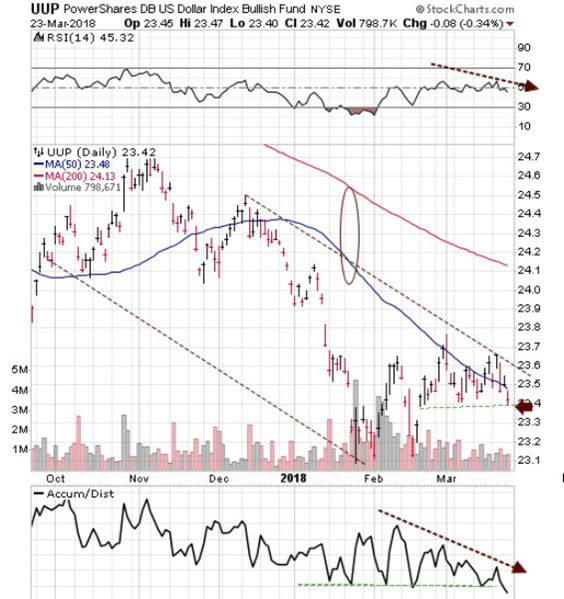
This chart courtesy Stockcharts.comfeatures UUP, the US dollar index ETF. The price has been declining and a drop below the brown arrow is likelyto mark the start of a rapid decline. Since gold and silver are priced in US dollars, a lower dollar raisesthe price of precious metals.
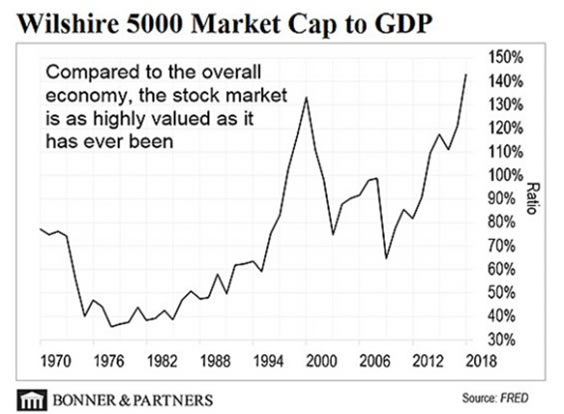
This chart courtesy sources listed showsthe US stock market to be overbought, even with the current pullback. As money begins to leave the stock market,some of it will trickle into the precious metals sector. That is what happened in 2001-2002 after thestock market decline.
Peter Degraaf is NOT responsiblefor your trading decisions. Please doyour own due diligence.
By Peter Degraaf
Peter Degraaf is an on-line stock trader with over 50 years of investing experience. He issues a weekend report on the markets for his many subscribers. For a sample issue send him an E-mail at itiswell@cogeco.net , or visit his website at www.pdegraaf.com where you will find many long-term charts, as well as an interesting collection of Worthwhile Quotes that make for fascinating reading.
© 2018 Copyright Peter Degraaf - All Rights Reserved
DISCLAIMER:Please do your own due diligence. Investing involves taking risks. I am not responsible for your investmentdecisions.
Peter Degraaf Archive |
© 2005-2018 http://www.MarketOracle.co.uk - The Market Oracle is a FREE Daily Financial Markets Analysis & Forecasting online publication.