How the Eurozone Affects Gold Price and Why You Should Care / Commodities / Gold and Silver 2021

In our globalized economy, currencypairs have a negative correlation with gold, so how does the current EUR/USDsituation impact the yellow metal?
It pays to pay attention to what ishappening in Europe. As is well known, there are many currency pairs in theworld, but the most traded one is the EUR/USD. How does that affect you as agold investor? The equation goes something like this: if the economy of theEurozone sinks and takes the EUR down with it, the USD rises – and vice-versa.Gold, which is usually inversely related to the dollar, will also either riseor decline based on the latter’s behavior.
Before we get to Europe though, let’stake a look at what gold is currently doing.
Once again, yesterday’s (Jan. 26) sessionwas relatively uneventful on the technical front, but that doesn’t mean thatthe outlook is any more bullish.
Conversely, it remains bearish because ofmultiple developments that happened before the current pause. For instance, theinvalidation of gold’sbreakout above its 2011 high. Even though it had help from a slidingUSD Index, the yellow metal still failed to hold above this critical supportlevel.
It seems that the only thing that madegold rally in the recent past was the U.S. inauguration-based uncertainty. Asit fades away, gold is losing its gleam. In fact, the previous relative weakness seems to have already returned.
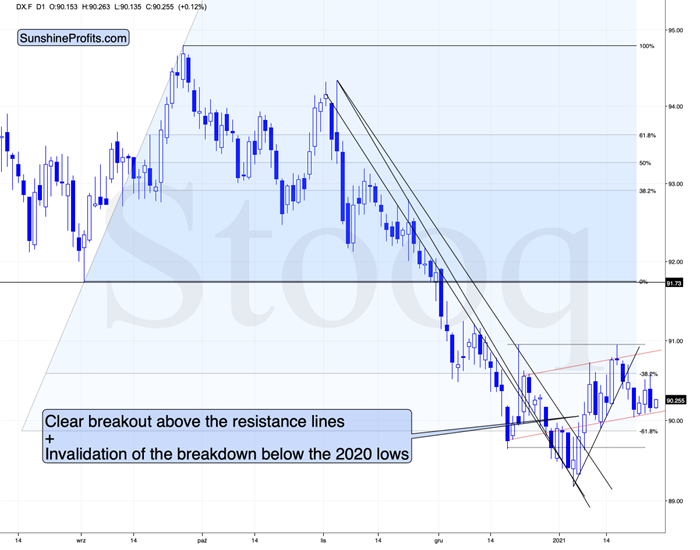
Figure1 – USD Index futures (DX.F)
Taking the previous two days into account(precisely: yesterday and today’s pre-market trading), we see that the USDIndex declined. In such a situation, gold should have rallied or at leastpaused, but what did it do?
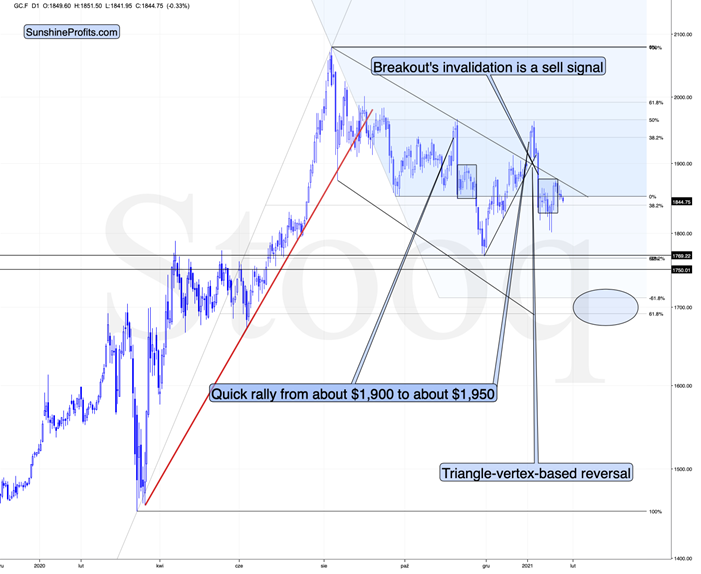
Figure2 - COMEX Gold Futures (GC.F)
Gold declined. This means that gold’sweakness relative to theUSDX is back.
Looking at the above chart, I marked theNovember consolidation with a blue rectangle, and I copied it to the currentsituation, based on the end of the huge daily downswing. Gold moved brieflybelow it in recent days, after which it rallied back up, and right now it’svery close to the upper right corner of the rectangle.
This means that the current situationremains very similar to what we saw back in November, right before anotherslide started – and this second slide was bigger than the first one.Consequently, there’s a good reason for goldto reverse any day (or hour) now.
Let’s get back to the USD Index for a minute.
I think that the USD Index is likely torally in the following weeks, but as far as the next several days areconcerned, the situation is relatively unclear.
The USD Index finds itself after thebreakout above the declining medium-term resistance line, but it’s also after abreakdown below the rising short-term support line. Consequently, it’s veryshort-term outlook is relatively unclear. In all cases, I don’t see it movingvisibly below the previous 2021 low.
And since the situation is unclear withregard to the short-term in case of the USDX, it would be natural for gold tohesitate. Since it’s already declining, it seems that even if the USDX testedits previous 2021 low, gold would not rally far.
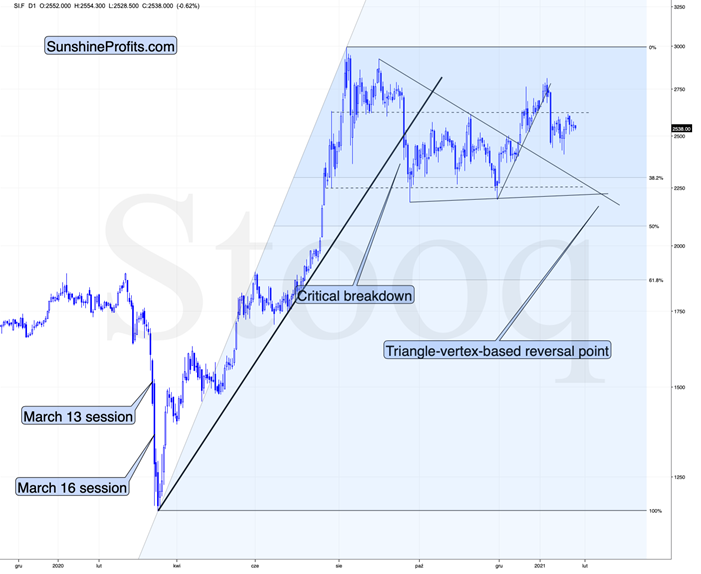
Figure3 - COMEX Silver Futures (SI.F)
Similarly to gold, silver is not doingmuch. The white metal is moving back and forth after the big January slide andit seems to be preparing for another move lower.
Let’s keep in mind that silver has atriangle-vertex-based reversal in late February – close to Feb. 23. Based on what we’ve seen so far, it seems quite likely that itwill be a major bottom (not likely the final one for this slide, though).
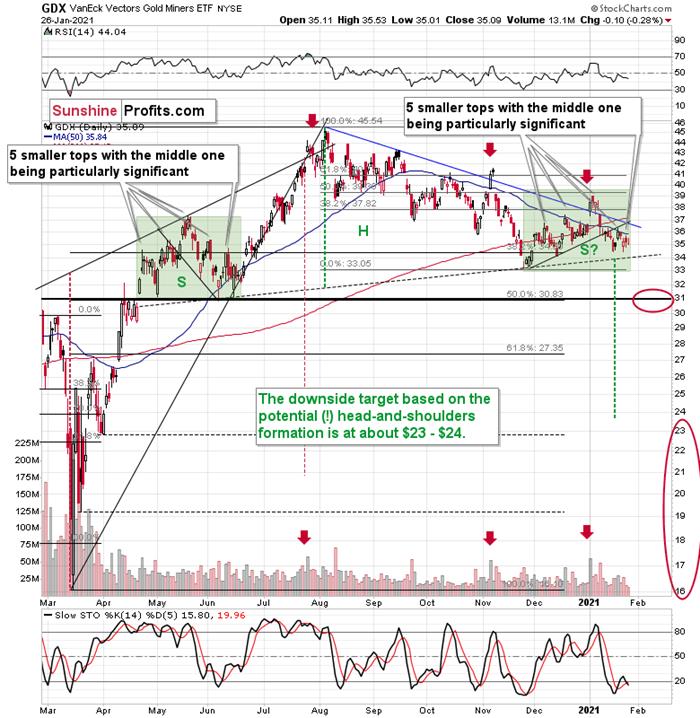
Figure4 - VanEck Vectors Gold Miners ETF (GDX)
Miners didn’t do much yesterday either,so my previous comments on them remain up-to-date. To explain the pattern, Iwrote on Jan. 11 :
Ifyou analyze the chart above, the area on the left (marked S) represents thefirst shoulder, while the area in the middle (H) represents the head and thearea on the right (second S) represents the potential second shoulder.
Rightnow, $33.7-$34 is the do-or-die area. If the GDX breaks below this (where theright shoulder forms) it could trigger a decline back to the $24 to $23 range(measured by the spread between the head and the neckline; marked with green).
Andafter analyzing Thursday’s (Jan. 21) price action, I wrote the following (onJan. 22):
Asfar as the miners are concerned, mining stocks didn’t correct half of their2021 decline. They didn’t invalidate the breakdown below the rising supportline, either. In fact, the GDX ETF closed yesterday’s session below the 50-daymoving average. Technically, nothing changed.
Regardingthe GDX ETF’s current consolidation pattern (November to present), it mirrorswhat we saw between April and June of last year (the shaded green rectanglesabove).
I added:
Both shoulders of the head-and-shoulder formation can be identical, but they don’t have to be , so it’s not that thecurrent consolidation has to end at the right border of the current rectangle.However, the fact that the price is already close to this right border tells usthat it would be very normal for the consolidation to end any day now – mostlikely before the end of January.
Ifwe see a rally to $37, or even $38, it won’t change much – the outlook willremain intact anyway, and the right shoulder of the potentialhead-and-shoulders formation will remain similar to the left shoulder.
Butwith many paths to get there, is hitting $37 or $38 a prerequisite to theeventual decline? Absolutely not. The GDX ETF could reverse right away andcatch many market participants flat-footed.
Remember,it’s important to keep last week’s rally in context. Despite the Yellen-drivenbounce, the GDX ETF is still down considerably from its January highs.
Having said that, let’s take a look atthe market from a more fundamental angle.
The Widening Economic Divergence
For weeks, I’ve been highlighting theeconomic malaise confronting the Eurozone. And like a fork in the road, theU.S. and Europe continue to head in opposite directions. More importantlythough, the fundamental fate of the two regions, and the subsequent performanceof the EUR/USD, will go a long way in determining the precious metals’ destiny.
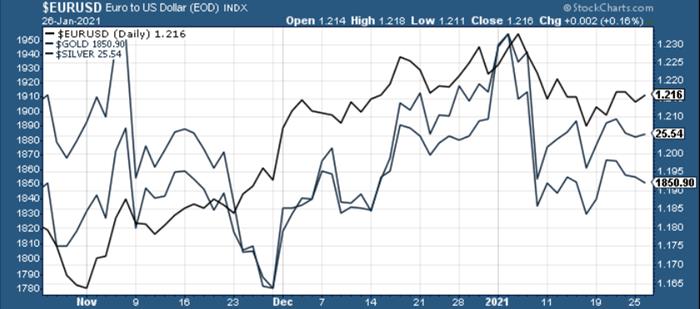
Figure5
If you analyze the chart above, you cansee that gold and silver tend to track the performance of the EUR/USD. Andwhile gold bucked the trend on Tuesday (Jan. 26), silver still remains a loyalfollower. Thus, as the European economy sinks further into quicksand, itsrelative underperformance is likely to pressure the EUR/USD and usher the PMslower.
On Friday (Jan. 22), the IHS MarkitEurozone Composite PMI fell to 47.5 in January (down from 49.1 in December),with services falling to 45.0 (from 46.4) and manufacturing falling to 54.7(from 55.2).
Please see below:
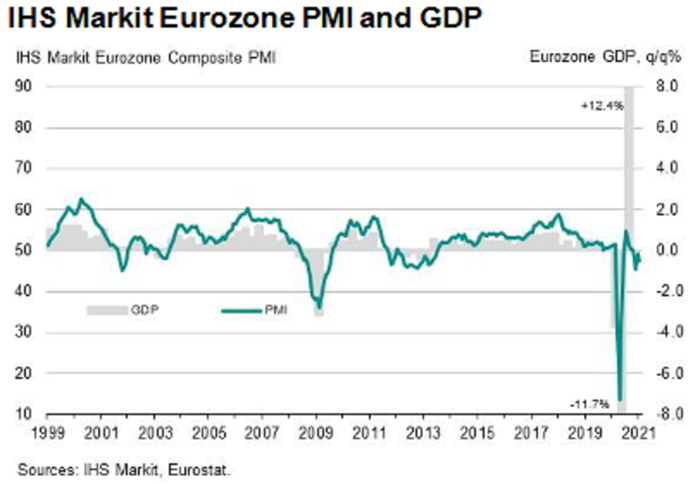
Figure6
To explain, PMI (Purchasing Managers’Index) data is compiled through a monthly survey of executives at more than 400companies. A PMI above 50 indicates business conditions are expanding, while aPMI below 50 indicates that business conditions are contracting (the scale onthe left side of the chart).
In contrast to the Eurozone, the U.S.Composite PMI rose to 58 in January (up from 55.3 in December), with servicesrising to 57.5 (up from 54.8) and manufacturing rising to 59.1 (up from 57.1).
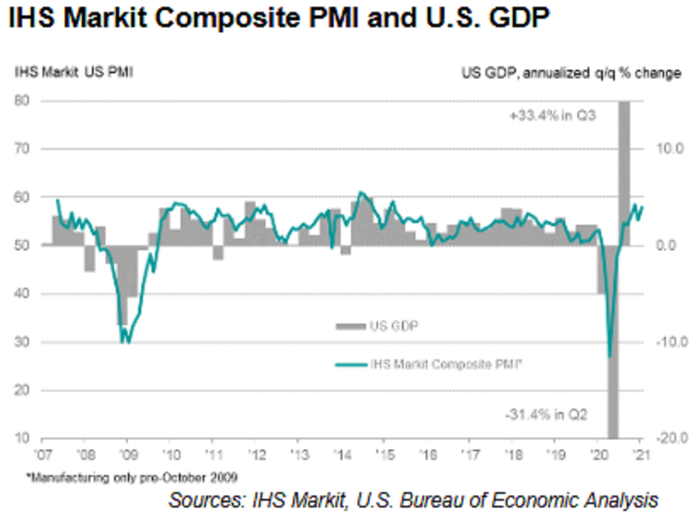
Figure7
In addition, after European Central Bank(ECB) President ChristineLagarde revealed (on Jan. 21) that the Eurozone economy likelyshrank in the fourth-quarter (all but sealing a double-dip recession), Germany(the Eurozone’s largest economy) cut its 2021 GDP growth forecast from 4.4% to3.0%.
And not looking any better, the InternationalMonetary Fund’s (IMF) World Economic Outlook Report – which coversIMF economists' analysis over the short and medium-term – has the U.S. economyexpanding by 5.1% in 2021 versus only 4.2% for the Eurozone. More importantlythough, the Eurozone economy is expected to contract by 7.2% in 2020 versus3.4% for the U.S. As a result, Europe has to dig itself out of a much largerhole.
Please see below:
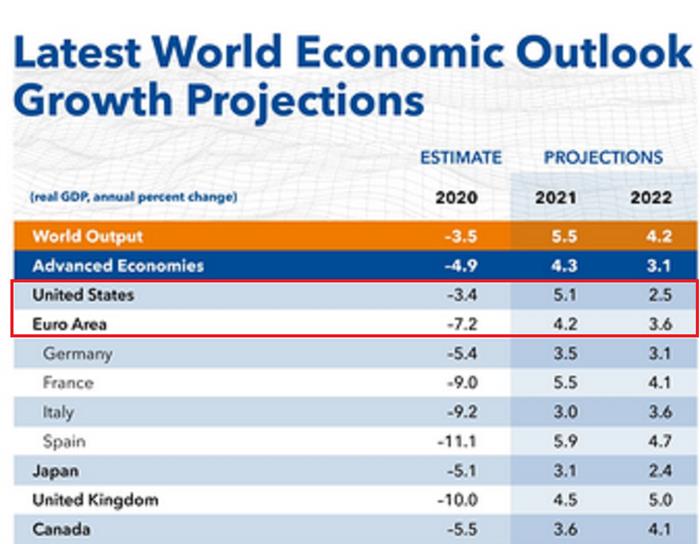
Figure8
Also noteworthy, the IMF downgraded itsGDP growth forecast for Canada. And because the USD/CAD accounts for more than9% of the movement in the USD Index (though still well below the nearly 58%derived from the EUR/USD) it’s an important variable to monitor.
Continuing the theme of Eurozoneunderperformance, U.S. consumer confidence (released on Jan. 26) rose from 87.1in December (revised) to 89.3 in January (the red box below).
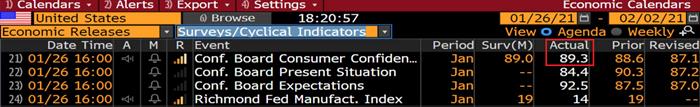
Figure9 - Source: Bloomberg/ Daniel Lacalle
In contrast, Eurozone consumerconfidence (released on Jan. 21) retreated in January. And whileboth regions’ readings are still well below pre-pandemic levels, currenciestrade on a relative basis. As a result, the relative underperformance of theEurozone is bearish for the EUR/USD.
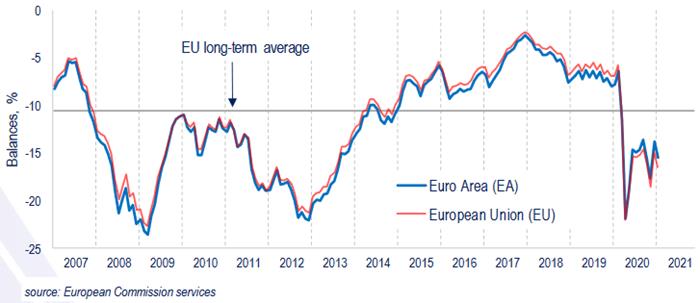
Figure10
If that wasn’t enough, the ECBessentially admitted it wants a weaker euro. On Tuesday (Jan. 26), reportssurfaced that the ECB will investigate the causes of the euro’s appreciationrelative to the greenback. Translation? The central bank is studying ways todevalue the currency.
Adding more fuel to the fire, the yielddifferential between the U.S. and Europe foretells a higher USD Index. Datingback to 2003, after the U.S. 10-Year Treasury yield troughed and began rising,the USD Index (except for 2008-2009) always followed suit.
Please see below:
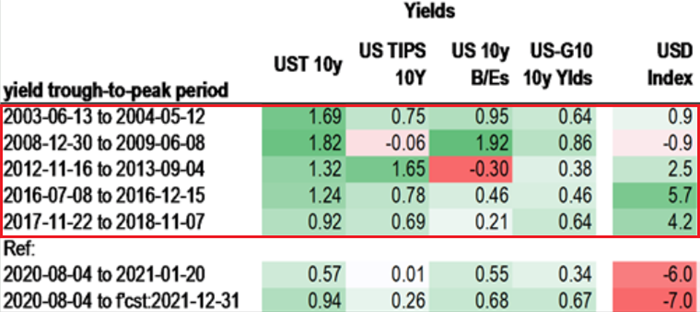
Figure11 - Source: Daniel Lacalle
In contrast, if you analyze the area atthe bottom, you can see that the U.S. 10-Year Treasury yield has bounced by 57basis points from its August low. But moving in the opposite direction, the USDIndex is lower now than it was it August.
Furthermore, notice the large divergencethat’s occurred since the beginning of December?
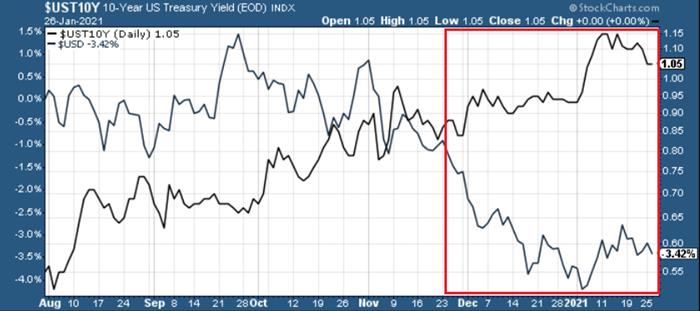
Figure12
The abnormal behavior above highlightsthe power of sentiment. Because U.S. investors ‘want’ a lower USD Index,they’re willing to overlook technicals, fundamentals, historical precedent andessentially, reality. However, if the dynamic reverses, the USD Index is ripefor a resurgence.
Circling back to the euro, the currencyis already starting to crack. On Monday (Jan. 25), I wrote that JanetYellen’s pledge to “act big” on the next coronavirus relief packageushered the EUR/GBP back above critical support.
However, on Tuesday (Jan. 26), the keylevel broke again.
Please see below:
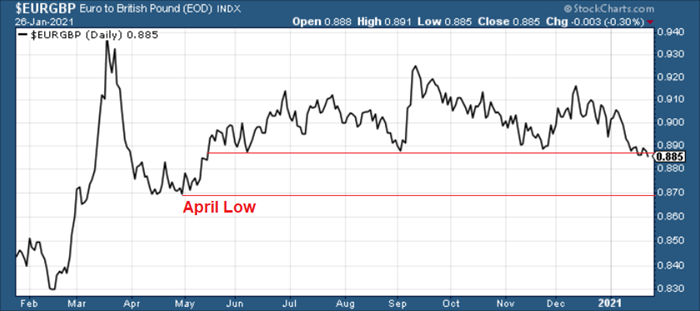
Figure13
More importantly though, a break in theEUR/GBP could be an early warning sign of a forthcoming break in the EUR/USD.
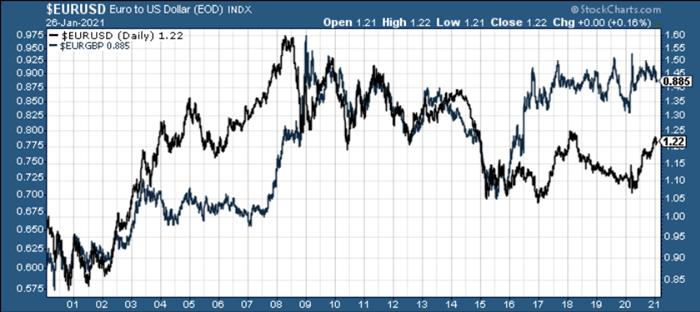
Figure14
If you analyze the chart above, ~20 yearsof history shows that the EUR/GBP and the EUR/USD tend to follow in eachother’s footsteps. As a result, if the EUR/GBP retests its April low (the nextsupport level), the EUR/USD is likely to tag along for the ride (which impliesa move back to ~1.08).
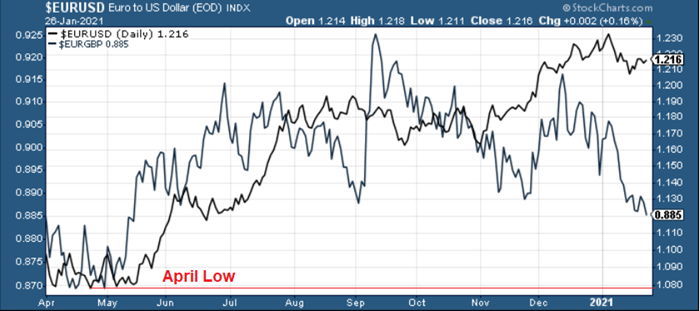
Figure15
And like a falling string of dominoes, ifthe EUR/USD retests ~1.08, the PMs should come under significant pressure.
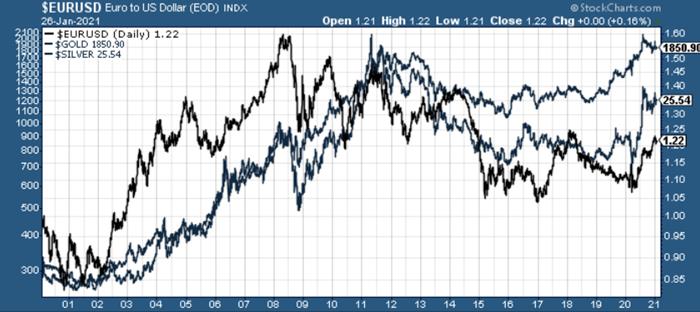
Figure16
If you analyze the chart above, you cansee that over the last ~20 years, gold and silver tend to live and die with theEUR/USD. Naturally, there are also other factors, but the point is that theperformance of this currency pair shouldn’t be ignored. As a result, a eurocollapse (or at least a significant decline in it) could deliver plenty offireworks. Conversely, once order is restored and weak Eurozone fundamentalsare accurately priced into the EUR/USD, the precious metals will present uswith an attractive buying opportunity.
Thank you for reading our free analysistoday. Please note that the above is just a small fraction of today’sall-encompassing Gold & Silver Trading Alert. The latter includes multiplepremium details such as the targets for gold and mining stocks that could bereached in the next few weeks. If you’d like to read those premium details, wehave good news for you. As soon as you sign up for our free gold newsletter,you’ll get a free 7-day no-obligation trial access to our premium Gold &Silver Trading Alerts. It’s really free – sign up today.
Przemyslaw Radomski, CFA
Founder, Editor-in-chief
Toolsfor Effective Gold & Silver Investments - SunshineProfits.com
Tools für EffektivesGold- und Silber-Investment - SunshineProfits.DE
* * * * *
About Sunshine Profits
SunshineProfits enables anyone to forecast market changes with a level of accuracy thatwas once only available to closed-door institutions. It provides free trialaccess to its best investment tools (including lists of best gold stocks and best silver stocks),proprietary gold & silver indicators, buy & sell signals, weekly newsletter, and more. Seeing is believing.
Disclaimer
All essays, research and information found aboverepresent analyses and opinions of Przemyslaw Radomski, CFA and SunshineProfits' associates only. As such, it may prove wrong and be a subject tochange without notice. Opinions and analyses were based on data available toauthors of respective essays at the time of writing. Although the informationprovided above is based on careful research and sources that are believed to beaccurate, Przemyslaw Radomski, CFA and his associates do not guarantee theaccuracy or thoroughness of the data or information reported. The opinionspublished above are neither an offer nor a recommendation to purchase or sell anysecurities. Mr. Radomski is not a Registered Securities Advisor. By readingPrzemyslaw Radomski's, CFA reports you fully agree that he will not be heldresponsible or liable for any decisions you make regarding any informationprovided in these reports. Investing, trading and speculation in any financialmarkets may involve high risk of loss. Przemyslaw Radomski, CFA, SunshineProfits' employees and affiliates as well as members of their families may havea short or long position in any securities, including those mentioned in any ofthe reports or essays, and may make additional purchases and/or sales of thosesecurities without notice.
Przemyslaw Radomski Archive |
© 2005-2019 http://www.MarketOracle.co.uk - The Market Oracle is a FREE Daily Financial Markets Analysis & Forecasting online publication.